|
|
市場調査レポート
商品コード
1502211
電気自動車用リレーの世界市場 2024-2028Global electric vehicle relays market 2024-2028 |
||||||

|
|||||||
カスタマイズ可能
|
|||||||


| 電気自動車用リレーの世界市場 2024-2028 |
|
出版日: 2024年05月17日
発行: TechNavio
ページ情報: 英文 180 Pages
納期: 即納可能
|

全表示
- 概要
- 図表
- 目次
Technavio社は、電気自動車用リレー市場をモニターしており、2023年から2028年にかけて3,773億2,310万米ドル、予測期間中のCAGRは63.49%で成長すると予測しています。
当レポートでは、電気自動車用リレー市場の全体的な分析、市場規模・予測、動向、成長促進要因、課題、約25のベンダーを網羅したベンダー分析などを掲載しています。
現在の市場シナリオ、最新動向と促進要因、市場環境全体に関する最新分析を提供しています。長期的にはソリッドステートリレーの低コスト化、電気自動車における電子機器と安全要件の増加、バッテリー電気自動車とプラグインハイブリッド電気自動車の採用増加などが市場を牽引しています。
| 市場範囲 | |
|---|---|
| 基準年 | 2024 |
| 終了年 | 2028 |
| 予測期間 | 2024-2028 |
| 成長モメンタム | 加速 |
| 前年比2024年 | 46.34% |
| CAGR | 63.49% |
| 増分額 | 3,773億2,310万米ドル |
本調査では、今後数年間の電気自動車用リレー市場成長を牽引する主要因の1つとして、リレー市場の統合を挙げています。また、高度な電気自動車充電システムの採用が増加し、リレー設計の進歩が市場の大きな需要につながります。
目次
第1章 エグゼクティブサマリー
- 市場概要
第2章 市場情勢
- 市場エコシステム
- 市場の特徴
- バリューチェーン分析
第3章 市場規模の評価
- 市場の定義
- 市場セグメント分析
- 市場規模 2023
- 市場の見通し 2023-2028
第4章 市場規模実績
- 世界電気自動車用リレー市場 2018-2022
- タイプ別セグメント分析 2018-2022
- 車両タイプ別セグメント分析 2018-2022
- 地域別セグメント分析 2018-2022
- 国別セグメント分析 2018-2022
第5章 ファイブフォース分析
- ファイブフォースの要約
- 買い手の交渉力
- 供給企業の交渉力
- 新規参入業者の脅威
- 代替品の脅威
- 競争の脅威
- 市況
第6章 市場セグメンテーション:タイプ別
- 市場セグメンテーション
- 比較:タイプ別
- プリント基板:市場規模と予測 2023-2028
- プラグイン:市場規模と予測 2023-2028
- 市場機会:タイプ別
第7章 市場セグメンテーション:車両タイプ別
- 市場セグメンテーション
- 比較:車両タイプ別
- PLDV:市場規模と予測 2023-2028
- LCV:市場規模と予測 2023-2028
- バスとトラック:市場規模と予測 2023-2028
- 市場機会:車両タイプ別
第8章 顧客情勢
- 顧客情勢の概要
第9章 地域別情勢
- 地域別セグメンテーション
- 地域別比較
- アジア太平洋:市場規模と予測 2023-2028
- 欧州:市場規模と予測 2023-2028
- 北米:市場規模と予測 2023-2028
- 南米:市場規模と予測 2023-2028
- 中東・アフリカ:市場規模と予測 2023-2028
- 中国:市場規模と予測 2023-2028
- ドイツ:市場規模と予測 2023-2028
- 米国:市場規模と予測 2023-2028
- 英国:市場規模と予測 2023-2028
- フランス:市場規模と予測 2023-2028
- 市場機会:地域別
第10章 促進要因・課題・機会・抑制要因
- 市場促進要因
- 市場の課題
- 促進要因と課題の影響
- 市場の機会・抑制要因
第11章 競合情勢
- 概要
- 競合情勢
- 混乱の状況
- 業界のリスク
第12章 競合分析
- 企業プロファイル
- 企業の市場ポジショニング
- ABB Ltd.
- American Zettler Inc.
- Aptiv
- BorgWarner Inc.
- Denso Corp.
- Fujitsu Ltd.
- HELLA GmbH Co. KGaA
- IDEC Corp.
- OMRON Corp.
- Panasonic Holdings Corp.
- Robert Bosch GmbH
- Shanghai Hu Gong Auto electric
- TE Connectivity Ltd.
- Xiamen Hongfa Electroacoustic
- YM Tech Co. Ltd.
第13章 付録
Exhibits:
- Exhibits1: Executive Summary - Chart on Market Overview
- Exhibits2: Executive Summary - Data Table on Market Overview
- Exhibits3: Executive Summary - Chart on Global Market Characteristics
- Exhibits4: Executive Summary - Chart on Market by Geography
- Exhibits5: Executive Summary - Chart on Market Segmentation by Type
- Exhibits6: Executive Summary - Chart on Market Segmentation by Vehicle Type
- Exhibits7: Executive Summary - Chart on Incremental Growth
- Exhibits8: Executive Summary - Data Table on Incremental Growth
- Exhibits9: Executive Summary - Chart on Company Market Positioning
- Exhibits10: Parent Market
- Exhibits11: Data Table on - Parent Market
- Exhibits12: Market characteristics analysis
- Exhibits13: Value Chain Analysis
- Exhibits14: Offerings of companies included in the market definition
- Exhibits15: Market segments
- Exhibits16: Chart on Global - Market size and forecast 2023-2028 ($ million)
- Exhibits17: Data Table on Global - Market size and forecast 2023-2028 ($ million)
- Exhibits18: Chart on Global Market: Year-over-year growth 2023-2028 (%)
- Exhibits19: Data Table on Global Market: Year-over-year growth 2023-2028 (%)
- Exhibits20: Historic Market Size - Data Table on Global Electric Vehicle Relays Market 2018 - 2022 ($ million)
- Exhibits21: Historic Market Size - Type Segment 2018 - 2022 ($ million)
- Exhibits22: Historic Market Size - Vehicle Type Segment 2018 - 2022 ($ million)
- Exhibits23: Historic Market Size - Geography Segment 2018 - 2022 ($ million)
- Exhibits24: Historic Market Size - Country Segment 2018 - 2022 ($ million)
- Exhibits25: Five forces analysis - Comparison between 2023 and 2028
- Exhibits26: Bargaining power of buyers - Impact of key factors 2023 and 2028
- Exhibits27: Bargaining power of suppliers - Impact of key factors in 2023 and 2028
- Exhibits28: Threat of new entrants - Impact of key factors in 2023 and 2028
- Exhibits29: Threat of substitutes - Impact of key factors in 2023 and 2028
- Exhibits30: Threat of rivalry - Impact of key factors in 2023 and 2028
- Exhibits31: Chart on Market condition - Five forces 2023 and 2028
- Exhibits32: Chart on Type - Market share 2023-2028 (%)
- Exhibits33: Data Table on Type - Market share 2023-2028 (%)
- Exhibits34: Chart on Comparison by Type
- Exhibits35: Data Table on Comparison by Type
- Exhibits36: Chart on PCB - Market size and forecast 2023-2028 ($ million)
- Exhibits37: Data Table on PCB - Market size and forecast 2023-2028 ($ million)
- Exhibits38: Chart on PCB - Year-over-year growth 2023-2028 (%)
- Exhibits39: Data Table on PCB - Year-over-year growth 2023-2028 (%)
- Exhibits40: Chart on Plug-in - Market size and forecast 2023-2028 ($ million)
- Exhibits41: Data Table on Plug-in - Market size and forecast 2023-2028 ($ million)
- Exhibits42: Chart on Plug-in - Year-over-year growth 2023-2028 (%)
- Exhibits43: Data Table on Plug-in - Year-over-year growth 2023-2028 (%)
- Exhibits44: Market opportunity by Type ($ million)
- Exhibits45: Data Table on Market opportunity by Type ($ million)
- Exhibits46: Chart on Vehicle Type - Market share 2023-2028 (%)
- Exhibits47: Data Table on Vehicle Type - Market share 2023-2028 (%)
- Exhibits48: Chart on Comparison by Vehicle Type
- Exhibits49: Data Table on Comparison by Vehicle Type
- Exhibits50: Chart on PLDVs - Market size and forecast 2023-2028 ($ million)
- Exhibits51: Data Table on PLDVs - Market size and forecast 2023-2028 ($ million)
- Exhibits52: Chart on PLDVs - Year-over-year growth 2023-2028 (%)
- Exhibits53: Data Table on PLDVs - Year-over-year growth 2023-2028 (%)
- Exhibits54: Chart on LCVs - Market size and forecast 2023-2028 ($ million)
- Exhibits55: Data Table on LCVs - Market size and forecast 2023-2028 ($ million)
- Exhibits56: Chart on LCVs - Year-over-year growth 2023-2028 (%)
- Exhibits57: Data Table on LCVs - Year-over-year growth 2023-2028 (%)
- Exhibits58: Chart on Buses and trucks - Market size and forecast 2023-2028 ($ million)
- Exhibits59: Data Table on Buses and trucks - Market size and forecast 2023-2028 ($ million)
- Exhibits60: Chart on Buses and trucks - Year-over-year growth 2023-2028 (%)
- Exhibits61: Data Table on Buses and trucks - Year-over-year growth 2023-2028 (%)
- Exhibits62: Market opportunity by Vehicle Type ($ million)
- Exhibits63: Data Table on Market opportunity by Vehicle Type ($ million)
- Exhibits64: Analysis of price sensitivity, lifecycle, customer purchase basket, adoption rates, and purchase criteria
- Exhibits65: Chart on Market share By Geographical Landscape2023-2028 (%)
- Exhibits66: Data Table on Market share By Geographical Landscape2023-2028 (%)
- Exhibits67: Chart on Geographic comparison
- Exhibits68: Data Table on Geographic comparison
- Exhibits69: Chart on APAC - Market size and forecast 2023-2028 ($ million)
- Exhibits70: Data Table on APAC - Market size and forecast 2023-2028 ($ million)
- Exhibits71: Chart on APAC - Year-over-year growth 2023-2028 (%)
- Exhibits72: Data Table on APAC - Year-over-year growth 2023-2028 (%)
- Exhibits73: Chart on Europe - Market size and forecast 2023-2028 ($ million)
- Exhibits74: Data Table on Europe - Market size and forecast 2023-2028 ($ million)
- Exhibits75: Chart on Europe - Year-over-year growth 2023-2028 (%)
- Exhibits76: Data Table on Europe - Year-over-year growth 2023-2028 (%)
- Exhibits77: Chart on North America - Market size and forecast 2023-2028 ($ million)
- Exhibits78: Data Table on North America - Market size and forecast 2023-2028 ($ million)
- Exhibits79: Chart on North America - Year-over-year growth 2023-2028 (%)
- Exhibits80: Data Table on North America - Year-over-year growth 2023-2028 (%)
- Exhibits81: Chart on South America - Market size and forecast 2023-2028 ($ million)
- Exhibits82: Data Table on South America - Market size and forecast 2023-2028 ($ million)
- Exhibits83: Chart on South America - Year-over-year growth 2023-2028 (%)
- Exhibits84: Data Table on South America - Year-over-year growth 2023-2028 (%)
- Exhibits85: Chart on Middle East and Africa - Market size and forecast 2023-2028 ($ million)
- Exhibits86: Data Table on Middle East and Africa - Market size and forecast 2023-2028 ($ million)
- Exhibits87: Chart on Middle East and Africa - Year-over-year growth 2023-2028 (%)
- Exhibits88: Data Table on Middle East and Africa - Year-over-year growth 2023-2028 (%)
- Exhibits89: Chart on China - Market size and forecast 2023-2028 ($ million)
- Exhibits90: Data Table on China - Market size and forecast 2023-2028 ($ million)
- Exhibits91: Chart on China - Year-over-year growth 2023-2028 (%)
- Exhibits92: Data Table on China - Year-over-year growth 2023-2028 (%)
- Exhibits93: Chart on Germany - Market size and forecast 2023-2028 ($ million)
- Exhibits94: Data Table on Germany - Market size and forecast 2023-2028 ($ million)
- Exhibits95: Chart on Germany - Year-over-year growth 2023-2028 (%)
- Exhibits96: Data Table on Germany - Year-over-year growth 2023-2028 (%)
- Exhibits97: Chart on US - Market size and forecast 2023-2028 ($ million)
- Exhibits98: Data Table on US - Market size and forecast 2023-2028 ($ million)
- Exhibits99: Chart on US - Year-over-year growth 2023-2028 (%)
- Exhibits100: Data Table on US - Year-over-year growth 2023-2028 (%)
- Exhibits101: Chart on UK - Market size and forecast 2023-2028 ($ million)
- Exhibits102: Data Table on UK - Market size and forecast 2023-2028 ($ million)
- Exhibits103: Chart on UK - Year-over-year growth 2023-2028 (%)
- Exhibits104: Data Table on UK - Year-over-year growth 2023-2028 (%)
- Exhibits105: Chart on France - Market size and forecast 2023-2028 ($ million)
- Exhibits106: Data Table on France - Market size and forecast 2023-2028 ($ million)
- Exhibits107: Chart on France - Year-over-year growth 2023-2028 (%)
- Exhibits108: Data Table on France - Year-over-year growth 2023-2028 (%)
- Exhibits109: Market opportunity By Geographical Landscape($ million)
- Exhibits110: Data Tables on Market opportunity By Geographical Landscape($ million)
- Exhibits111: Impact of drivers and challenges in 2023 and 2028
- Exhibits112: Overview on criticality of inputs and factors of differentiation
- Exhibits113: Overview on factors of disruption
- Exhibits114: Impact of key risks on business
- Exhibits115: Companies covered
- Exhibits116: Matrix on companies position and classification
- Exhibits117: ABB Ltd. - Overview
- Exhibits118: ABB Ltd. - Business segments
- Exhibits119: ABB Ltd. - Key news
- Exhibits120: ABB Ltd. - Key offerings
- Exhibits121: ABB Ltd. - Segment focus
- Exhibits122: American Zettler Inc. - Overview
- Exhibits123: American Zettler Inc. - Product / Service
- Exhibits124: American Zettler Inc. - Key offerings
- Exhibits125: Aptiv - Overview
- Exhibits126: Aptiv - Business segments
- Exhibits127: Aptiv - Key news
- Exhibits128: Aptiv - Key offerings
- Exhibits129: Aptiv - Segment focus
- Exhibits130: BorgWarner Inc. - Overview
- Exhibits131: BorgWarner Inc. - Business segments
- Exhibits132: BorgWarner Inc. - Key news
- Exhibits133: BorgWarner Inc. - Key offerings
- Exhibits134: BorgWarner Inc. - Segment focus
- Exhibits135: Denso Corp. - Overview
- Exhibits136: Denso Corp. - Business segments
- Exhibits137: Denso Corp. - Key news
- Exhibits138: Denso Corp. - Key offerings
- Exhibits139: Denso Corp. - Segment focus
- Exhibits140: Fujitsu Ltd. - Overview
- Exhibits141: Fujitsu Ltd. - Business segments
- Exhibits142: Fujitsu Ltd. - Key news
- Exhibits143: Fujitsu Ltd. - Key offerings
- Exhibits144: Fujitsu Ltd. - Segment focus
- Exhibits145: HELLA GmbH & Co. KGaA - Overview
- Exhibits146: HELLA GmbH & Co. KGaA - Business segments
- Exhibits147: HELLA GmbH & Co. KGaA - Key news
- Exhibits148: HELLA GmbH & Co. KGaA - Key offerings
- Exhibits149: HELLA GmbH & Co. KGaA - Segment focus
- Exhibits150: IDEC Corp. - Overview
- Exhibits151: IDEC Corp. - Business segments
- Exhibits152: IDEC Corp. - Key news
- Exhibits153: IDEC Corp. - Key offerings
- Exhibits154: IDEC Corp. - Segment focus
- Exhibits155: OMRON Corp. - Overview
- Exhibits156: OMRON Corp. - Business segments
- Exhibits157: OMRON Corp. - Key news
- Exhibits158: OMRON Corp. - Key offerings
- Exhibits159: OMRON Corp. - Segment focus
- Exhibits160: Panasonic Holdings Corp. - Overview
- Exhibits161: Panasonic Holdings Corp. - Product / Service
- Exhibits162: Panasonic Holdings Corp. - Key news
- Exhibits163: Panasonic Holdings Corp. - Key offerings
- Exhibits164: Robert Bosch GmbH - Overview
- Exhibits165: Robert Bosch GmbH - Product / Service
- Exhibits166: Robert Bosch GmbH - Key news
- Exhibits167: Robert Bosch GmbH - Key offerings
- Exhibits168: Shanghai Hu Gong Auto electric - Overview
- Exhibits169: Shanghai Hu Gong Auto electric - Product / Service
- Exhibits170: Shanghai Hu Gong Auto electric - Key offerings
- Exhibits171: TE Connectivity Ltd. - Overview
- Exhibits172: TE Connectivity Ltd. - Business segments
- Exhibits173: TE Connectivity Ltd. - Key news
- Exhibits174: TE Connectivity Ltd. - Key offerings
- Exhibits175: TE Connectivity Ltd. - Segment focus
- Exhibits176: Xiamen Hongfa Electroacoustic - Overview
- Exhibits177: Xiamen Hongfa Electroacoustic - Product / Service
- Exhibits178: Xiamen Hongfa Electroacoustic - Key offerings
- Exhibits179: YM Tech Co. Ltd. - Overview
- Exhibits180: YM Tech Co. Ltd. - Product / Service
- Exhibits181: YM Tech Co. Ltd. - Key offerings
- Exhibits182: Inclusions checklist
- Exhibits183: Exclusions checklist
- Exhibits184: Currency conversion rates for US$
- Exhibits185: Research methodology
- Exhibits186: Information sources
- Exhibits187: Data validation
- Exhibits188: Validation techniques employed for market sizing
- Exhibits189: Data synthesis
- Exhibits190: 360 degree market analysis
- Exhibits191: List of abbreviations
Technavio has been monitoring the electric vehicle relays market and is forecast to grow by USD 377323.1 mn during 2023-2028, accelerating at a CAGR of 63.49% during the forecast period. Our report on the electric vehicle relays market provides a holistic analysis, market size and forecast, trends, growth drivers, and challenges, as well as vendor analysis covering around 25 vendors.
The report offers an up-to-date analysis regarding the current market scenario, the latest trends and drivers, and the overall market environment. The market is driven by solid-state relays to become low-cost in the long run, increase in electronics and safety requirements in electric vehicles, and increasing adoption of battery electric vehicles and plug-in hybrid electric vehicles.
Technavio's electric vehicle relays market is segmented as below:
| Market Scope | |
|---|---|
| Base Year | 2024 |
| End Year | 2028 |
| Series Year | 2024-2028 |
| Growth Momentum | Accelerate |
| YOY 2024 | 46.34% |
| CAGR | 63.49% |
| Incremental Value | $377323.1mn |
By Type
- PCB
- Plug-in
By Vehicle Type
- PLDVs
- LCVs
- Buses and trucks
By Geography
- APAC
- Europe
- North America
- South America
- Middle East and Africa
This study identifies the consolidation of relay market as one of the prime reasons driving the electric vehicle relays market growth during the next few years. Also, rising adoption of advanced electric vehicle charging systems and advancements in relay design will lead to sizable demand in the market.
Technavio presents a detailed picture of the market by the way of study, synthesis, and summation of data from multiple sources by an analysis of key parameters. Our report on the electric vehicle relays market covers the following areas:
- Electric vehicle relays market sizing
- Electric vehicle relays market forecast
- Electric vehicle relays market industry analysis
Technavio's robust vendor analysis is designed to help clients improve their market position, and in line with this, this report provides a detailed analysis of several leading electric vehicle relays market vendors that include ABB Ltd., American Zettler Inc., Aptiv Plc, BorgWarner Inc., DENSO Corp., Fujitsu Ltd., Good Sky Electric Co. Ltd., HELLA GmbH and Co. KGaA, IDEC Corp., Littelfuse Inc., OMRON Corp., Panasonic Holdings Corp., Robert Bosch GmbH, Schneider Electric SE, Sensata Technologies Inc., Shanghai Hu Gong Auto electric, Siemens AG, TE Connectivity Ltd., HONGFA, and YM Tech Co. Ltd.. Also, the electric vehicle relays market analysis report includes information on upcoming trends and challenges that will influence market growth. This is to help companies strategize and leverage all forthcoming growth opportunities.
The study was conducted using an objective combination of primary and secondary information including inputs from key participants in the industry. The report contains a comprehensive market and vendor landscape in addition to an analysis of the key vendors.
Technavio presents a detailed picture of the market by the way of study, synthesis, and summation of data from multiple sources by an analysis of key parameters such as profit, pricing, competition, and promotions. It presents various market facets by identifying the key industry influencers. The data presented is comprehensive, reliable, and a result of extensive research - both primary and secondary. Technavio's market research reports provide a complete competitive landscape and an in-depth vendor selection methodology and analysis using qualitative and quantitative research to forecast accurate market growth.
Table of Contents
1 Executive Summary
- 1.1 Market overview
- Executive Summary - Chart on Market Overview
- Executive Summary - Data Table on Market Overview
- Executive Summary - Chart on Global Market Characteristics
- Executive Summary - Chart on Market by Geography
- Executive Summary - Chart on Market Segmentation by Type
- Executive Summary - Chart on Market Segmentation by Vehicle Type
- Executive Summary - Chart on Incremental Growth
- Executive Summary - Data Table on Incremental Growth
- Executive Summary - Chart on Company Market Positioning
2 Market Landscape
- 2.1 Market ecosystem
- Parent Market
- Data Table on - Parent Market
- 2.2 Market characteristics
- Market characteristics analysis
- 2.3 Value chain analysis
- Value Chain Analysis
3 Market Sizing
- 3.1 Market definition
- Offerings of companies included in the market definition
- 3.2 Market segment analysis
- Market segments
- 3.3 Market size 2023
- 3.4 Market outlook: Forecast for 2023-2028
- Chart on Global - Market size and forecast 2023-2028 ($ million)
- Data Table on Global - Market size and forecast 2023-2028 ($ million)
- Chart on Global Market: Year-over-year growth 2023-2028 (%)
- Data Table on Global Market: Year-over-year growth 2023-2028 (%)
4 Historic Market Size
- 4.1 Global Electric Vehicle Relays Market 2018 - 2022
- Historic Market Size - Data Table on Global Electric Vehicle Relays Market 2018 - 2022 ($ million)
- 4.2 Type segment analysis 2018 - 2022
- Historic Market Size - Type Segment 2018 - 2022 ($ million)
- 4.3 Vehicle Type segment analysis 2018 - 2022
- Historic Market Size - Vehicle Type Segment 2018 - 2022 ($ million)
- 4.4 Geography segment analysis 2018 - 2022
- Historic Market Size - Geography Segment 2018 - 2022 ($ million)
- 4.5 Country segment analysis 2018 - 2022
- Historic Market Size - Country Segment 2018 - 2022 ($ million)
5 Five Forces Analysis
- 5.1 Five forces summary
- Five forces analysis - Comparison between 2023 and 2028
- 5.2 Bargaining power of buyers
- Bargaining power of buyers - Impact of key factors 2023 and 2028
- 5.3 Bargaining power of suppliers
- Bargaining power of suppliers - Impact of key factors in 2023 and 2028
- 5.4 Threat of new entrants
- Threat of new entrants - Impact of key factors in 2023 and 2028
- 5.5 Threat of substitutes
- Threat of substitutes - Impact of key factors in 2023 and 2028
- 5.6 Threat of rivalry
- Threat of rivalry - Impact of key factors in 2023 and 2028
- 5.7 Market condition
- Chart on Market condition - Five forces 2023 and 2028
6 Market Segmentation by Type
- 6.1 Market segments
- Chart on Type - Market share 2023-2028 (%)
- Data Table on Type - Market share 2023-2028 (%)
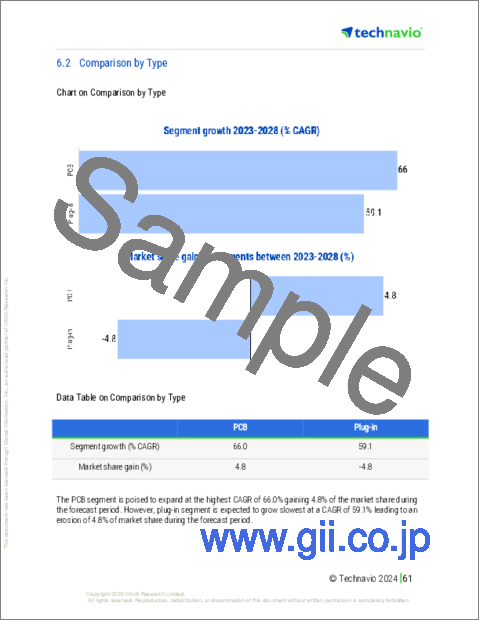
- 6.2 Comparison by Type
- Chart on Comparison by Type
- Data Table on Comparison by Type
- 6.3 PCB - Market size and forecast 2023-2028
- Chart on PCB - Market size and forecast 2023-2028 ($ million)
- Data Table on PCB - Market size and forecast 2023-2028 ($ million)
- Chart on PCB - Year-over-year growth 2023-2028 (%)
- Data Table on PCB - Year-over-year growth 2023-2028 (%)
- 6.4 Plug-in - Market size and forecast 2023-2028
- Chart on Plug-in - Market size and forecast 2023-2028 ($ million)
- Data Table on Plug-in - Market size and forecast 2023-2028 ($ million)
- Chart on Plug-in - Year-over-year growth 2023-2028 (%)
- Data Table on Plug-in - Year-over-year growth 2023-2028 (%)
- 6.5 Market opportunity by Type
- Market opportunity by Type ($ million)
- Data Table on Market opportunity by Type ($ million)
7 Market Segmentation by Vehicle Type
- 7.1 Market segments
- Chart on Vehicle Type - Market share 2023-2028 (%)
- Data Table on Vehicle Type - Market share 2023-2028 (%)
- 7.2 Comparison by Vehicle Type
- Chart on Comparison by Vehicle Type
- Data Table on Comparison by Vehicle Type
- 7.3 PLDVs - Market size and forecast 2023-2028
- Chart on PLDVs - Market size and forecast 2023-2028 ($ million)
- Data Table on PLDVs - Market size and forecast 2023-2028 ($ million)
- Chart on PLDVs - Year-over-year growth 2023-2028 (%)
- Data Table on PLDVs - Year-over-year growth 2023-2028 (%)
- 7.4 LCVs - Market size and forecast 2023-2028
- Chart on LCVs - Market size and forecast 2023-2028 ($ million)
- Data Table on LCVs - Market size and forecast 2023-2028 ($ million)
- Chart on LCVs - Year-over-year growth 2023-2028 (%)
- Data Table on LCVs - Year-over-year growth 2023-2028 (%)
- 7.5 Buses and trucks - Market size and forecast 2023-2028
- Chart on Buses and trucks - Market size and forecast 2023-2028 ($ million)
- Data Table on Buses and trucks - Market size and forecast 2023-2028 ($ million)
- Chart on Buses and trucks - Year-over-year growth 2023-2028 (%)
- Data Table on Buses and trucks - Year-over-year growth 2023-2028 (%)
- 7.6 Market opportunity by Vehicle Type
- Market opportunity by Vehicle Type ($ million)
- Data Table on Market opportunity by Vehicle Type ($ million)
8 Customer Landscape
- 8.1 Customer landscape overview
- Analysis of price sensitivity, lifecycle, customer purchase basket, adoption rates, and purchase criteria
9 Geographic Landscape
- 9.1 Geographic segmentation
- Chart on Market share By Geographical Landscape2023-2028 (%)
- Data Table on Market share By Geographical Landscape2023-2028 (%)
- 9.2 Geographic comparison
- Chart on Geographic comparison
- Data Table on Geographic comparison
- 9.3 APAC - Market size and forecast 2023-2028
- Chart on APAC - Market size and forecast 2023-2028 ($ million)
- Data Table on APAC - Market size and forecast 2023-2028 ($ million)
- Chart on APAC - Year-over-year growth 2023-2028 (%)
- Data Table on APAC - Year-over-year growth 2023-2028 (%)
- 9.4 Europe - Market size and forecast 2023-2028
- Chart on Europe - Market size and forecast 2023-2028 ($ million)
- Data Table on Europe - Market size and forecast 2023-2028 ($ million)
- Chart on Europe - Year-over-year growth 2023-2028 (%)
- Data Table on Europe - Year-over-year growth 2023-2028 (%)
- 9.5 North America - Market size and forecast 2023-2028
- Chart on North America - Market size and forecast 2023-2028 ($ million)
- Data Table on North America - Market size and forecast 2023-2028 ($ million)
- Chart on North America - Year-over-year growth 2023-2028 (%)
- Data Table on North America - Year-over-year growth 2023-2028 (%)
- 9.6 South America - Market size and forecast 2023-2028
- Chart on South America - Market size and forecast 2023-2028 ($ million)
- Data Table on South America - Market size and forecast 2023-2028 ($ million)
- Chart on South America - Year-over-year growth 2023-2028 (%)
- Data Table on South America - Year-over-year growth 2023-2028 (%)
- 9.7 Middle East and Africa - Market size and forecast 2023-2028
- Chart on Middle East and Africa - Market size and forecast 2023-2028 ($ million)
- Data Table on Middle East and Africa - Market size and forecast 2023-2028 ($ million)
- Chart on Middle East and Africa - Year-over-year growth 2023-2028 (%)
- Data Table on Middle East and Africa - Year-over-year growth 2023-2028 (%)
- 9.8 China - Market size and forecast 2023-2028
- Chart on China - Market size and forecast 2023-2028 ($ million)
- Data Table on China - Market size and forecast 2023-2028 ($ million)
- Chart on China - Year-over-year growth 2023-2028 (%)
- Data Table on China - Year-over-year growth 2023-2028 (%)
- 9.9 Germany - Market size and forecast 2023-2028
- Chart on Germany - Market size and forecast 2023-2028 ($ million)
- Data Table on Germany - Market size and forecast 2023-2028 ($ million)
- Chart on Germany - Year-over-year growth 2023-2028 (%)
- Data Table on Germany - Year-over-year growth 2023-2028 (%)
- 9.10 US - Market size and forecast 2023-2028
- Chart on US - Market size and forecast 2023-2028 ($ million)
- Data Table on US - Market size and forecast 2023-2028 ($ million)
- Chart on US - Year-over-year growth 2023-2028 (%)
- Data Table on US - Year-over-year growth 2023-2028 (%)
- 9.11 UK - Market size and forecast 2023-2028
- Chart on UK - Market size and forecast 2023-2028 ($ million)
- Data Table on UK - Market size and forecast 2023-2028 ($ million)
- Chart on UK - Year-over-year growth 2023-2028 (%)
- Data Table on UK - Year-over-year growth 2023-2028 (%)
- 9.12 France - Market size and forecast 2023-2028
- Chart on France - Market size and forecast 2023-2028 ($ million)
- Data Table on France - Market size and forecast 2023-2028 ($ million)
- Chart on France - Year-over-year growth 2023-2028 (%)
- Data Table on France - Year-over-year growth 2023-2028 (%)
- 9.13 Market opportunity by geography
- Market opportunity By Geographical Landscape($ million)
- Data Tables on Market opportunity By Geographical Landscape($ million)
10 Drivers, Challenges, and Opportunity/Restraints
- 10.1 Market drivers
- 10.2 Market challenges
- 10.3 Impact of drivers and challenges
- Impact of drivers and challenges in 2023 and 2028
- 10.4 Market opportunities/restraints
11 Competitive Landscape
- 11.1 Overview
- 11.2 Competitive Landscape
- Overview on criticality of inputs and factors of differentiation
- 11.3 Landscape disruption
- Overview on factors of disruption
- 11.4 Industry risks
- Impact of key risks on business
12 Competitive Analysis
- 12.1 Companies profiled
- Companies covered
- 12.2 Market positioning of companies
- Matrix on companies position and classification
- 12.3 ABB Ltd.
- ABB Ltd. - Overview
- ABB Ltd. - Business segments
- ABB Ltd. - Key news
- ABB Ltd. - Key offerings
- ABB Ltd. - Segment focus
- 12.4 American Zettler Inc.
- American Zettler Inc. - Overview
- American Zettler Inc. - Product / Service
- American Zettler Inc. - Key offerings
- 12.5 Aptiv
- Aptiv - Overview
- Aptiv - Business segments
- Aptiv - Key news
- Aptiv - Key offerings
- Aptiv - Segment focus
- 12.6 BorgWarner Inc.
- BorgWarner Inc. - Overview
- BorgWarner Inc. - Business segments
- BorgWarner Inc. - Key news
- BorgWarner Inc. - Key offerings
- BorgWarner Inc. - Segment focus
- 12.7 Denso Corp.
- Denso Corp. - Overview
- Denso Corp. - Business segments
- Denso Corp. - Key news
- Denso Corp. - Key offerings
- Denso Corp. - Segment focus
- 12.8 Fujitsu Ltd.
- Fujitsu Ltd. - Overview
- Fujitsu Ltd. - Business segments
- Fujitsu Ltd. - Key news
- Fujitsu Ltd. - Key offerings
- Fujitsu Ltd. - Segment focus
- 12.9 HELLA GmbH Co. KGaA
- HELLA GmbH Co. KGaA - Overview
- HELLA GmbH Co. KGaA - Business segments
- HELLA GmbH Co. KGaA - Key news
- HELLA GmbH Co. KGaA - Key offerings
- HELLA GmbH Co. KGaA - Segment focus
- 12.10 IDEC Corp.
- IDEC Corp. - Overview
- IDEC Corp. - Business segments
- IDEC Corp. - Key news
- IDEC Corp. - Key offerings
- IDEC Corp. - Segment focus
- 12.11 OMRON Corp.
- OMRON Corp. - Overview
- OMRON Corp. - Business segments
- OMRON Corp. - Key news
- OMRON Corp. - Key offerings
- OMRON Corp. - Segment focus
- 12.12 Panasonic Holdings Corp.
- Panasonic Holdings Corp. - Overview
- Panasonic Holdings Corp. - Product / Service
- Panasonic Holdings Corp. - Key news
- Panasonic Holdings Corp. - Key offerings
- 12.13 Robert Bosch GmbH
- Robert Bosch GmbH - Overview
- Robert Bosch GmbH - Product / Service
- Robert Bosch GmbH - Key news
- Robert Bosch GmbH - Key offerings
- 12.14 Shanghai Hu Gong Auto electric
- Shanghai Hu Gong Auto electric - Overview
- Shanghai Hu Gong Auto electric - Product / Service
- Shanghai Hu Gong Auto electric - Key offerings
- 12.15 TE Connectivity Ltd.
- TE Connectivity Ltd. - Overview
- TE Connectivity Ltd. - Business segments
- TE Connectivity Ltd. - Key news
- TE Connectivity Ltd. - Key offerings
- TE Connectivity Ltd. - Segment focus
- 12.16 Xiamen Hongfa Electroacoustic
- Xiamen Hongfa Electroacoustic - Overview
- Xiamen Hongfa Electroacoustic - Product / Service
- Xiamen Hongfa Electroacoustic - Key offerings
- 12.17 YM Tech Co. Ltd.
- YM Tech Co. Ltd. - Overview
- YM Tech Co. Ltd. - Product / Service
- YM Tech Co. Ltd. - Key offerings
13 Appendix
- 13.1 Scope of the report
- 13.2 Inclusions and exclusions checklist
- Inclusions checklist
- Exclusions checklist
- 13.3 Currency conversion rates for US$
- Currency conversion rates for US$
- 13.4 Research methodology
- Research methodology
- 13.5 Data procurement
- Information sources
- 13.6 Data validation
- Data validation
- 13.7 Validation techniques employed for market sizing
- Validation techniques employed for market sizing
- 13.8 Data synthesis
- Data synthesis
- 13.9 360 degree market analysis
- 360 degree market analysis
- 13.10 List of abbreviations
- List of abbreviations

