|
|
市場調査レポート
商品コード
1516297
二輪車用計器クラスターの世界市場 2024-2028Global motorcycle instrument cluster market 2024-2028 |
||||||

|
|||||||
カスタマイズ可能
|
|||||||

| 二輪車用計器クラスターの世界市場 2024-2028 |
|
出版日: 2024年06月12日
発行: TechNavio
ページ情報: 英文 180 Pages
納期: 即納可能
|

全表示
- 概要
- 図表
- 目次
二輪車用計器クラスター市場2024-2028
二輪車用計器クラスター市場は2023-2028年に2億7,080万米ドル、予測期間中のCAGRは4.02%で成長すると予測されます。当レポートでは、二輪車用計器クラスター市場の全体的な分析、市場規模・予測、動向、成長促進要因、課題、約25のベンダーを網羅したベンダー分析などを掲載しています。
現在の市場シナリオ、最新動向と促進要因、市場環境全体に関する最新分析を提供しています。市場は、LCD/TFTディスプレイの価格低下によるスケールメリット、二輪車販売を促進する都市部の混雑と過密の増加、二輪車に搭載される電子部品の増加によって牽引されています。
| 市場範囲 | |
|---|---|
| 基準年 | 2024 |
| 終了年 | 2028 |
| 予測期間 | 2024-2028 |
| 成長モメンタム | 加速 |
| 前年比2024年 | 3.61% |
| CAGR | 4.02% |
| 増分額 | 2億7,080万米ドル |
本調査では、今後数年間の二輪車用計器クラスター市場の成長を促進する主な要因の1つとして、デジタルインストルメントクラスターのさらなる発展を可能にする多層ディスプレイを挙げています。また、二輪車へのインフォテインメントシステムやマルチインフォメーションディスプレイの採用、スマートインフォテインメントシステムの開発を促進するV2Vやスマートフォンの技術は、市場の大きな需要につながります。
目次
第1章 エグゼクティブサマリー
- 市場概要
第2章 市場情勢
- 市場エコシステム
- 市場の特徴
- バリューチェーン分析
第3章 市場規模の評価
- 市場の定義
- 市場セグメント分析
- 市場規模 2023
- 市場の見通し 2023-2028
第4章 市場規模実績
- 世界二輪車用計器クラスター市場 2018-2022
- エンドユーザー別セグメント分析 2018-2022
- タイプ別セグメント分析 2018-2022
- 地域別セグメント分析 2018-2022
- 国別セグメント分析 2018-2022
第5章 ファイブフォース分析
- ファイブフォースの要約
- 買い手の交渉力
- 供給企業の交渉力
- 新規参入業者の脅威
- 代替品の脅威
- 競争の脅威
- 市況
第6章 市場セグメンテーション:エンドユーザー別
- 市場セグメンテーション
- 比較:エンドユーザー別
- 自動車:市場規模と予測 2023-2028
- 建設と鉱業:市場規模と予測 2023-2028
- その他:市場規模と予測 2023-2028
- 市場機会:エンドユーザー別
第7章 市場セグメンテーション:タイプ別
- 市場セグメンテーション
- 比較:タイプ別
- ハイブリッド:市場規模と予測 2023-2028
- デジタル:市場規模と予測 2023-2028
- アナログ:市場規模と予測 2023-2028
- 市場機会:タイプ別
第8章 顧客情勢
- 顧客情勢の概要
第9章 地域別情勢
- 地域別セグメンテーション
- 地域別比較
- アジア太平洋:市場規模と予測 2023-2028
- 北米:市場規模と予測 2023-2028
- 欧州:市場規模と予測 2023-2028
- 南米:市場規模と予測 2023-2028
- 中東・アフリカ:市場規模と予測 2023-2028
- 中国:市場規模と予測 2023-2028
- インド:市場規模と予測 2023-2028
- 米国:市場規模と予測 2023-2028
- インドネシア:市場規模と予測 2023-2028
- カナダ:市場規模と予測 2023-2028
- 市場機会:地域別
第10章 促進要因・課題・機会・抑制要因
- 市場促進要因
- 市場の課題
- 促進要因と課題の影響
- 市場の機会・抑制要因
第11章 競合情勢
- 概要
- 競合情勢
- 混乱の状況
- 業界のリスク
第12章 競合分析
- 企業プロファイル
- 企業の市場ポジショニング
- Comoto Holdings Inc.
- Continental AG
- JPM Group
- Marelli Holdings Co. Ltd.
- Microchip Technology Inc.
- MTA Spa
- Nippon Seiki Co. Ltd.
- NXP Semiconductors NV
- Qt Group
- Robert Bosch GmbH
- Texas Instruments Inc.
- Valeo SA
- Visteon Corp.
- Volkswagen AG
- Yazaki Corp.
第13章 付録
Exhibits:
- Exhibits1: Executive Summary - Chart on Market Overview
- Exhibits2: Executive Summary - Data Table on Market Overview
- Exhibits3: Executive Summary - Chart on Global Market Characteristics
- Exhibits4: Executive Summary - Chart on Market by Geography
- Exhibits5: Executive Summary - Chart on Market Segmentation by End-user
- Exhibits6: Executive Summary - Chart on Market Segmentation by Type
- Exhibits7: Executive Summary - Chart on Incremental Growth
- Exhibits8: Executive Summary - Data Table on Incremental Growth
- Exhibits9: Executive Summary - Chart on Company Market Positioning
- Exhibits10: Parent Market
- Exhibits11: Data Table on - Parent Market
- Exhibits12: Market characteristics analysis
- Exhibits13: Value Chain Analysis
- Exhibits14: Offerings of companies included in the market definition
- Exhibits15: Market segments
- Exhibits16: Chart on Global - Market size and forecast 2023-2028 ($ million)
- Exhibits17: Data Table on Global - Market size and forecast 2023-2028 ($ million)
- Exhibits18: Chart on Global Market: Year-over-year growth 2023-2028 (%)
- Exhibits19: Data Table on Global Market: Year-over-year growth 2023-2028 (%)
- Exhibits20: Historic Market Size - Data Table on Global Motorcycle Instrument Cluster Market 2018 - 2022 ($ million)
- Exhibits21: Historic Market Size - End-user Segment 2018 - 2022 ($ million)
- Exhibits22: Historic Market Size - Type Segment 2018 - 2022 ($ million)
- Exhibits23: Historic Market Size - Geography Segment 2018 - 2022 ($ million)
- Exhibits24: Historic Market Size - Country Segment 2018 - 2022 ($ million)
- Exhibits25: Five forces analysis - Comparison between 2023 and 2028
- Exhibits26: Bargaining power of buyers - Impact of key factors 2023 and 2028
- Exhibits27: Bargaining power of suppliers - Impact of key factors in 2023 and 2028
- Exhibits28: Threat of new entrants - Impact of key factors in 2023 and 2028
- Exhibits29: Threat of substitutes - Impact of key factors in 2023 and 2028
- Exhibits30: Threat of rivalry - Impact of key factors in 2023 and 2028
- Exhibits31: Chart on Market condition - Five forces 2023 and 2028
- Exhibits32: Chart on End-user - Market share 2023-2028 (%)
- Exhibits33: Data Table on End-user - Market share 2023-2028 (%)
- Exhibits34: Chart on Comparison by End-user
- Exhibits35: Data Table on Comparison by End-user
- Exhibits36: Chart on Automotive - Market size and forecast 2023-2028 ($ million)
- Exhibits37: Data Table on Automotive - Market size and forecast 2023-2028 ($ million)
- Exhibits38: Chart on Automotive - Year-over-year growth 2023-2028 (%)
- Exhibits39: Data Table on Automotive - Year-over-year growth 2023-2028 (%)
- Exhibits40: Chart on Construction and mining - Market size and forecast 2023-2028 ($ million)
- Exhibits41: Data Table on Construction and mining - Market size and forecast 2023-2028 ($ million)
- Exhibits42: Chart on Construction and mining - Year-over-year growth 2023-2028 (%)
- Exhibits43: Data Table on Construction and mining - Year-over-year growth 2023-2028 (%)
- Exhibits44: Chart on Others - Market size and forecast 2023-2028 ($ million)
- Exhibits45: Data Table on Others - Market size and forecast 2023-2028 ($ million)
- Exhibits46: Chart on Others - Year-over-year growth 2023-2028 (%)
- Exhibits47: Data Table on Others - Year-over-year growth 2023-2028 (%)
- Exhibits48: Market opportunity by End-user ($ million)
- Exhibits49: Data Table on Market opportunity by End-user ($ million)
- Exhibits50: Chart on Type - Market share 2023-2028 (%)
- Exhibits51: Data Table on Type - Market share 2023-2028 (%)
- Exhibits52: Chart on Comparison by Type
- Exhibits53: Data Table on Comparison by Type
- Exhibits54: Chart on Hybrid - Market size and forecast 2023-2028 ($ million)
- Exhibits55: Data Table on Hybrid - Market size and forecast 2023-2028 ($ million)
- Exhibits56: Chart on Hybrid - Year-over-year growth 2023-2028 (%)
- Exhibits57: Data Table on Hybrid - Year-over-year growth 2023-2028 (%)
- Exhibits58: Chart on Digital - Market size and forecast 2023-2028 ($ million)
- Exhibits59: Data Table on Digital - Market size and forecast 2023-2028 ($ million)
- Exhibits60: Chart on Digital - Year-over-year growth 2023-2028 (%)
- Exhibits61: Data Table on Digital - Year-over-year growth 2023-2028 (%)
- Exhibits62: Chart on Analog - Market size and forecast 2023-2028 ($ million)
- Exhibits63: Data Table on Analog - Market size and forecast 2023-2028 ($ million)
- Exhibits64: Chart on Analog - Year-over-year growth 2023-2028 (%)
- Exhibits65: Data Table on Analog - Year-over-year growth 2023-2028 (%)
- Exhibits66: Market opportunity by Type ($ million)
- Exhibits67: Data Table on Market opportunity by Type ($ million)
- Exhibits68: Analysis of price sensitivity, lifecycle, customer purchase basket, adoption rates, and purchase criteria
- Exhibits69: Chart on Market share by geography 2023-2028 (%)
- Exhibits70: Data Table on Market share by geography 2023-2028 (%)
- Exhibits71: Chart on Geographic comparison
- Exhibits72: Data Table on Geographic comparison
- Exhibits73: Chart on APAC - Market size and forecast 2023-2028 ($ million)
- Exhibits74: Data Table on APAC - Market size and forecast 2023-2028 ($ million)
- Exhibits75: Chart on APAC - Year-over-year growth 2023-2028 (%)
- Exhibits76: Data Table on APAC - Year-over-year growth 2023-2028 (%)
- Exhibits77: Chart on North America - Market size and forecast 2023-2028 ($ million)
- Exhibits78: Data Table on North America - Market size and forecast 2023-2028 ($ million)
- Exhibits79: Chart on North America - Year-over-year growth 2023-2028 (%)
- Exhibits80: Data Table on North America - Year-over-year growth 2023-2028 (%)
- Exhibits81: Chart on Europe - Market size and forecast 2023-2028 ($ million)
- Exhibits82: Data Table on Europe - Market size and forecast 2023-2028 ($ million)
- Exhibits83: Chart on Europe - Year-over-year growth 2023-2028 (%)
- Exhibits84: Data Table on Europe - Year-over-year growth 2023-2028 (%)
- Exhibits85: Chart on South America - Market size and forecast 2023-2028 ($ million)
- Exhibits86: Data Table on South America - Market size and forecast 2023-2028 ($ million)
- Exhibits87: Chart on South America - Year-over-year growth 2023-2028 (%)
- Exhibits88: Data Table on South America - Year-over-year growth 2023-2028 (%)
- Exhibits89: Chart on Middle East and Africa - Market size and forecast 2023-2028 ($ million)
- Exhibits90: Data Table on Middle East and Africa - Market size and forecast 2023-2028 ($ million)
- Exhibits91: Chart on Middle East and Africa - Year-over-year growth 2023-2028 (%)
- Exhibits92: Data Table on Middle East and Africa - Year-over-year growth 2023-2028 (%)
- Exhibits93: Chart on China - Market size and forecast 2023-2028 ($ million)
- Exhibits94: Data Table on China - Market size and forecast 2023-2028 ($ million)
- Exhibits95: Chart on China - Year-over-year growth 2023-2028 (%)
- Exhibits96: Data Table on China - Year-over-year growth 2023-2028 (%)
- Exhibits97: Chart on India - Market size and forecast 2023-2028 ($ million)
- Exhibits98: Data Table on India - Market size and forecast 2023-2028 ($ million)
- Exhibits99: Chart on India - Year-over-year growth 2023-2028 (%)
- Exhibits100: Data Table on India - Year-over-year growth 2023-2028 (%)
- Exhibits101: Chart on US - Market size and forecast 2023-2028 ($ million)
- Exhibits102: Data Table on US - Market size and forecast 2023-2028 ($ million)
- Exhibits103: Chart on US - Year-over-year growth 2023-2028 (%)
- Exhibits104: Data Table on US - Year-over-year growth 2023-2028 (%)
- Exhibits105: Chart on Indonesia - Market size and forecast 2023-2028 ($ million)
- Exhibits106: Data Table on Indonesia - Market size and forecast 2023-2028 ($ million)
- Exhibits107: Chart on Indonesia - Year-over-year growth 2023-2028 (%)
- Exhibits108: Data Table on Indonesia - Year-over-year growth 2023-2028 (%)
- Exhibits109: Chart on Canada - Market size and forecast 2023-2028 ($ million)
- Exhibits110: Data Table on Canada - Market size and forecast 2023-2028 ($ million)
- Exhibits111: Chart on Canada - Year-over-year growth 2023-2028 (%)
- Exhibits112: Data Table on Canada - Year-over-year growth 2023-2028 (%)
- Exhibits113: Market opportunity by geography ($ million)
- Exhibits114: Data Tables on Market opportunity by geography ($ million)
- Exhibits115: Impact of drivers and challenges in 2023 and 2028
- Exhibits116: Overview on criticality of inputs and factors of differentiation
- Exhibits117: Overview on factors of disruption
- Exhibits118: Impact of key risks on business
- Exhibits119: Companies covered
- Exhibits120: Matrix on companies position and classification
- Exhibits121: Comoto Holdings Inc. - Overview
- Exhibits122: Comoto Holdings Inc. - Product / Service
- Exhibits123: Comoto Holdings Inc. - Key offerings
- Exhibits124: Continental AG - Overview
- Exhibits125: Continental AG - Business segments
- Exhibits126: Continental AG - Key news
- Exhibits127: Continental AG - Key offerings
- Exhibits128: Continental AG - Segment focus
- Exhibits129: JPM Group - Overview
- Exhibits130: JPM Group - Product / Service
- Exhibits131: JPM Group - Key offerings
- Exhibits132: Marelli Holdings Co. Ltd. - Overview
- Exhibits133: Marelli Holdings Co. Ltd. - Product / Service
- Exhibits134: Marelli Holdings Co. Ltd. - Key news
- Exhibits135: Marelli Holdings Co. Ltd. - Key offerings
- Exhibits136: Microchip Technology Inc. - Overview
- Exhibits137: Microchip Technology Inc. - Business segments
- Exhibits138: Microchip Technology Inc. - Key news
- Exhibits139: Microchip Technology Inc. - Key offerings
- Exhibits140: Microchip Technology Inc. - Segment focus
- Exhibits141: MTA Spa - Overview
- Exhibits142: MTA Spa - Product / Service
- Exhibits143: MTA Spa - Key offerings
- Exhibits144: Nippon Seiki Co. Ltd. - Overview
- Exhibits145: Nippon Seiki Co. Ltd. - Business segments
- Exhibits146: Nippon Seiki Co. Ltd. - Key offerings
- Exhibits147: Nippon Seiki Co. Ltd. - Segment focus
- Exhibits148: NXP Semiconductors NV - Overview
- Exhibits149: NXP Semiconductors NV - Product / Service
- Exhibits150: NXP Semiconductors NV - Key news
- Exhibits151: NXP Semiconductors NV - Key offerings
- Exhibits152: Qt Group - Overview
- Exhibits153: Qt Group - Product / Service
- Exhibits154: Qt Group - Key offerings
- Exhibits155: Robert Bosch GmbH - Overview
- Exhibits156: Robert Bosch GmbH - Product / Service
- Exhibits157: Robert Bosch GmbH - Key news
- Exhibits158: Robert Bosch GmbH - Key offerings
- Exhibits159: Texas Instruments Inc. - Overview
- Exhibits160: Texas Instruments Inc. - Business segments
- Exhibits161: Texas Instruments Inc. - Key news
- Exhibits162: Texas Instruments Inc. - Key offerings
- Exhibits163: Texas Instruments Inc. - Segment focus
- Exhibits164: Valeo SA - Overview
- Exhibits165: Valeo SA - Business segments
- Exhibits166: Valeo SA - Key news
- Exhibits167: Valeo SA - Key offerings
- Exhibits168: Valeo SA - Segment focus
- Exhibits169: Visteon Corp. - Overview
- Exhibits170: Visteon Corp. - Product / Service
- Exhibits171: Visteon Corp. - Key news
- Exhibits172: Visteon Corp. - Key offerings
- Exhibits173: Volkswagen AG - Overview
- Exhibits174: Volkswagen AG - Business segments
- Exhibits175: Volkswagen AG - Key news
- Exhibits176: Volkswagen AG - Key offerings
- Exhibits177: Volkswagen AG - Segment focus
- Exhibits178: Yazaki Corp. - Overview
- Exhibits179: Yazaki Corp. - Product / Service
- Exhibits180: Yazaki Corp. - Key offerings
- Exhibits181: Inclusions checklist
- Exhibits182: Exclusions checklist
- Exhibits183: Currency conversion rates for US$
- Exhibits184: Research methodology
- Exhibits185: Information sources
- Exhibits186: Data validation
- Exhibits187: Validation techniques employed for market sizing
- Exhibits188: Data synthesis
- Exhibits189: 360 degree market analysis
- Exhibits190: List of abbreviations
Motorcycle Instrument Cluster Market 2024-2028
The motorcycle instrument cluster market is forecasted to grow by USD 270.8 mn during 2023-2028, accelerating at a CAGR of 4.02% during the forecast period. The report on the motorcycle instrument cluster market provides a holistic analysis, market size and forecast, trends, growth drivers, and challenges, as well as vendor analysis covering around 25 vendors.
The report offers an up-to-date analysis regarding the current market scenario, the latest trends and drivers, and the overall market environment. The market is driven by economies of scale benefits owing to declining prices of LCD/TFT displays, increasing congestion and overcrowding in cities driving motorcycle sales, and increasing number of electronic components in motorcycles.
| Market Scope | |
|---|---|
| Base Year | 2024 |
| End Year | 2028 |
| Series Year | 2024-2028 |
| Growth Momentum | Accelerate |
| YOY 2024 | 3.61% |
| CAGR | 4.02% |
| Incremental Value | $270.8mn |
Technavio's motorcycle instrument cluster market is segmented as below:
By End-user
- Automotive
- Construction and mining
- Others
By Type
- Hybrid
- Digital
- Analog
By Geography
- APAC
- North America
- Europe
- South America
- Middle East and Africa
This study identifies the multilayer displays enabling further developments in digital instrument clusters as one of the prime reasons driving the motorcycle instrument cluster market growth during the next few years. Also, adoption of infotainment systems and multi-information displays in motorcycles and V2V and smartphone technologies driving development of smart infotainment systems will lead to sizable demand in the market.
The report on the motorcycle instrument cluster market covers the following areas:
- Motorcycle instrument cluster market sizing
- Motorcycle instrument cluster market forecast
- Motorcycle instrument cluster market industry analysis
The robust vendor analysis is designed to help clients improve their market position, and in line with this, this report provides a detailed analysis of several leading motorcycle instrument cluster market vendors that include Comoto Holdings Inc., Continental AG, Dakota Digital Inc., JPM Group, Koso North America, Marelli Holdings Co. Ltd., Microchip Technology Inc., motogadget GmbH, MTA Spa, Nippon Seiki Co. Ltd., NXP Semiconductors NV, Qt Group, Robert Bosch GmbH, Suprajit Engineering Ltd., Texas Instruments Inc., TRAIL TECH, Valeo SA, Visteon Corp., Volkswagen AG, and Yazaki Corp.. Also, the motorcycle instrument cluster market analysis report includes information on upcoming trends and challenges that will influence market growth. This is to help companies strategize and leverage all forthcoming growth opportunities.
The study was conducted using an objective combination of primary and secondary information including inputs from key participants in the industry. The report contains a comprehensive market and vendor landscape in addition to an analysis of the key vendors.
The publisher presents a detailed picture of the market by the way of study, synthesis, and summation of data from multiple sources by an analysis of key parameters such as profit, pricing, competition, and promotions. It presents various market facets by identifying the key industry influencers. The data presented is comprehensive, reliable, and a result of extensive research - both primary and secondary. The market research reports provide a complete competitive landscape and an in-depth vendor selection methodology and analysis using qualitative and quantitative research to forecast the accurate market growth.
Table of Contents
1 Executive Summary
- 1.1 Market overview
- Executive Summary - Chart on Market Overview
- Executive Summary - Data Table on Market Overview
- Executive Summary - Chart on Global Market Characteristics
- Executive Summary - Chart on Market by Geography
- Executive Summary - Chart on Market Segmentation by End-user
- Executive Summary - Chart on Market Segmentation by Type
- Executive Summary - Chart on Incremental Growth
- Executive Summary - Data Table on Incremental Growth
- Executive Summary - Chart on Company Market Positioning
2 Market Landscape
- 2.1 Market ecosystem
- Parent Market
- Data Table on - Parent Market
- 2.2 Market characteristics
- Market characteristics analysis
- 2.3 Value chain analysis
- Value Chain Analysis
3 Market Sizing
- 3.1 Market definition
- Offerings of companies included in the market definition
- 3.2 Market segment analysis
- Market segments
- 3.3 Market size 2023
- 3.4 Market outlook: Forecast for 2023-2028
- Chart on Global - Market size and forecast 2023-2028 ($ million)
- Data Table on Global - Market size and forecast 2023-2028 ($ million)
- Chart on Global Market: Year-over-year growth 2023-2028 (%)
- Data Table on Global Market: Year-over-year growth 2023-2028 (%)
4 Historic Market Size
- 4.1 Global Motorcycle Instrument Cluster Market 2018 - 2022
- Historic Market Size - Data Table on Global Motorcycle Instrument Cluster Market 2018 - 2022 ($ million)
- 4.2 End-user segment analysis 2018 - 2022
- Historic Market Size - End-user Segment 2018 - 2022 ($ million)
- 4.3 Type segment analysis 2018 - 2022
- Historic Market Size - Type Segment 2018 - 2022 ($ million)
- 4.4 Geography segment analysis 2018 - 2022
- Historic Market Size - Geography Segment 2018 - 2022 ($ million)
- 4.5 Country segment analysis 2018 - 2022
- Historic Market Size - Country Segment 2018 - 2022 ($ million)
5 Five Forces Analysis
- 5.1 Five forces summary
- Five forces analysis - Comparison between 2023 and 2028
- 5.2 Bargaining power of buyers
- Bargaining power of buyers - Impact of key factors 2023 and 2028
- 5.3 Bargaining power of suppliers
- Bargaining power of suppliers - Impact of key factors in 2023 and 2028
- 5.4 Threat of new entrants
- Threat of new entrants - Impact of key factors in 2023 and 2028
- 5.5 Threat of substitutes
- Threat of substitutes - Impact of key factors in 2023 and 2028
- 5.6 Threat of rivalry
- Threat of rivalry - Impact of key factors in 2023 and 2028
- 5.7 Market condition
- Chart on Market condition - Five forces 2023 and 2028
6 Market Segmentation by End-user
- 6.1 Market segments
- Chart on End-user - Market share 2023-2028 (%)
- Data Table on End-user - Market share 2023-2028 (%)
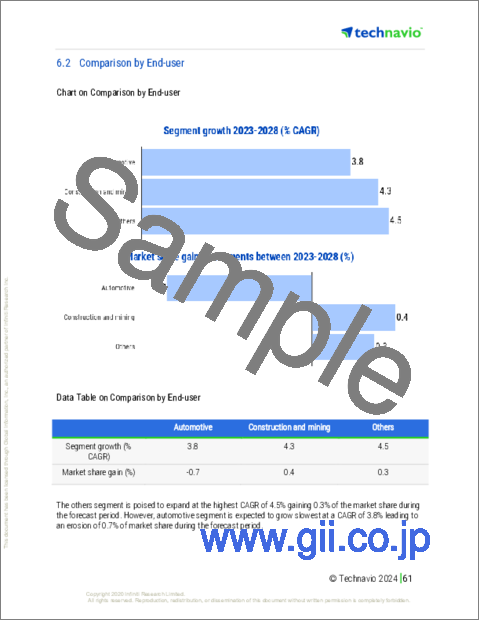
- 6.2 Comparison by End-user
- Chart on Comparison by End-user
- Data Table on Comparison by End-user
- 6.3 Automotive - Market size and forecast 2023-2028
- Chart on Automotive - Market size and forecast 2023-2028 ($ million)
- Data Table on Automotive - Market size and forecast 2023-2028 ($ million)
- Chart on Automotive - Year-over-year growth 2023-2028 (%)
- Data Table on Automotive - Year-over-year growth 2023-2028 (%)
- 6.4 Construction and mining - Market size and forecast 2023-2028
- Chart on Construction and mining - Market size and forecast 2023-2028 ($ million)
- Data Table on Construction and mining - Market size and forecast 2023-2028 ($ million)
- Chart on Construction and mining - Year-over-year growth 2023-2028 (%)
- Data Table on Construction and mining - Year-over-year growth 2023-2028 (%)
- 6.5 Others - Market size and forecast 2023-2028
- Chart on Others - Market size and forecast 2023-2028 ($ million)
- Data Table on Others - Market size and forecast 2023-2028 ($ million)
- Chart on Others - Year-over-year growth 2023-2028 (%)
- Data Table on Others - Year-over-year growth 2023-2028 (%)
- 6.6 Market opportunity by End-user
- Market opportunity by End-user ($ million)
- Data Table on Market opportunity by End-user ($ million)
7 Market Segmentation by Type
- 7.1 Market segments
- Chart on Type - Market share 2023-2028 (%)
- Data Table on Type - Market share 2023-2028 (%)
- 7.2 Comparison by Type
- Chart on Comparison by Type
- Data Table on Comparison by Type
- 7.3 Hybrid - Market size and forecast 2023-2028
- Chart on Hybrid - Market size and forecast 2023-2028 ($ million)
- Data Table on Hybrid - Market size and forecast 2023-2028 ($ million)
- Chart on Hybrid - Year-over-year growth 2023-2028 (%)
- Data Table on Hybrid - Year-over-year growth 2023-2028 (%)
- 7.4 Digital - Market size and forecast 2023-2028
- Chart on Digital - Market size and forecast 2023-2028 ($ million)
- Data Table on Digital - Market size and forecast 2023-2028 ($ million)
- Chart on Digital - Year-over-year growth 2023-2028 (%)
- Data Table on Digital - Year-over-year growth 2023-2028 (%)
- 7.5 Analog - Market size and forecast 2023-2028
- Chart on Analog - Market size and forecast 2023-2028 ($ million)
- Data Table on Analog - Market size and forecast 2023-2028 ($ million)
- Chart on Analog - Year-over-year growth 2023-2028 (%)
- Data Table on Analog - Year-over-year growth 2023-2028 (%)
- 7.6 Market opportunity by Type
- Market opportunity by Type ($ million)
- Data Table on Market opportunity by Type ($ million)
8 Customer Landscape
- 8.1 Customer landscape overview
- Analysis of price sensitivity, lifecycle, customer purchase basket, adoption rates, and purchase criteria
9 Geographic Landscape
- 9.1 Geographic segmentation
- Chart on Market share by geography 2023-2028 (%)
- Data Table on Market share by geography 2023-2028 (%)
- 9.2 Geographic comparison
- Chart on Geographic comparison
- Data Table on Geographic comparison
- 9.3 APAC - Market size and forecast 2023-2028
- Chart on APAC - Market size and forecast 2023-2028 ($ million)
- Data Table on APAC - Market size and forecast 2023-2028 ($ million)
- Chart on APAC - Year-over-year growth 2023-2028 (%)
- Data Table on APAC - Year-over-year growth 2023-2028 (%)
- 9.4 North America - Market size and forecast 2023-2028
- Chart on North America - Market size and forecast 2023-2028 ($ million)
- Data Table on North America - Market size and forecast 2023-2028 ($ million)
- Chart on North America - Year-over-year growth 2023-2028 (%)
- Data Table on North America - Year-over-year growth 2023-2028 (%)
- 9.5 Europe - Market size and forecast 2023-2028
- Chart on Europe - Market size and forecast 2023-2028 ($ million)
- Data Table on Europe - Market size and forecast 2023-2028 ($ million)
- Chart on Europe - Year-over-year growth 2023-2028 (%)
- Data Table on Europe - Year-over-year growth 2023-2028 (%)
- 9.6 South America - Market size and forecast 2023-2028
- Chart on South America - Market size and forecast 2023-2028 ($ million)
- Data Table on South America - Market size and forecast 2023-2028 ($ million)
- Chart on South America - Year-over-year growth 2023-2028 (%)
- Data Table on South America - Year-over-year growth 2023-2028 (%)
- 9.7 Middle East and Africa - Market size and forecast 2023-2028
- Chart on Middle East and Africa - Market size and forecast 2023-2028 ($ million)
- Data Table on Middle East and Africa - Market size and forecast 2023-2028 ($ million)
- Chart on Middle East and Africa - Year-over-year growth 2023-2028 (%)
- Data Table on Middle East and Africa - Year-over-year growth 2023-2028 (%)
- 9.8 China - Market size and forecast 2023-2028
- Chart on China - Market size and forecast 2023-2028 ($ million)
- Data Table on China - Market size and forecast 2023-2028 ($ million)
- Chart on China - Year-over-year growth 2023-2028 (%)
- Data Table on China - Year-over-year growth 2023-2028 (%)
- 9.9 India - Market size and forecast 2023-2028
- Chart on India - Market size and forecast 2023-2028 ($ million)
- Data Table on India - Market size and forecast 2023-2028 ($ million)
- Chart on India - Year-over-year growth 2023-2028 (%)
- Data Table on India - Year-over-year growth 2023-2028 (%)
- 9.10 US - Market size and forecast 2023-2028
- Chart on US - Market size and forecast 2023-2028 ($ million)
- Data Table on US - Market size and forecast 2023-2028 ($ million)
- Chart on US - Year-over-year growth 2023-2028 (%)
- Data Table on US - Year-over-year growth 2023-2028 (%)
- 9.11 Indonesia - Market size and forecast 2023-2028
- Chart on Indonesia - Market size and forecast 2023-2028 ($ million)
- Data Table on Indonesia - Market size and forecast 2023-2028 ($ million)
- Chart on Indonesia - Year-over-year growth 2023-2028 (%)
- Data Table on Indonesia - Year-over-year growth 2023-2028 (%)
- 9.12 Canada - Market size and forecast 2023-2028
- Chart on Canada - Market size and forecast 2023-2028 ($ million)
- Data Table on Canada - Market size and forecast 2023-2028 ($ million)
- Chart on Canada - Year-over-year growth 2023-2028 (%)
- Data Table on Canada - Year-over-year growth 2023-2028 (%)
- 9.13 Market opportunity by geography
- Market opportunity by geography ($ million)
- Data Tables on Market opportunity by geography ($ million)
10 Drivers, Challenges, and Opportunity/Restraints
- 10.1 Market drivers
- 10.2 Market challenges
- 10.3 Impact of drivers and challenges
- Impact of drivers and challenges in 2023 and 2028
- 10.4 Market opportunities/restraints
11 Competitive Landscape
- 11.1 Overview
- 11.2 Competitive Landscape
- Overview on criticality of inputs and factors of differentiation
- 11.3 Landscape disruption
- Overview on factors of disruption
- 11.4 Industry risks
- Impact of key risks on business
12 Competitive Analysis
- 12.1 Companies profiled
- Companies covered
- 12.2 Market positioning of companies
- Matrix on companies position and classification
- 12.3 Comoto Holdings Inc.
- Comoto Holdings Inc. - Overview
- Comoto Holdings Inc. - Product / Service
- Comoto Holdings Inc. - Key offerings
- 12.4 Continental AG
- Continental AG - Overview
- Continental AG - Business segments
- Continental AG - Key news
- Continental AG - Key offerings
- Continental AG - Segment focus
- 12.5 JPM Group
- JPM Group - Overview
- JPM Group - Product / Service
- JPM Group - Key offerings
- 12.6 Marelli Holdings Co. Ltd.
- Marelli Holdings Co. Ltd. - Overview
- Marelli Holdings Co. Ltd. - Product / Service
- Marelli Holdings Co. Ltd. - Key news
- Marelli Holdings Co. Ltd. - Key offerings
- 12.7 Microchip Technology Inc.
- Microchip Technology Inc. - Overview
- Microchip Technology Inc. - Business segments
- Microchip Technology Inc. - Key news
- Microchip Technology Inc. - Key offerings
- Microchip Technology Inc. - Segment focus
- 12.8 MTA Spa
- MTA Spa - Overview
- MTA Spa - Product / Service
- MTA Spa - Key offerings
- 12.9 Nippon Seiki Co. Ltd.
- Nippon Seiki Co. Ltd. - Overview
- Nippon Seiki Co. Ltd. - Business segments
- Nippon Seiki Co. Ltd. - Key offerings
- Nippon Seiki Co. Ltd. - Segment focus
- 12.10 NXP Semiconductors NV
- NXP Semiconductors NV - Overview
- NXP Semiconductors NV - Product / Service
- NXP Semiconductors NV - Key news
- NXP Semiconductors NV - Key offerings
- 12.11 Qt Group
- Qt Group - Overview
- Qt Group - Product / Service
- Qt Group - Key offerings
- 12.12 Robert Bosch GmbH
- Robert Bosch GmbH - Overview
- Robert Bosch GmbH - Product / Service
- Robert Bosch GmbH - Key news
- Robert Bosch GmbH - Key offerings
- 12.13 Texas Instruments Inc.
- Texas Instruments Inc. - Overview
- Texas Instruments Inc. - Business segments
- Texas Instruments Inc. - Key news
- Texas Instruments Inc. - Key offerings
- Texas Instruments Inc. - Segment focus
- 12.14 Valeo SA
- Valeo SA - Overview
- Valeo SA - Business segments
- Valeo SA - Key news
- Valeo SA - Key offerings
- Valeo SA - Segment focus
- 12.15 Visteon Corp.
- Visteon Corp. - Overview
- Visteon Corp. - Product / Service
- Visteon Corp. - Key news
- Visteon Corp. - Key offerings
- 12.16 Volkswagen AG
- Volkswagen AG - Overview
- Volkswagen AG - Business segments
- Volkswagen AG - Key news
- Volkswagen AG - Key offerings
- Volkswagen AG - Segment focus
- 12.17 Yazaki Corp.
- Yazaki Corp. - Overview
- Yazaki Corp. - Product / Service
- Yazaki Corp. - Key offerings
13 Appendix
- 13.1 Scope of the report
- 13.2 Inclusions and exclusions checklist
- Inclusions checklist
- Exclusions checklist
- 13.3 Currency conversion rates for US$
- Currency conversion rates for US$
- 13.4 Research methodology
- Research methodology
- 13.5 Data procurement
- Information sources
- 13.6 Data validation
- Data validation
- 13.7 Validation techniques employed for market sizing
- Validation techniques employed for market sizing
- 13.8 Data synthesis
- Data synthesis
- 13.9 360 degree market analysis
- 360 degree market analysis
- 13.10 List of abbreviations
- List of abbreviations
