|
|
市場調査レポート
商品コード
1491440
搾乳ロボットの世界市場 2024-2028Global milking robot market 2024-2028 |
||||||
|
|||||||
カスタマイズ可能
|
|||||||

| 搾乳ロボットの世界市場 2024-2028 |
|
出版日: 2024年05月22日
発行: TechNavio
ページ情報: 英文 165 Pages
納期: 即納可能
|

全表示
- 概要
- 図表
- 目次
搾乳ロボット市場は2023-2028年に7億4,320万米ドル、予測期間中のCAGRは8.9%で成長すると予測されます。
当レポートでは、搾乳ロボット市場の全体的な分析、市場規模・予測、動向、成長促進要因、課題、約25のベンダーを網羅したベンダー分析などを掲載しています。
現在の市場シナリオ、最新動向と促進要因、市場環境全体に関する最新分析を提供しています。市場は、技術不足に対処するための技術の採用、従来の搾乳プロセスに対する優位性、搾乳ロボットのハードウェアとソフトウェアにおける技術革新によって牽引されています。
| 市場範囲 | |
|---|---|
| 基準年 | 2024 |
| 終了年 | 2028 |
| 予測期間 | 2024-2028 |
| 成長モメンタム | 加速 |
| 前年比2024年 | 7.98% |
| CAGR | 8.9% |
| 増分額 | 7億4,320万米ドル |
本調査では、搾乳ロボットで使用されるセンサーの改良が、今後数年間の搾乳ロボット市場成長を牽引する主要因の1つであると指摘しています。また、生乳生産における分析を強化するためのロボット改修プログラム、ソフトウェアやモバイルアプリの採用も市場の大きな需要につながります。
目次
第1章 エグゼクティブサマリー
- 市場概要
第2章 市場情勢
- 市場エコシステム
- 市場の特徴
- バリューチェーン分析
第3章 市場規模の評価
- 市場の定義
- 市場セグメント分析
- 市場規模 2023
- 市場の見通し 2023-2028
第4章 市場規模実績
- 世界の搾乳ロボット市場 2018-2022
- 製品別セグメント分析 2018-2022
- コンポーネント別セグメント分析 2018-2022
- 地域別セグメント分析 2018-2022
- 国別セグメント分析 2018-2022
第5章 ファイブフォース分析
- ファイブフォースの要約
- 買い手の交渉力
- 供給企業の交渉力
- 新規参入業者の脅威
- 代替品の脅威
- 競争の脅威
- 市況
第6章 製品別:市場セグメンテーション
- 市場セグメンテーション
- 比較:製品別
- スタンドアロンユニット:市場規模と予測 2023-2028
- マルチプルストアユニット:市場規模と予測 2023-2028
- ロータリーユニット:市場規模と予測 2023-2028
- 市場機会:製品別
第7章 コンポーネント別:市場セグメンテーション
- 市場セグメンテーション
- 比較:コンポーネント別
- ハードウェア:市場規模と予測 2023-2028
- ソフトウェア:市場規模と予測 2023-2028
- サービス:市場規模と予測 2023-2028
- 市場機会:コンポーネント別
第8章 顧客情勢
- 顧客情勢の概要
第9章 地域別情勢
- 地域別セグメンテーション
- 地域別比較
- 欧州:市場規模と予測 2023-2028
- 北米:市場規模と予測 2023-2028
- アジア太平洋:市場規模と予測 2023-2028
- 南米:市場規模と予測 2023-2028
- 中東・アフリカ:市場規模と予測 2023-2028
- 米国:市場規模と予測 2023-2028
- 中国:市場規模と予測 2023-2028
- ドイツ:市場規模と予測 2023-2028
- 英国:市場規模と予測 2023-2028
- カナダ:市場規模と予測 2023-2028
- 市場機会:地域情勢別
第10章 促進要因・課題・機会・抑制要因
- 市場促進要因
- 市場の課題
- 促進要因と課題の影響
- 市場の機会・抑制要因
第11章 競合情勢
- 概要
- 競合情勢
- 混乱の状況
- 業界のリスク
第12章 競合分析
- 企業プロファイル
- 企業の市場ポジショニング
- Afimilk Ltd.
- Allflex Group
- AMS Galaxy USA
- Dairymaster
- Fabdec Ltd.
- Fullwood Ltd.
- GEA Group AG
- Hokofarm Group
- Lely International NV
- Livestock Improvement Corp. Ltd.
- Madison One Holdings LLC
- Milkplan SA
- Milkwell Milking Systems
- Read Industrial Ltd.
- S.A. Christensen and Co.
第13章 付録
Exhibits:
- Exhibits1: Executive Summary - Chart on Market Overview
- Exhibits2: Executive Summary - Data Table on Market Overview
- Exhibits3: Executive Summary - Chart on Global Market Characteristics
- Exhibits4: Executive Summary - Chart on Market By Geographical Landscape
- Exhibits5: Executive Summary - Chart on Market Segmentation by Product
- Exhibits6: Executive Summary - Chart on Market Segmentation by Component
- Exhibits7: Executive Summary - Chart on Incremental Growth
- Exhibits8: Executive Summary - Data Table on Incremental Growth
- Exhibits9: Executive Summary - Chart on Company Market Positioning
- Exhibits10: Parent Market
- Exhibits11: Data Table on - Parent Market
- Exhibits12: Market characteristics analysis
- Exhibits13: Value Chain Analysis
- Exhibits14: Offerings of companies included in the market definition
- Exhibits15: Market segments
- Exhibits16: Chart on Global - Market size and forecast 2023-2028 ($ million)
- Exhibits17: Data Table on Global - Market size and forecast 2023-2028 ($ million)
- Exhibits18: Chart on Global Market: Year-over-year growth 2023-2028 (%)
- Exhibits19: Data Table on Global Market: Year-over-year growth 2023-2028 (%)
- Exhibits20: Historic Market Size - Data Table on Global Milking Robot Market 2018 - 2022 ($ million)
- Exhibits21: Historic Market Size - Product Segment 2018 - 2022 ($ million)
- Exhibits22: Historic Market Size - Component Segment 2018 - 2022 ($ million)
- Exhibits23: Historic Market Size - Geography Segment 2018 - 2022 ($ million)
- Exhibits24: Historic Market Size - Country Segment 2018 - 2022 ($ million)
- Exhibits25: Five forces analysis - Comparison between 2023 and 2028
- Exhibits26: Bargaining power of buyers - Impact of key factors 2023 and 2028
- Exhibits27: Bargaining power of suppliers - Impact of key factors in 2023 and 2028
- Exhibits28: Threat of new entrants - Impact of key factors in 2023 and 2028
- Exhibits29: Threat of substitutes - Impact of key factors in 2023 and 2028
- Exhibits30: Threat of rivalry - Impact of key factors in 2023 and 2028
- Exhibits31: Chart on Market condition - Five forces 2023 and 2028
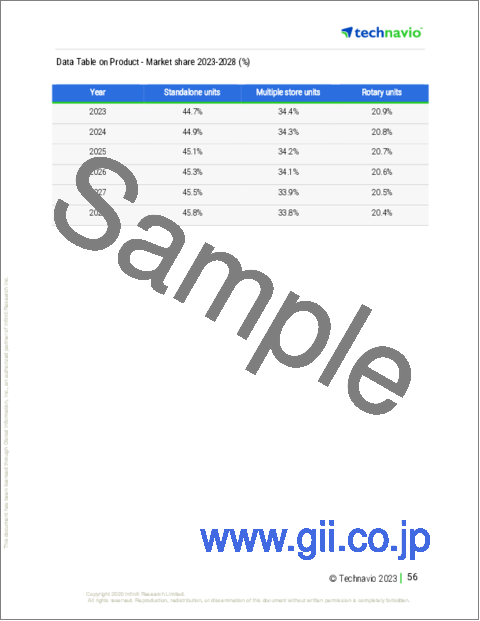
- Exhibits32: Chart on Product - Market share 2023-2028 (%)
- Exhibits33: Data Table on Product - Market share 2023-2028 (%)
- Exhibits34: Chart on Comparison by Product
- Exhibits35: Data Table on Comparison by Product
- Exhibits36: Chart on Standalone units - Market size and forecast 2023-2028 ($ million)
- Exhibits37: Data Table on Standalone units - Market size and forecast 2023-2028 ($ million)
- Exhibits38: Chart on Standalone units - Year-over-year growth 2023-2028 (%)
- Exhibits39: Data Table on Standalone units - Year-over-year growth 2023-2028 (%)
- Exhibits40: Chart on Multiple store units - Market size and forecast 2023-2028 ($ million)
- Exhibits41: Data Table on Multiple store units - Market size and forecast 2023-2028 ($ million)
- Exhibits42: Chart on Multiple store units - Year-over-year growth 2023-2028 (%)
- Exhibits43: Data Table on Multiple store units - Year-over-year growth 2023-2028 (%)
- Exhibits44: Chart on Rotary units - Market size and forecast 2023-2028 ($ million)
- Exhibits45: Data Table on Rotary units - Market size and forecast 2023-2028 ($ million)
- Exhibits46: Chart on Rotary units - Year-over-year growth 2023-2028 (%)
- Exhibits47: Data Table on Rotary units - Year-over-year growth 2023-2028 (%)
- Exhibits48: Market opportunity by Product ($ million)
- Exhibits49: Data Table on Market opportunity by Product ($ million)
- Exhibits50: Chart on Component - Market share 2023-2028 (%)
- Exhibits51: Data Table on Component - Market share 2023-2028 (%)
- Exhibits52: Chart on Comparison by Component
- Exhibits53: Data Table on Comparison by Component
- Exhibits54: Chart on Hardware - Market size and forecast 2023-2028 ($ million)
- Exhibits55: Data Table on Hardware - Market size and forecast 2023-2028 ($ million)
- Exhibits56: Chart on Hardware - Year-over-year growth 2023-2028 (%)
- Exhibits57: Data Table on Hardware - Year-over-year growth 2023-2028 (%)
- Exhibits58: Chart on Software - Market size and forecast 2023-2028 ($ million)
- Exhibits59: Data Table on Software - Market size and forecast 2023-2028 ($ million)
- Exhibits60: Chart on Software - Year-over-year growth 2023-2028 (%)
- Exhibits61: Data Table on Software - Year-over-year growth 2023-2028 (%)
- Exhibits62: Chart on Services - Market size and forecast 2023-2028 ($ million)
- Exhibits63: Data Table on Services - Market size and forecast 2023-2028 ($ million)
- Exhibits64: Chart on Services - Year-over-year growth 2023-2028 (%)
- Exhibits65: Data Table on Services - Year-over-year growth 2023-2028 (%)
- Exhibits66: Market opportunity by Component ($ million)
- Exhibits67: Data Table on Market opportunity by Component ($ million)
- Exhibits68: Analysis of price sensitivity, lifecycle, customer purchase basket, adoption rates, and purchase criteria
- Exhibits69: Chart on Market share By Geographical Landscape 2023-2028 (%)
- Exhibits70: Data Table on Market share By Geographical Landscape 2023-2028 (%)
- Exhibits71: Chart on Geographic comparison
- Exhibits72: Data Table on Geographic comparison
- Exhibits73: Chart on Europe - Market size and forecast 2023-2028 ($ million)
- Exhibits74: Data Table on Europe - Market size and forecast 2023-2028 ($ million)
- Exhibits75: Chart on Europe - Year-over-year growth 2023-2028 (%)
- Exhibits76: Data Table on Europe - Year-over-year growth 2023-2028 (%)
- Exhibits77: Chart on North America - Market size and forecast 2023-2028 ($ million)
- Exhibits78: Data Table on North America - Market size and forecast 2023-2028 ($ million)
- Exhibits79: Chart on North America - Year-over-year growth 2023-2028 (%)
- Exhibits80: Data Table on North America - Year-over-year growth 2023-2028 (%)
- Exhibits81: Chart on APAC - Market size and forecast 2023-2028 ($ million)
- Exhibits82: Data Table on APAC - Market size and forecast 2023-2028 ($ million)
- Exhibits83: Chart on APAC - Year-over-year growth 2023-2028 (%)
- Exhibits84: Data Table on APAC - Year-over-year growth 2023-2028 (%)
- Exhibits85: Chart on South America - Market size and forecast 2023-2028 ($ million)
- Exhibits86: Data Table on South America - Market size and forecast 2023-2028 ($ million)
- Exhibits87: Chart on South America - Year-over-year growth 2023-2028 (%)
- Exhibits88: Data Table on South America - Year-over-year growth 2023-2028 (%)
- Exhibits89: Chart on Middle East and Africa - Market size and forecast 2023-2028 ($ million)
- Exhibits90: Data Table on Middle East and Africa - Market size and forecast 2023-2028 ($ million)
- Exhibits91: Chart on Middle East and Africa - Year-over-year growth 2023-2028 (%)
- Exhibits92: Data Table on Middle East and Africa - Year-over-year growth 2023-2028 (%)
- Exhibits93: Chart on US - Market size and forecast 2023-2028 ($ million)
- Exhibits94: Data Table on US - Market size and forecast 2023-2028 ($ million)
- Exhibits95: Chart on US - Year-over-year growth 2023-2028 (%)
- Exhibits96: Data Table on US - Year-over-year growth 2023-2028 (%)
- Exhibits97: Chart on China - Market size and forecast 2023-2028 ($ million)
- Exhibits98: Data Table on China - Market size and forecast 2023-2028 ($ million)
- Exhibits99: Chart on China - Year-over-year growth 2023-2028 (%)
- Exhibits100: Data Table on China - Year-over-year growth 2023-2028 (%)
- Exhibits101: Chart on Germany - Market size and forecast 2023-2028 ($ million)
- Exhibits102: Data Table on Germany - Market size and forecast 2023-2028 ($ million)
- Exhibits103: Chart on Germany - Year-over-year growth 2023-2028 (%)
- Exhibits104: Data Table on Germany - Year-over-year growth 2023-2028 (%)
- Exhibits105: Chart on UK - Market size and forecast 2023-2028 ($ million)
- Exhibits106: Data Table on UK - Market size and forecast 2023-2028 ($ million)
- Exhibits107: Chart on UK - Year-over-year growth 2023-2028 (%)
- Exhibits108: Data Table on UK - Year-over-year growth 2023-2028 (%)
- Exhibits109: Chart on Canada - Market size and forecast 2023-2028 ($ million)
- Exhibits110: Data Table on Canada - Market size and forecast 2023-2028 ($ million)
- Exhibits111: Chart on Canada - Year-over-year growth 2023-2028 (%)
- Exhibits112: Data Table on Canada - Year-over-year growth 2023-2028 (%)
- Exhibits113: Market opportunity By Geographical Landscape ($ million)
- Exhibits114: Data Tables on Market opportunity By Geographical Landscape ($ million)
- Exhibits115: Impact of drivers and challenges in 2023 and 2028
- Exhibits116: Overview on criticality of inputs and factors of differentiation
- Exhibits117: Overview on factors of disruption
- Exhibits118: Impact of key risks on business
- Exhibits119: Companies covered
- Exhibits120: Matrix on companies position and classification
- Exhibits121: Afimilk Ltd. - Overview
- Exhibits122: Afimilk Ltd. - Product / Service
- Exhibits123: Afimilk Ltd. - Key offerings
- Exhibits124: Allflex Group - Overview
- Exhibits125: Allflex Group - Product / Service
- Exhibits126: Allflex Group - Key offerings
- Exhibits127: AMS Galaxy USA - Overview
- Exhibits128: AMS Galaxy USA - Product / Service
- Exhibits129: AMS Galaxy USA - Key offerings
- Exhibits130: Dairymaster - Overview
- Exhibits131: Dairymaster - Product / Service
- Exhibits132: Dairymaster - Key offerings
- Exhibits133: Fabdec Ltd. - Overview
- Exhibits134: Fabdec Ltd. - Product / Service
- Exhibits135: Fabdec Ltd. - Key offerings
- Exhibits136: Fullwood Ltd. - Overview
- Exhibits137: Fullwood Ltd. - Product / Service
- Exhibits138: Fullwood Ltd. - Key offerings
- Exhibits139: GEA Group AG - Overview
- Exhibits140: GEA Group AG - Business segments
- Exhibits141: GEA Group AG - Key news
- Exhibits142: GEA Group AG - Key offerings
- Exhibits143: GEA Group AG - Segment focus
- Exhibits144: Hokofarm Group - Overview
- Exhibits145: Hokofarm Group - Product / Service
- Exhibits146: Hokofarm Group - Key offerings
- Exhibits147: Lely International NV - Overview
- Exhibits148: Lely International NV - Product / Service
- Exhibits149: Lely International NV - Key offerings
- Exhibits150: Livestock Improvement Corp. Ltd. - Overview
- Exhibits151: Livestock Improvement Corp. Ltd. - Business segments
- Exhibits152: Livestock Improvement Corp. Ltd. - Key offerings
- Exhibits153: Livestock Improvement Corp. Ltd. - Segment focus
- Exhibits154: Madison One Holdings LLC - Overview
- Exhibits155: Madison One Holdings LLC - Product / Service
- Exhibits156: Madison One Holdings LLC - Key offerings
- Exhibits157: Milkplan SA - Overview
- Exhibits158: Milkplan SA - Product / Service
- Exhibits159: Milkplan SA - Key offerings
- Exhibits160: Milkwell Milking Systems - Overview
- Exhibits161: Milkwell Milking Systems - Product / Service
- Exhibits162: Milkwell Milking Systems - Key offerings
- Exhibits163: Read Industrial Ltd. - Overview
- Exhibits164: Read Industrial Ltd. - Product / Service
- Exhibits165: Read Industrial Ltd. - Key offerings
- Exhibits166: S.A. Christensen and Co. - Overview
- Exhibits167: S.A. Christensen and Co. - Product / Service
- Exhibits168: S.A. Christensen and Co. - Key offerings
- Exhibits169: Inclusions checklist
- Exhibits170: Exclusions checklist
- Exhibits171: Currency conversion rates for US$
- Exhibits172: Research methodology
- Exhibits173: Information sources
- Exhibits174: Data validation
- Exhibits175: Validation techniques employed for market sizing
- Exhibits176: Data synthesis
- Exhibits177: 360 degree market analysis
- Exhibits178: List of abbreviations
The milking robot market is forecasted to grow by USD 743.2 mn during 2023-2028, accelerating at a CAGR of 8.9% during the forecast period. The report on the milking robot market provides a holistic analysis, market size and forecast, trends, growth drivers, and challenges, as well as vendor analysis covering around 25 vendors.
The report offers an up-to-date analysis regarding the current market scenario, the latest trends and drivers, and the overall market environment. The market is driven by adoption of technologies to combat skill shortages, advantages over traditional milking process, and technological innovations in milking robot hardware and software.
Technavio's milking robot market is segmented as below:
| Market Scope | |
|---|---|
| Base Year | 2024 |
| End Year | 2028 |
| Series Year | 2024-2028 |
| Growth Momentum | Accelerate |
| YOY 2024 | 7.98% |
| CAGR | 8.9% |
| Incremental Value | $743.2mn |
By Product
- Standalone units
- Multiple store units
- Rotary units
By Component
- Hardware
- Software
- Services
By Geographical Landscape
- Europe
- North America
- APAC
- South America
- Middle East and Africa
This study identifies the improvement in sensors used in milking robot as one of the prime reasons driving the milking robot market growth during the next few years. Also, programs for refurbished robots and adoption of software and mobile apps to enhance analytics in milk production will lead to sizable demand in the market.
The report on the milking robot market covers the following areas:
- Milking robot market sizing
- Milking robot market forecast
- Milking robot market industry analysis
The robust vendor analysis is designed to help clients improve their market position, and in line with this, this report provides a detailed analysis of several leading milking robot market vendors that include Afimilk Ltd., Allflex Group, AMS Galaxy USA, Dairymaster, Fabdec Ltd., Fullwood Ltd., GEA Group AG, Hokofarm Group, Lely International NV, Livestock Improvement Corp. Ltd., Madison One Holdings LLC, Milkplan SA, Milkwell Milking Systems, Read Industrial Ltd., S.A. Christensen and Co., System Happel GmbH, Tetra Laval SA, and Waikato Milking Systems LP. Also, the milking robot market analysis report includes information on upcoming trends and challenges that will influence market growth. This is to help companies strategize and leverage all forthcoming growth opportunities.
The study was conducted using an objective combination of primary and secondary information including inputs from key participants in the industry. The report contains a comprehensive market and vendor landscape in addition to an analysis of the key vendors.
The publisher presents a detailed picture of the market by the way of study, synthesis, and summation of data from multiple sources by an analysis of key parameters such as profit, pricing, competition, and promotions. It presents various market facets by identifying the key industry influencers. The data presented is comprehensive, reliable, and a result of extensive research - both primary and secondary. The market research reports provide a complete competitive landscape and an in-depth vendor selection methodology and analysis using qualitative and quantitative research to forecast the accurate market growth.
Table of Contents
1 Executive Summary
- 1.1 Market overview
- Executive Summary - Chart on Market Overview
- Executive Summary - Data Table on Market Overview
- Executive Summary - Chart on Global Market Characteristics
- Executive Summary - Chart on Market By Geographical Landscape
- Executive Summary - Chart on Market Segmentation by Product
- Executive Summary - Chart on Market Segmentation by Component
- Executive Summary - Chart on Incremental Growth
- Executive Summary - Data Table on Incremental Growth
- Executive Summary - Chart on Company Market Positioning
2 Market Landscape
- 2.1 Market ecosystem
- Parent Market
- Data Table on - Parent Market
- 2.2 Market characteristics
- Market characteristics analysis
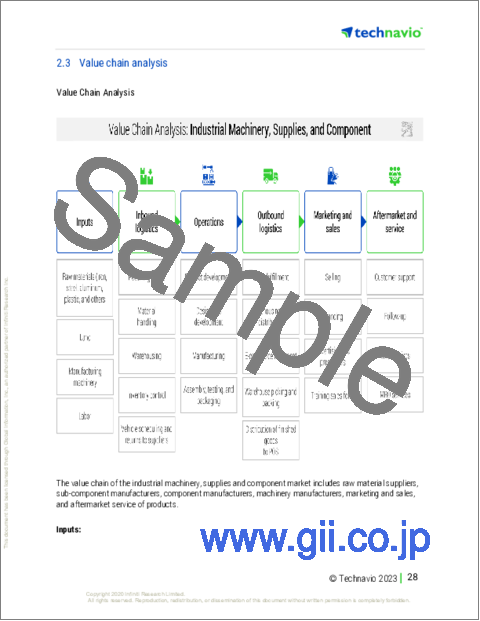
- 2.3 Value chain analysis
- Value Chain Analysis
3 Market Sizing
- 3.1 Market definition
- Offerings of companies included in the market definition
- 3.2 Market segment analysis
- Market segments
- 3.3 Market size 2023
- 3.4 Market outlook: Forecast for 2023-2028
- Chart on Global - Market size and forecast 2023-2028 ($ million)
- Data Table on Global - Market size and forecast 2023-2028 ($ million)
- Chart on Global Market: Year-over-year growth 2023-2028 (%)
- Data Table on Global Market: Year-over-year growth 2023-2028 (%)
4 Historic Market Size
- 4.1 Global Milking Robot Market 2018 - 2022
- Historic Market Size - Data Table on Global Milking Robot Market 2018 - 2022 ($ million)
- 4.2 Product segment analysis 2018 - 2022
- Historic Market Size - Product Segment 2018 - 2022 ($ million)
- 4.3 Component segment analysis 2018 - 2022
- Historic Market Size - Component Segment 2018 - 2022 ($ million)
- 4.4 Geography segment analysis 2018 - 2022
- Historic Market Size - Geography Segment 2018 - 2022 ($ million)
- 4.5 Country segment analysis 2018 - 2022
- Historic Market Size - Country Segment 2018 - 2022 ($ million)
5 Five Forces Analysis
- 5.1 Five forces summary
- Five forces analysis - Comparison between 2023 and 2028
- 5.2 Bargaining power of buyers
- Bargaining power of buyers - Impact of key factors 2023 and 2028
- 5.3 Bargaining power of suppliers
- Bargaining power of suppliers - Impact of key factors in 2023 and 2028
- 5.4 Threat of new entrants
- Threat of new entrants - Impact of key factors in 2023 and 2028
- 5.5 Threat of substitutes
- Threat of substitutes - Impact of key factors in 2023 and 2028
- 5.6 Threat of rivalry
- Threat of rivalry - Impact of key factors in 2023 and 2028
- 5.7 Market condition
- Chart on Market condition - Five forces 2023 and 2028
6 Market Segmentation by Product
- 6.1 Market segments
- Chart on Product - Market share 2023-2028 (%)
- Data Table on Product - Market share 2023-2028 (%)
- 6.2 Comparison by Product
- Chart on Comparison by Product
- Data Table on Comparison by Product
- 6.3 Standalone units - Market size and forecast 2023-2028
- Chart on Standalone units - Market size and forecast 2023-2028 ($ million)
- Data Table on Standalone units - Market size and forecast 2023-2028 ($ million)
- Chart on Standalone units - Year-over-year growth 2023-2028 (%)
- Data Table on Standalone units - Year-over-year growth 2023-2028 (%)
- 6.4 Multiple store units - Market size and forecast 2023-2028
- Chart on Multiple store units - Market size and forecast 2023-2028 ($ million)
- Data Table on Multiple store units - Market size and forecast 2023-2028 ($ million)
- Chart on Multiple store units - Year-over-year growth 2023-2028 (%)
- Data Table on Multiple store units - Year-over-year growth 2023-2028 (%)
- 6.5 Rotary units - Market size and forecast 2023-2028
- Chart on Rotary units - Market size and forecast 2023-2028 ($ million)
- Data Table on Rotary units - Market size and forecast 2023-2028 ($ million)
- Chart on Rotary units - Year-over-year growth 2023-2028 (%)
- Data Table on Rotary units - Year-over-year growth 2023-2028 (%)
- 6.6 Market opportunity by Product
- Market opportunity by Product ($ million)
- Data Table on Market opportunity by Product ($ million)
7 Market Segmentation by Component
- 7.1 Market segments
- Chart on Component - Market share 2023-2028 (%)
- Data Table on Component - Market share 2023-2028 (%)
- 7.2 Comparison by Component
- Chart on Comparison by Component
- Data Table on Comparison by Component
- 7.3 Hardware - Market size and forecast 2023-2028
- Chart on Hardware - Market size and forecast 2023-2028 ($ million)
- Data Table on Hardware - Market size and forecast 2023-2028 ($ million)
- Chart on Hardware - Year-over-year growth 2023-2028 (%)
- Data Table on Hardware - Year-over-year growth 2023-2028 (%)
- 7.4 Software - Market size and forecast 2023-2028
- Chart on Software - Market size and forecast 2023-2028 ($ million)
- Data Table on Software - Market size and forecast 2023-2028 ($ million)
- Chart on Software - Year-over-year growth 2023-2028 (%)
- Data Table on Software - Year-over-year growth 2023-2028 (%)
- 7.5 Services - Market size and forecast 2023-2028
- Chart on Services - Market size and forecast 2023-2028 ($ million)
- Data Table on Services - Market size and forecast 2023-2028 ($ million)
- Chart on Services - Year-over-year growth 2023-2028 (%)
- Data Table on Services - Year-over-year growth 2023-2028 (%)
- 7.6 Market opportunity by Component
- Market opportunity by Component ($ million)
- Data Table on Market opportunity by Component ($ million)
8 Customer Landscape
- 8.1 Customer landscape overview
- Analysis of price sensitivity, lifecycle, customer purchase basket, adoption rates, and purchase criteria
9 Geographic Landscape
- 9.1 Geographic segmentation
- Chart on Market share By Geographical Landscape 2023-2028 (%)
- Data Table on Market share By Geographical Landscape 2023-2028 (%)
- 9.2 Geographic comparison
- Chart on Geographic comparison
- Data Table on Geographic comparison
- 9.3 Europe - Market size and forecast 2023-2028
- Chart on Europe - Market size and forecast 2023-2028 ($ million)
- Data Table on Europe - Market size and forecast 2023-2028 ($ million)
- Chart on Europe - Year-over-year growth 2023-2028 (%)
- Data Table on Europe - Year-over-year growth 2023-2028 (%)
- 9.4 North America - Market size and forecast 2023-2028
- Chart on North America - Market size and forecast 2023-2028 ($ million)
- Data Table on North America - Market size and forecast 2023-2028 ($ million)
- Chart on North America - Year-over-year growth 2023-2028 (%)
- Data Table on North America - Year-over-year growth 2023-2028 (%)
- 9.5 APAC - Market size and forecast 2023-2028
- Chart on APAC - Market size and forecast 2023-2028 ($ million)
- Data Table on APAC - Market size and forecast 2023-2028 ($ million)
- Chart on APAC - Year-over-year growth 2023-2028 (%)
- Data Table on APAC - Year-over-year growth 2023-2028 (%)
- 9.6 South America - Market size and forecast 2023-2028
- Chart on South America - Market size and forecast 2023-2028 ($ million)
- Data Table on South America - Market size and forecast 2023-2028 ($ million)
- Chart on South America - Year-over-year growth 2023-2028 (%)
- Data Table on South America - Year-over-year growth 2023-2028 (%)
- 9.7 Middle East and Africa - Market size and forecast 2023-2028
- Chart on Middle East and Africa - Market size and forecast 2023-2028 ($ million)
- Data Table on Middle East and Africa - Market size and forecast 2023-2028 ($ million)
- Chart on Middle East and Africa - Year-over-year growth 2023-2028 (%)
- Data Table on Middle East and Africa - Year-over-year growth 2023-2028 (%)
- 9.8 US - Market size and forecast 2023-2028
- Chart on US - Market size and forecast 2023-2028 ($ million)
- Data Table on US - Market size and forecast 2023-2028 ($ million)
- Chart on US - Year-over-year growth 2023-2028 (%)
- Data Table on US - Year-over-year growth 2023-2028 (%)
- 9.9 China - Market size and forecast 2023-2028
- Chart on China - Market size and forecast 2023-2028 ($ million)
- Data Table on China - Market size and forecast 2023-2028 ($ million)
- Chart on China - Year-over-year growth 2023-2028 (%)
- Data Table on China - Year-over-year growth 2023-2028 (%)
- 9.10 Germany - Market size and forecast 2023-2028
- Chart on Germany - Market size and forecast 2023-2028 ($ million)
- Data Table on Germany - Market size and forecast 2023-2028 ($ million)
- Chart on Germany - Year-over-year growth 2023-2028 (%)
- Data Table on Germany - Year-over-year growth 2023-2028 (%)
- 9.11 UK - Market size and forecast 2023-2028
- Chart on UK - Market size and forecast 2023-2028 ($ million)
- Data Table on UK - Market size and forecast 2023-2028 ($ million)
- Chart on UK - Year-over-year growth 2023-2028 (%)
- Data Table on UK - Year-over-year growth 2023-2028 (%)
- 9.12 Canada - Market size and forecast 2023-2028
- Chart on Canada - Market size and forecast 2023-2028 ($ million)
- Data Table on Canada - Market size and forecast 2023-2028 ($ million)
- Chart on Canada - Year-over-year growth 2023-2028 (%)
- Data Table on Canada - Year-over-year growth 2023-2028 (%)
- 9.13 Market opportunity By Geographical Landscape
- Market opportunity By Geographical Landscape ($ million)
- Data Tables on Market opportunity By Geographical Landscape ($ million)
10 Drivers, Challenges, and Opportunity/Restraints
- 10.1 Market drivers
- 10.2 Market challenges
- 10.3 Impact of drivers and challenges
- Impact of drivers and challenges in 2023 and 2028
- 10.4 Market opportunities/restraints
11 Competitive Landscape
- 11.1 Overview
- 11.2 Competitive Landscape
- Overview on criticality of inputs and factors of differentiation
- 11.3 Landscape disruption
- Overview on factors of disruption
- 11.4 Industry risks
- Impact of key risks on business
12 Competitive Analysis
- 12.1 Companies profiled
- Companies covered
- 12.2 Market positioning of companies
- Matrix on companies position and classification
- 12.3 Afimilk Ltd.
- Afimilk Ltd. - Overview
- Afimilk Ltd. - Product / Service
- Afimilk Ltd. - Key offerings
- 12.4 Allflex Group
- Allflex Group - Overview
- Allflex Group - Product / Service
- Allflex Group - Key offerings
- 12.5 AMS Galaxy USA
- AMS Galaxy USA - Overview
- AMS Galaxy USA - Product / Service
- AMS Galaxy USA - Key offerings
- 12.6 Dairymaster
- Dairymaster - Overview
- Dairymaster - Product / Service
- Dairymaster - Key offerings
- 12.7 Fabdec Ltd.
- Fabdec Ltd. - Overview
- Fabdec Ltd. - Product / Service
- Fabdec Ltd. - Key offerings
- 12.8 Fullwood Ltd.
- Fullwood Ltd. - Overview
- Fullwood Ltd. - Product / Service
- Fullwood Ltd. - Key offerings
- 12.9 GEA Group AG
- GEA Group AG - Overview
- GEA Group AG - Business segments
- GEA Group AG - Key news
- GEA Group AG - Key offerings
- GEA Group AG - Segment focus
- 12.10 Hokofarm Group
- Hokofarm Group - Overview
- Hokofarm Group - Product / Service
- Hokofarm Group - Key offerings
- 12.11 Lely International NV
- Lely International NV - Overview
- Lely International NV - Product / Service
- Lely International NV - Key offerings
- 12.12 Livestock Improvement Corp. Ltd.
- Livestock Improvement Corp. Ltd. - Overview
- Livestock Improvement Corp. Ltd. - Business segments
- Livestock Improvement Corp. Ltd. - Key offerings
- Livestock Improvement Corp. Ltd. - Segment focus
- 12.13 Madison One Holdings LLC
- Madison One Holdings LLC - Overview
- Madison One Holdings LLC - Product / Service
- Madison One Holdings LLC - Key offerings
- 12.14 Milkplan SA
- Milkplan SA - Overview
- Milkplan SA - Product / Service
- Milkplan SA - Key offerings
- 12.15 Milkwell Milking Systems
- Milkwell Milking Systems - Overview
- Milkwell Milking Systems - Product / Service
- Milkwell Milking Systems - Key offerings
- 12.16 Read Industrial Ltd.
- Read Industrial Ltd. - Overview
- Read Industrial Ltd. - Product / Service
- Read Industrial Ltd. - Key offerings
- 12.17 S.A. Christensen and Co.
- S.A. Christensen and Co. - Overview
- S.A. Christensen and Co. - Product / Service
- S.A. Christensen and Co. - Key offerings
13 Appendix
- 13.1 Scope of the report
- 13.2 Inclusions and exclusions checklist
- Inclusions checklist
- Exclusions checklist
- 13.3 Currency conversion rates for US$
- Currency conversion rates for US$
- 13.4 Research methodology
- Research methodology
- 13.5 Data procurement
- Information sources
- 13.6 Data validation
- Data validation
- 13.7 Validation techniques employed for market sizing
- Validation techniques employed for market sizing
- 13.8 Data synthesis
- Data synthesis
- 360 degree market analysis
- 360 degree market analysis
- 13.10 List of abbreviations
- List of abbreviations
