|
|
市場調査レポート
商品コード
1697281
コードレス電動工具の世界市場 2025~2029年Global Cordless Power Tools Market 2025-2029 |
||||||

|
|||||||
カスタマイズ可能
|
|||||||


| コードレス電動工具の世界市場 2025~2029年 |
|
出版日: 2025年03月28日
発行: TechNavio
ページ情報: 英文 246 Pages
納期: 即納可能
|

全表示
- 概要
- 図表
- 目次
コードレス電動工具市場は2024-2029年に40億1,400万米ドル、予測期間中のCAGRは3.9%で成長すると予測されます。
当レポートでは、コードレス電動工具市場の全体的な分析、市場規模・予測、動向、成長促進要因、課題、約25のベンダーを網羅したベンダー分析などを掲載しています。
現在の市場シナリオ、最新動向と促進要因、市場環境全体に関する最新分析を提供しています。市場を牽引するのは、バッテリー技術の進歩、軽自動車生産の拡大、新興諸国におけるDIYコンセプトの勢いです。
| 市場範囲 | |
|---|---|
| 基準年 | 2025 |
| 終了年 | 2029 |
| 予測期間 | 2025-2029 |
| 成長モメンタム | 加速 |
| 前年比2025年 | 3.7% |
| CAGR | 3.9% |
| 増分額 | 40億1,400万米ドル |
本調査は、業界の主要参加者からのインプットを含め、一次情報と二次情報を客観的に組み合わせて実施しました。レポートには、主要企業の分析に加え、包括的な市場規模データ、地域別分析によるセグメント、ベンダー情勢が含まれています。レポートには過去データと予測データを掲載しています。
本調査では、今後数年間のコードレス電動工具市場の成長を促進する主な要因の一つとして、EV販売の増加を挙げています。また、3次元(3D)印刷技術の統合や、鉄道・航空宇宙分野への投資の拡大も、市場の大きな需要につながると思われます。
目次
第1章 エグゼクティブサマリー
- 市場概要
第2章 Technavio分析
- 価格・ライフサイクル・顧客購入バスケット・採用率・購入基準の分析
- インプットの重要性と差別化の要因
- 混乱の要因
- 促進要因と課題の影響
第3章 市場情勢
- 市場エコシステム
- 市場の特徴
- バリューチェーン分析
第4章 市場規模
- 市場の定義
- 市場セグメント分析
- 市場規模 2024
- 市場の見通し 2024-2029
第5章 市場規模実績
- コードレス電動工具の世界市場 2019-2023
- エンドユーザー別セグメント分析 2019-2023
- タイプ別セグメント分析 2019-2023
- 流通チャネル別セグメント分析 2019-2023
- 製品タイプ別セグメント分析 2019-2023
- 地域別セグメント分析 2019-2023
- 国別セグメント分析 2019-2023
第6章 定性分析
- AIの影響:コードレス電動工具の世界市場
第7章 ファイブフォース分析
- ファイブフォースの要約
- 買い手の交渉力
- 供給企業の交渉力
- 新規参入業者の脅威
- 代替品の脅威
- 競争の脅威
- 市況
第8章 市場セグメンテーション:エンドユーザー別
- 市場セグメント
- 比較:エンドユーザー別
- 専門職:市場規模と予測 2024-2029
- 消費者:市場規模と予測 2024-2029
- 市場機会:エンドユーザー別
第9章 市場セグメンテーション:タイプ別
- 市場セグメント
- 比較:タイプ別
- ブラシ付きモーター:市場規模と予測 2024-2029
- ブラシレスモーター:市場規模と予測 2024-2029
- 市場機会:タイプ別
第10章 市場セグメンテーション:流通チャネル別
- 市場セグメント
- 比較:流通チャネル別
- オフライン:市場規模と予測 2024-2029
- オンライン:市場規模と予測 2024-2029
- 市場機会:流通チャネル別
第11章 市場セグメンテーション:製品タイプ別
- 市場セグメント
- 比較:製品タイプ別
- 掘削および締結工具:市場規模と予測 2024-2029
- 鋸および切断工具:市場規模と予測 2024-2029
- 素材除去ツール:市場規模と予測 2024-2029
- 園芸用具:市場規模と予測 2024-2029
- その他:市場規模と予測 2024-2029
- 市場機会:製品タイプ別
第12章 顧客情勢
- 顧客情勢の概要
第13章 地域別情勢
- 地域別セグメンテーション
- 地域別比較
- 北米:市場規模と予測 2024-2029
- 欧州:市場規模と予測 2024-2029
- アジア太平洋:市場規模と予測 2024-2029
- 南米:市場規模と予測 2024-2029
- 中東・アフリカ:市場規模と予測 2024-2029
- 米国:市場規模と予測 2024-2029
- 中国:市場規模と予測 2024-2029
- カナダ:市場規模と予測 2024-2029
- ドイツ:市場規模と予測 2024-2029
- 英国:市場規模と予測 2024-2029
- インド:市場規模と予測 2024-2029
- フランス:市場規模と予測 2024-2029
- 日本:市場規模と予測 2024-2029
- ブラジル:市場規模と予測 2024-2029
- イタリア:市場規模と予測 2024-2029
- 市場機会:地域情勢別
第14章 促進要因・課題・機会・抑制要因
- 市場促進要因
- 市場の課題
- 促進要因と課題の影響
- 市場の機会・抑制要因
第15章 競合情勢
- 概要
- 競合情勢
- 混乱の状況
- 業界のリスク
第16章 競合分析
- 企業プロファイル
- 企業ランキング指数
- 企業の市場ポジショニング
- ANDREAS STIHL AG and Co. KG
- Atlas Copco AB
- Emak Spa
- Ferm International BV
- Hilti AG
- Hitachi Ltd.
- Husqvarna AB
- Makita Corp.
- Panasonic Holdings Corp.
- Robert Bosch GmbH
- Snap On Inc.
- Stanley Black and Decker Inc.
- Stanley Electric Co. Ltd.
- Techtronic Industries Co. Ltd.
- The Toro Co.
第17章 付録
Exhibits:
- Exhibits1: Executive Summary - Chart on Market Overview
- Exhibits2: Executive Summary - Data Table on Market Overview
- Exhibits3: Executive Summary - Chart on Global Market Characteristics
- Exhibits4: Executive Summary - Chart on Market By Geographical Landscape
- Exhibits5: Executive Summary - Chart on Market Segmentation by End-user
- Exhibits6: Executive Summary - Chart on Market Segmentation by Type
- Exhibits7: Executive Summary - Chart on Market Segmentation by Distribution Channel
- Exhibits8: Executive Summary - Chart on Market Segmentation by Product Type
- Exhibits9: Executive Summary - Chart on Incremental Growth
- Exhibits10: Executive Summary - Data Table on Incremental Growth
- Exhibits11: Executive Summary - Chart on Company Market Positioning
- Exhibits12: Analysis of price sensitivity, lifecycle, customer purchase basket, adoption rates, and purchase criteria
- Exhibits13: Overview on criticality of inputs and factors of differentiation
- Exhibits14: Overview on factors of disruption
- Exhibits15: Impact of drivers and challenges in 2024 and 2029
- Exhibits16: Parent Market
- Exhibits17: Data Table on - Parent Market
- Exhibits18: Market characteristics analysis
- Exhibits19: Value chain analysis
- Exhibits20: Offerings of companies included in the market definition
- Exhibits21: Market segments
- Exhibits22: Chart on Global - Market size and forecast 2024-2029 ($ million)
- Exhibits23: Data Table on Global - Market size and forecast 2024-2029 ($ million)
- Exhibits24: Chart on Global Market: Year-over-year growth 2024-2029 (%)
- Exhibits25: Data Table on Global Market: Year-over-year growth 2024-2029 (%)
- Exhibits26: Historic Market Size - Data Table on Global Cordless Power Tools Market 2019 - 2023 ($ million)
- Exhibits27: Historic Market Size - End-user Segment 2019 - 2023 ($ million)
- Exhibits28: Historic Market Size - Type Segment 2019 - 2023 ($ million)
- Exhibits29: Historic Market Size - Distribution Channel Segment 2019 - 2023 ($ million)
- Exhibits30: Historic Market Size - Product Type Segment 2019 - 2023 ($ million)
- Exhibits31: Historic Market Size - Geography Segment 2019 - 2023 ($ million)
- Exhibits32: Historic Market Size - Country Segment 2019 - 2023 ($ million)
- Exhibits33: Five forces analysis - Comparison between 2024 and 2029
- Exhibits34: Bargaining power of buyers - Impact of key factors 2024 and 2029
- Exhibits35: Bargaining power of suppliers - Impact of key factors in 2024 and 2029
- Exhibits36: Threat of new entrants - Impact of key factors in 2024 and 2029
- Exhibits37: Threat of substitutes - Impact of key factors in 2024 and 2029
- Exhibits38: Threat of rivalry - Impact of key factors in 2024 and 2029
- Exhibits39: Chart on Market condition - Five forces 2024 and 2029
- Exhibits40: Chart on End-user - Market share 2024-2029 (%)
- Exhibits41: Data Table on End-user - Market share 2024-2029 (%)
- Exhibits42: Chart on Comparison by End-user
- Exhibits43: Data Table on Comparison by End-user
- Exhibits44: Chart on Professional - Market size and forecast 2024-2029 ($ million)
- Exhibits45: Data Table on Professional - Market size and forecast 2024-2029 ($ million)
- Exhibits46: Chart on Professional - Year-over-year growth 2024-2029 (%)
- Exhibits47: Data Table on Professional - Year-over-year growth 2024-2029 (%)
- Exhibits48: Chart on Consumer - Market size and forecast 2024-2029 ($ million)
- Exhibits49: Data Table on Consumer - Market size and forecast 2024-2029 ($ million)
- Exhibits50: Chart on Consumer - Year-over-year growth 2024-2029 (%)
- Exhibits51: Data Table on Consumer - Year-over-year growth 2024-2029 (%)
- Exhibits52: Market opportunity by End-user ($ million)
- Exhibits53: Data Table on Market opportunity by End-user ($ million)
- Exhibits54: Chart on Type - Market share 2024-2029 (%)
- Exhibits55: Data Table on Type - Market share 2024-2029 (%)
- Exhibits56: Chart on Comparison by Type
- Exhibits57: Data Table on Comparison by Type
- Exhibits58: Chart on Brushed motors - Market size and forecast 2024-2029 ($ million)
- Exhibits59: Data Table on Brushed motors - Market size and forecast 2024-2029 ($ million)
- Exhibits60: Chart on Brushed motors - Year-over-year growth 2024-2029 (%)
- Exhibits61: Data Table on Brushed motors - Year-over-year growth 2024-2029 (%)
- Exhibits62: Chart on Brushless motors - Market size and forecast 2024-2029 ($ million)
- Exhibits63: Data Table on Brushless motors - Market size and forecast 2024-2029 ($ million)
- Exhibits64: Chart on Brushless motors - Year-over-year growth 2024-2029 (%)
- Exhibits65: Data Table on Brushless motors - Year-over-year growth 2024-2029 (%)
- Exhibits66: Market opportunity by Type ($ million)
- Exhibits67: Data Table on Market opportunity by Type ($ million)
- Exhibits68: Chart on Distribution Channel - Market share 2024-2029 (%)
- Exhibits69: Data Table on Distribution Channel - Market share 2024-2029 (%)
- Exhibits70: Chart on Comparison by Distribution Channel
- Exhibits71: Data Table on Comparison by Distribution Channel
- Exhibits72: Chart on Offline - Market size and forecast 2024-2029 ($ million)
- Exhibits73: Data Table on Offline - Market size and forecast 2024-2029 ($ million)
- Exhibits74: Chart on Offline - Year-over-year growth 2024-2029 (%)
- Exhibits75: Data Table on Offline - Year-over-year growth 2024-2029 (%)
- Exhibits76: Chart on Online - Market size and forecast 2024-2029 ($ million)
- Exhibits77: Data Table on Online - Market size and forecast 2024-2029 ($ million)
- Exhibits78: Chart on Online - Year-over-year growth 2024-2029 (%)
- Exhibits79: Data Table on Online - Year-over-year growth 2024-2029 (%)
- Exhibits80: Market opportunity by Distribution Channel ($ million)
- Exhibits81: Data Table on Market opportunity by Distribution Channel ($ million)
- Exhibits82: Chart on Product Type - Market share 2024-2029 (%)
- Exhibits83: Data Table on Product Type - Market share 2024-2029 (%)
- Exhibits84: Chart on Comparison by Product Type
- Exhibits85: Data Table on Comparison by Product Type
- Exhibits86: Chart on Drilling and fastening tools - Market size and forecast 2024-2029 ($ million)
- Exhibits87: Data Table on Drilling and fastening tools - Market size and forecast 2024-2029 ($ million)
- Exhibits88: Chart on Drilling and fastening tools - Year-over-year growth 2024-2029 (%)
- Exhibits89: Data Table on Drilling and fastening tools - Year-over-year growth 2024-2029 (%)
- Exhibits90: Chart on Sawing and cutting tools - Market size and forecast 2024-2029 ($ million)
- Exhibits91: Data Table on Sawing and cutting tools - Market size and forecast 2024-2029 ($ million)
- Exhibits92: Chart on Sawing and cutting tools - Year-over-year growth 2024-2029 (%)
- Exhibits93: Data Table on Sawing and cutting tools - Year-over-year growth 2024-2029 (%)
- Exhibits94: Chart on Material removal tools - Market size and forecast 2024-2029 ($ million)
- Exhibits95: Data Table on Material removal tools - Market size and forecast 2024-2029 ($ million)
- Exhibits96: Chart on Material removal tools - Year-over-year growth 2024-2029 (%)
- Exhibits97: Data Table on Material removal tools - Year-over-year growth 2024-2029 (%)
- Exhibits98: Chart on Garden tools - Market size and forecast 2024-2029 ($ million)
- Exhibits99: Data Table on Garden tools - Market size and forecast 2024-2029 ($ million)
- Exhibits100: Chart on Garden tools - Year-over-year growth 2024-2029 (%)
- Exhibits101: Data Table on Garden tools - Year-over-year growth 2024-2029 (%)
- Exhibits102: Chart on Others - Market size and forecast 2024-2029 ($ million)
- Exhibits103: Data Table on Others - Market size and forecast 2024-2029 ($ million)
- Exhibits104: Chart on Others - Year-over-year growth 2024-2029 (%)
- Exhibits105: Data Table on Others - Year-over-year growth 2024-2029 (%)
- Exhibits106: Market opportunity by Product Type ($ million)
- Exhibits107: Data Table on Market opportunity by Product Type ($ million)
- Exhibits108: Analysis of price sensitivity, lifecycle, customer purchase basket, adoption rates, and purchase criteria
- Exhibits109: Chart on Market share By Geographical Landscape 2024-2029 (%)
- Exhibits110: Data Table on Market share By Geographical Landscape 2024-2029 (%)
- Exhibits111: Chart on Geographic comparison
- Exhibits112: Data Table on Geographic comparison
- Exhibits113: Chart on North America - Market size and forecast 2024-2029 ($ million)
- Exhibits114: Data Table on North America - Market size and forecast 2024-2029 ($ million)
- Exhibits115: Chart on North America - Year-over-year growth 2024-2029 (%)
- Exhibits116: Data Table on North America - Year-over-year growth 2024-2029 (%)
- Exhibits117: Chart on Europe - Market size and forecast 2024-2029 ($ million)
- Exhibits118: Data Table on Europe - Market size and forecast 2024-2029 ($ million)
- Exhibits119: Chart on Europe - Year-over-year growth 2024-2029 (%)
- Exhibits120: Data Table on Europe - Year-over-year growth 2024-2029 (%)
- Exhibits121: Chart on APAC - Market size and forecast 2024-2029 ($ million)
- Exhibits122: Data Table on APAC - Market size and forecast 2024-2029 ($ million)
- Exhibits123: Chart on APAC - Year-over-year growth 2024-2029 (%)
- Exhibits124: Data Table on APAC - Year-over-year growth 2024-2029 (%)
- Exhibits125: Chart on South America - Market size and forecast 2024-2029 ($ million)
- Exhibits126: Data Table on South America - Market size and forecast 2024-2029 ($ million)
- Exhibits127: Chart on South America - Year-over-year growth 2024-2029 (%)
- Exhibits128: Data Table on South America - Year-over-year growth 2024-2029 (%)
- Exhibits129: Chart on Middle East and Africa - Market size and forecast 2024-2029 ($ million)
- Exhibits130: Data Table on Middle East and Africa - Market size and forecast 2024-2029 ($ million)
- Exhibits131: Chart on Middle East and Africa - Year-over-year growth 2024-2029 (%)
- Exhibits132: Data Table on Middle East and Africa - Year-over-year growth 2024-2029 (%)
- Exhibits133: Chart on US - Market size and forecast 2024-2029 ($ million)
- Exhibits134: Data Table on US - Market size and forecast 2024-2029 ($ million)
- Exhibits135: Chart on US - Year-over-year growth 2024-2029 (%)
- Exhibits136: Data Table on US - Year-over-year growth 2024-2029 (%)
- Exhibits137: Chart on China - Market size and forecast 2024-2029 ($ million)
- Exhibits138: Data Table on China - Market size and forecast 2024-2029 ($ million)
- Exhibits139: Chart on China - Year-over-year growth 2024-2029 (%)
- Exhibits140: Data Table on China - Year-over-year growth 2024-2029 (%)
- Exhibits141: Chart on Canada - Market size and forecast 2024-2029 ($ million)
- Exhibits142: Data Table on Canada - Market size and forecast 2024-2029 ($ million)
- Exhibits143: Chart on Canada - Year-over-year growth 2024-2029 (%)
- Exhibits144: Data Table on Canada - Year-over-year growth 2024-2029 (%)
- Exhibits145: Chart on Germany - Market size and forecast 2024-2029 ($ million)
- Exhibits146: Data Table on Germany - Market size and forecast 2024-2029 ($ million)
- Exhibits147: Chart on Germany - Year-over-year growth 2024-2029 (%)
- Exhibits148: Data Table on Germany - Year-over-year growth 2024-2029 (%)
- Exhibits149: Chart on UK - Market size and forecast 2024-2029 ($ million)
- Exhibits150: Data Table on UK - Market size and forecast 2024-2029 ($ million)
- Exhibits151: Chart on UK - Year-over-year growth 2024-2029 (%)
- Exhibits152: Data Table on UK - Year-over-year growth 2024-2029 (%)
- Exhibits153: Chart on India - Market size and forecast 2024-2029 ($ million)
- Exhibits154: Data Table on India - Market size and forecast 2024-2029 ($ million)
- Exhibits155: Chart on India - Year-over-year growth 2024-2029 (%)
- Exhibits156: Data Table on India - Year-over-year growth 2024-2029 (%)
- Exhibits157: Chart on France - Market size and forecast 2024-2029 ($ million)
- Exhibits158: Data Table on France - Market size and forecast 2024-2029 ($ million)
- Exhibits159: Chart on France - Year-over-year growth 2024-2029 (%)
- Exhibits160: Data Table on France - Year-over-year growth 2024-2029 (%)
- Exhibits161: Chart on Japan - Market size and forecast 2024-2029 ($ million)
- Exhibits162: Data Table on Japan - Market size and forecast 2024-2029 ($ million)
- Exhibits163: Chart on Japan - Year-over-year growth 2024-2029 (%)
- Exhibits164: Data Table on Japan - Year-over-year growth 2024-2029 (%)
- Exhibits165: Chart on Brazil - Market size and forecast 2024-2029 ($ million)
- Exhibits166: Data Table on Brazil - Market size and forecast 2024-2029 ($ million)
- Exhibits167: Chart on Brazil - Year-over-year growth 2024-2029 (%)
- Exhibits168: Data Table on Brazil - Year-over-year growth 2024-2029 (%)
- Exhibits169: Chart on Italy - Market size and forecast 2024-2029 ($ million)
- Exhibits170: Data Table on Italy - Market size and forecast 2024-2029 ($ million)
- Exhibits171: Chart on Italy - Year-over-year growth 2024-2029 (%)
- Exhibits172: Data Table on Italy - Year-over-year growth 2024-2029 (%)
- Exhibits173: Market opportunity By Geographical Landscape ($ million)
- Exhibits174: Data Tables on Market opportunity By Geographical Landscape ($ million)
- Exhibits175: Impact of drivers and challenges in 2024 and 2029
- Exhibits176: Overview on criticality of inputs and factors of differentiation
- Exhibits177: Overview on factors of disruption
- Exhibits178: Impact of key risks on business
- Exhibits179: Companies covered
- Exhibits180: Company ranking index
- Exhibits181: Matrix on companies position and classification
- Exhibits182: ANDREAS STIHL AG and Co. KG - Overview
- Exhibits183: ANDREAS STIHL AG and Co. KG - Product / Service
- Exhibits184: ANDREAS STIHL AG and Co. KG - Key offerings
- Exhibits185: SWOT
- Exhibits186: Atlas Copco AB - Overview
- Exhibits187: Atlas Copco AB - Business segments
- Exhibits188: Atlas Copco AB - Key news
- Exhibits189: Atlas Copco AB - Key offerings
- Exhibits190: Atlas Copco AB - Segment focus
- Exhibits191: SWOT
- Exhibits192: Emak Spa - Overview
- Exhibits193: Emak Spa - Business segments
- Exhibits194: Emak Spa - Key offerings
- Exhibits195: Emak Spa - Segment focus
- Exhibits196: SWOT
- Exhibits197: Ferm International BV - Overview
- Exhibits198: Ferm International BV - Product / Service
- Exhibits199: Ferm International BV - Key offerings
- Exhibits200: SWOT
- Exhibits201: Hilti AG - Overview
- Exhibits202: Hilti AG - Product / Service
- Exhibits203: Hilti AG - Key offerings
- Exhibits204: SWOT
- Exhibits205: Hitachi Ltd. - Overview
- Exhibits206: Hitachi Ltd. - Business segments
- Exhibits207: Hitachi Ltd. - Key news
- Exhibits208: Hitachi Ltd. - Key offerings
- Exhibits209: Hitachi Ltd. - Segment focus
- Exhibits210: SWOT
- Exhibits211: Husqvarna AB - Overview
- Exhibits212: Husqvarna AB - Business segments
- Exhibits213: Husqvarna AB - Key news
- Exhibits214: Husqvarna AB - Key offerings
- Exhibits215: Husqvarna AB - Segment focus
- Exhibits216: SWOT
- Exhibits217: Makita Corp. - Overview
- Exhibits218: Makita Corp. - Business segments
- Exhibits219: Makita Corp. - Key offerings
- Exhibits220: Makita Corp. - Segment focus
- Exhibits221: SWOT
- Exhibits222: Panasonic Holdings Corp. - Overview
- Exhibits223: Panasonic Holdings Corp. - Business segments
- Exhibits224: Panasonic Holdings Corp. - Key news
- Exhibits225: Panasonic Holdings Corp. - Key offerings
- Exhibits226: Panasonic Holdings Corp. - Segment focus
- Exhibits227: SWOT
- Exhibits228: Robert Bosch GmbH - Overview
- Exhibits229: Robert Bosch GmbH - Product / Service
- Exhibits230: Robert Bosch GmbH - Key news
- Exhibits231: Robert Bosch GmbH - Key offerings
- Exhibits232: SWOT
- Exhibits233: Snap On Inc. - Overview
- Exhibits234: Snap On Inc. - Business segments
- Exhibits235: Snap On Inc. - Key offerings
- Exhibits236: Snap On Inc. - Segment focus
- Exhibits237: SWOT
- Exhibits238: Stanley Black and Decker Inc. - Overview
- Exhibits239: Stanley Black and Decker Inc. - Business segments
- Exhibits240: Stanley Black and Decker Inc. - Key news
- Exhibits241: Stanley Black and Decker Inc. - Key offerings
- Exhibits242: Stanley Black and Decker Inc. - Segment focus
- Exhibits243: SWOT
- Exhibits244: Stanley Electric Co. Ltd. - Overview
- Exhibits245: Stanley Electric Co. Ltd. - Business segments
- Exhibits246: Stanley Electric Co. Ltd. - Key offerings
- Exhibits247: Stanley Electric Co. Ltd. - Segment focus
- Exhibits248: SWOT
- Exhibits249: Techtronic Industries Co. Ltd. - Overview
- Exhibits250: Techtronic Industries Co. Ltd. - Business segments
- Exhibits251: Techtronic Industries Co. Ltd. - Key news
- Exhibits252: Techtronic Industries Co. Ltd. - Key offerings
- Exhibits253: Techtronic Industries Co. Ltd. - Segment focus
- Exhibits254: SWOT
- Exhibits255: The Toro Co. - Overview
- Exhibits256: The Toro Co. - Business segments
- Exhibits257: The Toro Co. - Key news
- Exhibits258: The Toro Co. - Key offerings
- Exhibits259: The Toro Co. - Segment focus
- Exhibits260: SWOT
- Exhibits261: Inclusions checklist
- Exhibits262: Exclusions checklist
- Exhibits263: Currency conversion rates for US$
- Exhibits264: Research methodology
- Exhibits265: Information sources
- Exhibits266: Data validation
- Exhibits267: Validation techniques employed for market sizing
- Exhibits268: Data synthesis
- Exhibits269: 360 degree market analysis
- Exhibits270: List of abbreviations
The cordless power tools market is forecasted to grow by USD 4014 mn during 2024-2029, accelerating at a CAGR of 3.9% during the forecast period. The report on the cordless power tools market provides a holistic analysis, market size and forecast, trends, growth drivers, and challenges, as well as vendor analysis covering around 25 vendors.
The report offers an up-to-date analysis regarding the current market scenario, the latest trends and drivers, and the overall market environment. The market is driven by advances in battery technology, growth in production of light vehicles, and diy concept gaining momentum in developed countries.
| Market Scope | |
|---|---|
| Base Year | 2025 |
| End Year | 2029 |
| Series Year | 2025-2029 |
| Growth Momentum | Accelerate |
| YOY 2025 | 3.7% |
| CAGR | 3.9% |
| Incremental Value | $4014 mn |
The study was conducted using an objective combination of primary and secondary information including inputs from key participants in the industry. The report contains a comprehensive market size data, segment with regional analysis and vendor landscape in addition to an analysis of the key companies. Reports have historic and forecast data.
Technavio's cordless power tools market is segmented as below:
By End-user
- Professional
- Consumer
By Type
- Brushed motors
- Brushless motors
By Distribution Channel
- Offline
- Online
By Product Type
- Drilling and fastening tools
- Sawing and cutting tools
- Material removal tools
- Garden tools
- Others
By Geographical Landscape
- North America
- Europe
- APAC
- South America
- Middle East and Africa
This study identifies the rise in ev sales as one of the prime reasons driving the cordless power tools market growth during the next few years. Also, integration of three dimensional (3D) printing technology and growing investments in railway and aerospace sectors will lead to sizable demand in the market.
The report on the cordless power tools market covers the following areas:
- Cordless Power Tools Market sizing
- Cordless Power Tools Market forecast
- Cordless Power Tools Market industry analysis
The robust vendor analysis is designed to help clients improve their market position, and in line with this, this report provides a detailed analysis of several leading cordless power tools market vendors that include ANDREAS STIHL AG and Co. KG, Apex Tool Group LLC, Atlas Copco AB, Emak Spa, Ferm International BV, Festool GmbH, Hilti AG, Hitachi Ltd., Husqvarna AB, Makita Corp., Panasonic Holdings Corp., Robert Bosch GmbH, Snap On Inc., Stanley Black and Decker Inc., Stanley Electric Co. Ltd., Techtronic Industries Co. Ltd., The Toro Co., and YAMABIKO CORP.. Also, the cordless power tools market analysis report includes information on upcoming trends and challenges that will influence market growth. This is to help companies strategize and leverage all forthcoming growth opportunities.
The publisher presents a detailed picture of the market by the way of study, synthesis, and summation of data from multiple sources by an analysis of key parameters such as profit, pricing, competition, and promotions. It presents various market facets by identifying the key industry influencers. The data presented is comprehensive, reliable, and a result of extensive primary and secondary research. The market research reports provide a complete competitive landscape and an in-depth vendor selection methodology and analysis using qualitative and quantitative research to forecast accurate market growth.
Table of Contents
1 Executive Summary
- 1.1 Market overview
- Executive Summary - Chart on Market Overview
- Executive Summary - Data Table on Market Overview
- Executive Summary - Chart on Global Market Characteristics
- Executive Summary - Chart on Market By Geographical Landscape
- Executive Summary - Chart on Market Segmentation by End-user
- Executive Summary - Chart on Market Segmentation by Type
- Executive Summary - Chart on Market Segmentation by Distribution Channel
- Executive Summary - Chart on Market Segmentation by Product Type
- Executive Summary - Chart on Incremental Growth
- Executive Summary - Data Table on Incremental Growth
- Executive Summary - Chart on Company Market Positioning
2 Technavio Analysis
- 2.1 Analysis of price sensitivity, lifecycle, customer purchase basket, adoption rates, and purchase criteria
- Analysis of price sensitivity, lifecycle, customer purchase basket, adoption rates, and purchase criteria
- 2.2 Criticality of inputs and Factors of differentiation
- Overview on criticality of inputs and factors of differentiation
- 2.3 Factors of disruption
- Overview on factors of disruption
- 2.4 Impact of drivers and challenges
- Impact of drivers and challenges in 2024 and 2029
3 Market Landscape
- 3.1 Market ecosystem
- Parent Market
- Data Table on - Parent Market
- 3.2 Market characteristics
- Market characteristics analysis
- 3.3 Value chain analysis
- Value chain analysis
4 Market Sizing
- 4.1 Market definition
- Offerings of companies included in the market definition
- 4.2 Market segment analysis
- Market segments
- 4.3 Market size 2024
- 4.4 Market outlook: Forecast for 2024-2029
- Chart on Global - Market size and forecast 2024-2029 ($ million)
- Data Table on Global - Market size and forecast 2024-2029 ($ million)
- Chart on Global Market: Year-over-year growth 2024-2029 (%)
- Data Table on Global Market: Year-over-year growth 2024-2029 (%)
5 Historic Market Size
- 5.1 Global Cordless Power Tools Market 2019 - 2023
- Historic Market Size - Data Table on Global Cordless Power Tools Market 2019 - 2023 ($ million)
- 5.2 End-user segment analysis 2019 - 2023
- Historic Market Size - End-user Segment 2019 - 2023 ($ million)
- 5.3 Type segment analysis 2019 - 2023
- Historic Market Size - Type Segment 2019 - 2023 ($ million)
- 5.4 Distribution Channel segment analysis 2019 - 2023
- Historic Market Size - Distribution Channel Segment 2019 - 2023 ($ million)
- 5.5 Product Type segment analysis 2019 - 2023
- Historic Market Size - Product Type Segment 2019 - 2023 ($ million)
- 5.6 Geography segment analysis 2019 - 2023
- Historic Market Size - Geography Segment 2019 - 2023 ($ million)
- 5.7 Country segment analysis 2019 - 2023
- Historic Market Size - Country Segment 2019 - 2023 ($ million)
6 Qualitative Analysis
- 6.1 Impact of AI on Global Cordless Power Tools Market
7 Five Forces Analysis
- 7.1 Five forces summary
- Five forces analysis - Comparison between 2024 and 2029
- 7.2 Bargaining power of buyers
- Bargaining power of buyers - Impact of key factors 2024 and 2029
- 7.3 Bargaining power of suppliers
- Bargaining power of suppliers - Impact of key factors in 2024 and 2029
- 7.4 Threat of new entrants
- Threat of new entrants - Impact of key factors in 2024 and 2029
- 7.5 Threat of substitutes
- Threat of substitutes - Impact of key factors in 2024 and 2029
- 7.6 Threat of rivalry
- Threat of rivalry - Impact of key factors in 2024 and 2029
- 7.7 Market condition
- Chart on Market condition - Five forces 2024 and 2029
8 Market Segmentation by End-user
- 8.1 Market segments
- Chart on End-user - Market share 2024-2029 (%)
- Data Table on End-user - Market share 2024-2029 (%)
- 8.2 Comparison by End-user
- Chart on Comparison by End-user
- Data Table on Comparison by End-user
- 8.3 Professional - Market size and forecast 2024-2029
- Chart on Professional - Market size and forecast 2024-2029 ($ million)
- Data Table on Professional - Market size and forecast 2024-2029 ($ million)
- Chart on Professional - Year-over-year growth 2024-2029 (%)
- Data Table on Professional - Year-over-year growth 2024-2029 (%)
- 8.4 Consumer - Market size and forecast 2024-2029
- Chart on Consumer - Market size and forecast 2024-2029 ($ million)
- Data Table on Consumer - Market size and forecast 2024-2029 ($ million)
- Chart on Consumer - Year-over-year growth 2024-2029 (%)
- Data Table on Consumer - Year-over-year growth 2024-2029 (%)
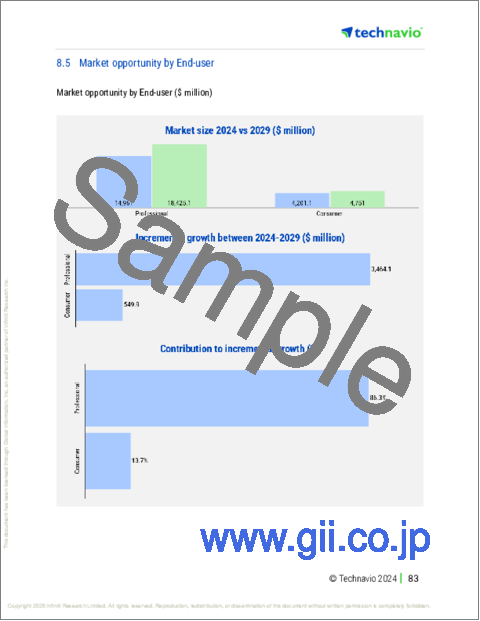
- 8.5 Market opportunity by End-user
- Market opportunity by End-user ($ million)
- Data Table on Market opportunity by End-user ($ million)
9 Market Segmentation by Type
- 9.1 Market segments
- Chart on Type - Market share 2024-2029 (%)
- Data Table on Type - Market share 2024-2029 (%)
- 9.2 Comparison by Type
- Chart on Comparison by Type
- Data Table on Comparison by Type
- 9.3 Brushed motors - Market size and forecast 2024-2029
- Chart on Brushed motors - Market size and forecast 2024-2029 ($ million)
- Data Table on Brushed motors - Market size and forecast 2024-2029 ($ million)
- Chart on Brushed motors - Year-over-year growth 2024-2029 (%)
- Data Table on Brushed motors - Year-over-year growth 2024-2029 (%)
- 9.4 Brushless motors - Market size and forecast 2024-2029
- Chart on Brushless motors - Market size and forecast 2024-2029 ($ million)
- Data Table on Brushless motors - Market size and forecast 2024-2029 ($ million)
- Chart on Brushless motors - Year-over-year growth 2024-2029 (%)
- Data Table on Brushless motors - Year-over-year growth 2024-2029 (%)
- 9.5 Market opportunity by Type
- Market opportunity by Type ($ million)
- Data Table on Market opportunity by Type ($ million)
10 Market Segmentation by Distribution Channel
- 10.1 Market segments
- Chart on Distribution Channel - Market share 2024-2029 (%)
- Data Table on Distribution Channel - Market share 2024-2029 (%)
- 10.2 Comparison by Distribution Channel
- Chart on Comparison by Distribution Channel
- Data Table on Comparison by Distribution Channel
- 10.3 Offline - Market size and forecast 2024-2029
- Chart on Offline - Market size and forecast 2024-2029 ($ million)
- Data Table on Offline - Market size and forecast 2024-2029 ($ million)
- Chart on Offline - Year-over-year growth 2024-2029 (%)
- Data Table on Offline - Year-over-year growth 2024-2029 (%)
- 10.4 Online - Market size and forecast 2024-2029
- Chart on Online - Market size and forecast 2024-2029 ($ million)
- Data Table on Online - Market size and forecast 2024-2029 ($ million)
- Chart on Online - Year-over-year growth 2024-2029 (%)
- Data Table on Online - Year-over-year growth 2024-2029 (%)
- 10.5 Market opportunity by Distribution Channel
- Market opportunity by Distribution Channel ($ million)
- Data Table on Market opportunity by Distribution Channel ($ million)
11 Market Segmentation by Product Type
- 11.1 Market segments
- Chart on Product Type - Market share 2024-2029 (%)
- Data Table on Product Type - Market share 2024-2029 (%)
- 11.2 Comparison by Product Type
- Chart on Comparison by Product Type
- Data Table on Comparison by Product Type
- 11.3 Drilling and fastening tools - Market size and forecast 2024-2029
- Chart on Drilling and fastening tools - Market size and forecast 2024-2029 ($ million)
- Data Table on Drilling and fastening tools - Market size and forecast 2024-2029 ($ million)
- Chart on Drilling and fastening tools - Year-over-year growth 2024-2029 (%)
- Data Table on Drilling and fastening tools - Year-over-year growth 2024-2029 (%)
- 11.4 Sawing and cutting tools - Market size and forecast 2024-2029
- Chart on Sawing and cutting tools - Market size and forecast 2024-2029 ($ million)
- Data Table on Sawing and cutting tools - Market size and forecast 2024-2029 ($ million)
- Chart on Sawing and cutting tools - Year-over-year growth 2024-2029 (%)
- Data Table on Sawing and cutting tools - Year-over-year growth 2024-2029 (%)
- 11.5 Material removal tools - Market size and forecast 2024-2029
- Chart on Material removal tools - Market size and forecast 2024-2029 ($ million)
- Data Table on Material removal tools - Market size and forecast 2024-2029 ($ million)
- Chart on Material removal tools - Year-over-year growth 2024-2029 (%)
- Data Table on Material removal tools - Year-over-year growth 2024-2029 (%)
- 11.6 Garden tools - Market size and forecast 2024-2029
- Chart on Garden tools - Market size and forecast 2024-2029 ($ million)
- Data Table on Garden tools - Market size and forecast 2024-2029 ($ million)
- Chart on Garden tools - Year-over-year growth 2024-2029 (%)
- Data Table on Garden tools - Year-over-year growth 2024-2029 (%)
- 11.7 Others - Market size and forecast 2024-2029
- Chart on Others - Market size and forecast 2024-2029 ($ million)
- Data Table on Others - Market size and forecast 2024-2029 ($ million)
- Chart on Others - Year-over-year growth 2024-2029 (%)
- Data Table on Others - Year-over-year growth 2024-2029 (%)
- 11.8 Market opportunity by Product Type
- Market opportunity by Product Type ($ million)
- Data Table on Market opportunity by Product Type ($ million)
12 Customer Landscape
- 12.1 Customer landscape overview
- Analysis of price sensitivity, lifecycle, customer purchase basket, adoption rates, and purchase criteria
13 Geographic Landscape
- 13.1 Geographic segmentation
- Chart on Market share By Geographical Landscape 2024-2029 (%)
- Data Table on Market share By Geographical Landscape 2024-2029 (%)
- 13.2 Geographic comparison
- Chart on Geographic comparison
- Data Table on Geographic comparison
- 13.3 North America - Market size and forecast 2024-2029
- Chart on North America - Market size and forecast 2024-2029 ($ million)
- Data Table on North America - Market size and forecast 2024-2029 ($ million)
- Chart on North America - Year-over-year growth 2024-2029 (%)
- Data Table on North America - Year-over-year growth 2024-2029 (%)
- 13.4 Europe - Market size and forecast 2024-2029
- Chart on Europe - Market size and forecast 2024-2029 ($ million)
- Data Table on Europe - Market size and forecast 2024-2029 ($ million)
- Chart on Europe - Year-over-year growth 2024-2029 (%)
- Data Table on Europe - Year-over-year growth 2024-2029 (%)
- 13.5 APAC - Market size and forecast 2024-2029
- Chart on APAC - Market size and forecast 2024-2029 ($ million)
- Data Table on APAC - Market size and forecast 2024-2029 ($ million)
- Chart on APAC - Year-over-year growth 2024-2029 (%)
- Data Table on APAC - Year-over-year growth 2024-2029 (%)
- 13.6 South America - Market size and forecast 2024-2029
- Chart on South America - Market size and forecast 2024-2029 ($ million)
- Data Table on South America - Market size and forecast 2024-2029 ($ million)
- Chart on South America - Year-over-year growth 2024-2029 (%)
- Data Table on South America - Year-over-year growth 2024-2029 (%)
- 13.7 Middle East and Africa - Market size and forecast 2024-2029
- Chart on Middle East and Africa - Market size and forecast 2024-2029 ($ million)
- Data Table on Middle East and Africa - Market size and forecast 2024-2029 ($ million)
- Chart on Middle East and Africa - Year-over-year growth 2024-2029 (%)
- Data Table on Middle East and Africa - Year-over-year growth 2024-2029 (%)
- 13.8 US - Market size and forecast 2024-2029
- Chart on US - Market size and forecast 2024-2029 ($ million)
- Data Table on US - Market size and forecast 2024-2029 ($ million)
- Chart on US - Year-over-year growth 2024-2029 (%)
- Data Table on US - Year-over-year growth 2024-2029 (%)
- 13.9 China - Market size and forecast 2024-2029
- Chart on China - Market size and forecast 2024-2029 ($ million)
- Data Table on China - Market size and forecast 2024-2029 ($ million)
- Chart on China - Year-over-year growth 2024-2029 (%)
- Data Table on China - Year-over-year growth 2024-2029 (%)
- 13.10 Canada - Market size and forecast 2024-2029
- Chart on Canada - Market size and forecast 2024-2029 ($ million)
- Data Table on Canada - Market size and forecast 2024-2029 ($ million)
- Chart on Canada - Year-over-year growth 2024-2029 (%)
- Data Table on Canada - Year-over-year growth 2024-2029 (%)
- 13.11 Germany - Market size and forecast 2024-2029
- Chart on Germany - Market size and forecast 2024-2029 ($ million)
- Data Table on Germany - Market size and forecast 2024-2029 ($ million)
- Chart on Germany - Year-over-year growth 2024-2029 (%)
- Data Table on Germany - Year-over-year growth 2024-2029 (%)
- 13.12 UK - Market size and forecast 2024-2029
- Chart on UK - Market size and forecast 2024-2029 ($ million)
- Data Table on UK - Market size and forecast 2024-2029 ($ million)
- Chart on UK - Year-over-year growth 2024-2029 (%)
- Data Table on UK - Year-over-year growth 2024-2029 (%)
- 13.13 India - Market size and forecast 2024-2029
- Chart on India - Market size and forecast 2024-2029 ($ million)
- Data Table on India - Market size and forecast 2024-2029 ($ million)
- Chart on India - Year-over-year growth 2024-2029 (%)
- Data Table on India - Year-over-year growth 2024-2029 (%)
- 13.14 France - Market size and forecast 2024-2029
- Chart on France - Market size and forecast 2024-2029 ($ million)
- Data Table on France - Market size and forecast 2024-2029 ($ million)
- Chart on France - Year-over-year growth 2024-2029 (%)
- Data Table on France - Year-over-year growth 2024-2029 (%)
- 13.15 Japan - Market size and forecast 2024-2029
- Chart on Japan - Market size and forecast 2024-2029 ($ million)
- Data Table on Japan - Market size and forecast 2024-2029 ($ million)
- Chart on Japan - Year-over-year growth 2024-2029 (%)
- Data Table on Japan - Year-over-year growth 2024-2029 (%)
- 13.16 Brazil - Market size and forecast 2024-2029
- Chart on Brazil - Market size and forecast 2024-2029 ($ million)
- Data Table on Brazil - Market size and forecast 2024-2029 ($ million)
- Chart on Brazil - Year-over-year growth 2024-2029 (%)
- Data Table on Brazil - Year-over-year growth 2024-2029 (%)
- 13.17 Italy - Market size and forecast 2024-2029
- Chart on Italy - Market size and forecast 2024-2029 ($ million)
- Data Table on Italy - Market size and forecast 2024-2029 ($ million)
- Chart on Italy - Year-over-year growth 2024-2029 (%)
- Data Table on Italy - Year-over-year growth 2024-2029 (%)
- 13.18 Market opportunity By Geographical Landscape
- Market opportunity By Geographical Landscape ($ million)
- Data Tables on Market opportunity By Geographical Landscape ($ million)
14 Drivers, Challenges, and Opportunity/Restraints
- 14.1 Market drivers
- 14.2 Market challenges
- 14.3 Impact of drivers and challenges
- Impact of drivers and challenges in 2024 and 2029
- 14.4 Market opportunities/restraints
15 Competitive Landscape
- 15.1 Overview
- 15.2 Competitive Landscape
- Overview on criticality of inputs and factors of differentiation
- 15.3 Landscape disruption
- Overview on factors of disruption
- 15.4 Industry risks
- Impact of key risks on business
16 Competitive Analysis
- 16.1 Companies profiled
- Companies covered
- 16.2 Company ranking index
- Company ranking index
- 16.3 Market positioning of companies
- Matrix on companies position and classification
- 16.4 ANDREAS STIHL AG and Co. KG
- ANDREAS STIHL AG and Co. KG - Overview
- ANDREAS STIHL AG and Co. KG - Product / Service
- ANDREAS STIHL AG and Co. KG - Key offerings
- SWOT
- 16.5 Atlas Copco AB
- Atlas Copco AB - Overview
- Atlas Copco AB - Business segments
- Atlas Copco AB - Key news
- Atlas Copco AB - Key offerings
- Atlas Copco AB - Segment focus
- SWOT
- 16.6 Emak Spa
- Emak Spa - Overview
- Emak Spa - Business segments
- Emak Spa - Key offerings
- Emak Spa - Segment focus
- SWOT
- 16.7 Ferm International BV
- Ferm International BV - Overview
- Ferm International BV - Product / Service
- Ferm International BV - Key offerings
- SWOT
- 16.8 Hilti AG
- Hilti AG - Overview
- Hilti AG - Product / Service
- Hilti AG - Key offerings
- SWOT
- 16.9 Hitachi Ltd.
- Hitachi Ltd. - Overview
- Hitachi Ltd. - Business segments
- Hitachi Ltd. - Key news
- Hitachi Ltd. - Key offerings
- Hitachi Ltd. - Segment focus
- SWOT
- 16.10 Husqvarna AB
- Husqvarna AB - Overview
- Husqvarna AB - Business segments
- Husqvarna AB - Key news
- Husqvarna AB - Key offerings
- Husqvarna AB - Segment focus
- SWOT
- 16.11 Makita Corp.
- Makita Corp. - Overview
- Makita Corp. - Business segments
- Makita Corp. - Key offerings
- Makita Corp. - Segment focus
- SWOT
- 16.12 Panasonic Holdings Corp.
- Panasonic Holdings Corp. - Overview
- Panasonic Holdings Corp. - Business segments
- Panasonic Holdings Corp. - Key news
- Panasonic Holdings Corp. - Key offerings
- Panasonic Holdings Corp. - Segment focus
- SWOT
- 16.13 Robert Bosch GmbH
- Robert Bosch GmbH - Overview
- Robert Bosch GmbH - Product / Service
- Robert Bosch GmbH - Key news
- Robert Bosch GmbH - Key offerings
- SWOT
- 16.14 Snap On Inc.
- Snap On Inc. - Overview
- Snap On Inc. - Business segments
- Snap On Inc. - Key offerings
- Snap On Inc. - Segment focus
- SWOT
- 16.15 Stanley Black and Decker Inc.
- Stanley Black and Decker Inc. - Overview
- Stanley Black and Decker Inc. - Business segments
- Stanley Black and Decker Inc. - Key news
- Stanley Black and Decker Inc. - Key offerings
- Stanley Black and Decker Inc. - Segment focus
- SWOT
- 16.16 Stanley Electric Co. Ltd.
- Stanley Electric Co. Ltd. - Overview
- Stanley Electric Co. Ltd. - Business segments
- Stanley Electric Co. Ltd. - Key offerings
- Stanley Electric Co. Ltd. - Segment focus
- SWOT
- 16.17 Techtronic Industries Co. Ltd.
- Techtronic Industries Co. Ltd. - Overview
- Techtronic Industries Co. Ltd. - Business segments
- Techtronic Industries Co. Ltd. - Key news
- Techtronic Industries Co. Ltd. - Key offerings
- Techtronic Industries Co. Ltd. - Segment focus
- SWOT
- 16.18 The Toro Co.
- The Toro Co. - Overview
- The Toro Co. - Business segments
- The Toro Co. - Key news
- The Toro Co. - Key offerings
- The Toro Co. - Segment focus
- SWOT
17 Appendix
- 17.1 Scope of the report
- 17.2 Inclusions and exclusions checklist
- Inclusions checklist
- Exclusions checklist
- 17.3 Currency conversion rates for US$
- Currency conversion rates for US$
- 17.4 Research methodology
- Research methodology
- 17.5 Data procurement
- Information sources
- 17.6 Data validation
- Data validation
- 17.7 Validation techniques employed for market sizing
- Validation techniques employed for market sizing
- 17.8 Data synthesis
- Data synthesis
- 17.9 360 degree market analysis
- 360 degree market analysis
- 17.10 List of abbreviations
- List of abbreviations
