|
|
市場調査レポート
商品コード
1072819
安全服の世界市場:2022年~2026年Global Safety Apparel Market 2022-2026 |
||||||
|
|
|||||||
|
● お客様のご希望に応じて、既存データの加工や未掲載情報(例:国別セグメント)の追加などの対応が可能です。 詳細はお問い合わせください。 |
|||||||


| 安全服の世界市場:2022年~2026年 |
|
出版日: 2022年04月28日
発行: TechNavio
ページ情報: 英文 120 Pages
納期: 即納可能
|
- 全表示
- 概要
- 図表
- 目次
世界の安全服の市場規模は、2022年から2026年の間に98億米ドル成長し、予測期間中は11.3%のCAGRとなる見込みです。
同市場は、安全服のカスタマイズと品質の重視、アジア太平洋で興隆する建設および製造業、OSHAなどの機関による規制の実施などに牽引されています。
当レポートでは、安全服の世界市場の全体的な分析、市場規模と予測、動向、成長促進要因、課題、および約25のベンダーをカバーする分析を提供しています。
目次
第1章 エグゼクティブサマリー
- 市場概要
第2章 市場情勢
- 市場のエコシステム
第3章 市場規模
- 市場の定義
- 市場セグメント分析
- 2021年の市場規模
- 市場の見通し:2021年から2026年の予測
第4章 ファイブフォース分析
- ファイブフォースまとめ
- 買い手の交渉力
- 供給企業の交渉力
- 新規参入業者の脅威
- 代替品の脅威
- 競争の脅威
- 市況
第5章 市場セグメンテーション:アプリケーション別
- 市場セグメント
- アプリケーション別の比較
- 化学防御:市場規模と予測(2021年~2026年)
- 難燃性:市場規模と予測(2021年~2026年)
- 機械式:市場規模と予測(2021年~2026年)
- 高視認性:市場規模と予測(2021年~2026年)
- その他:市場規模と予測(2021年~2026年)
- アプリケーション別の市場機会
第6章 顧客情勢
- Technavioの顧客情勢マトリックスを用いた推進要因または価格感受性、採用ライフサイクル、顧客価格バスケットの重要性、採用率、主要な購入基準の比較
- 顧客情勢の概要
第7章 地域別情勢
- 地域別セグメンテーション
- 地域別の比較
- アジア太平洋:市場規模と予測(2021年~2026年)
- 北米:市場規模と予測(2021年~2026年)
- 欧州:市場規模と予測(2021年~2026年)
- 南米:市場規模と予測(2021年~2026年)
- 中東とアフリカ:市場規模と予測(2021年~2026年)
- 米国:市場規模と予測(2021年~2026年)
- 中国:市場規模と予測(2021年~2026年)
- 英国:市場規模と予測(2021年~2026年)
- カナダ:市場規模と予測(2021年~2026年)
- 地域情勢別の市場機会
第8章 推進要因、課題、および動向
- 市場推進要因
- 安全服のカスタマイズと品質の重視
- アジア太平洋で興隆する建設および製造業
- OSHAなどの機関による規制の実施
- 市場の課題
- サプライチェーンに影響を与える原材料コストの増加
- 既存の安全服の販売に影響を与える急速な製品革新
- COVID-19が石油・ガス産業に与える影響
- 推進要因と課題の影響
- 市場動向
- スマートでウェアラブルな技術の実装
- より広いマーケットリーチにつながる合併と買収
- オンライン販売チャネル人気の高まり
第9章 ベンダー情勢
- 概要
- ベンダー情勢
- 混乱の状況
- 業界のリスク
第10章 ベンダー分析
- 対象ベンダー
- ベンダーの市場ポジショニング
- 3M Corp
- Ansell Ltd.
- Ballyclare Ltd.
- Delta Plus Group
- DuPont de Nemours Inc.
- Honeywell International Inc.
- Kimberly Clark Corp.
Exhibits:
- Exhibits1: Executive Summary - Chart on Market Overview
- Exhibits2: Executive Summary - Data Table on Market Overview
- Exhibits3: Executive Summary - Chart on Global Market Characteristics
- Exhibits4: Executive Summary - Chart on Market By Geographical Landscape
- Exhibits5: Executive Summary - Chart on Market Segmentation by Application
- Exhibits6: Executive Summary - Chart on Incremental Growth
- Exhibits7: Executive Summary - Data Table on Incremental Growth
- Exhibits8: Executive Summary - Chart on Vendor Market Positioning
- Exhibits9: Parent market
- Exhibits10: Market Characteristics
- Exhibits11: Offerings of vendors included in the market definition
- Exhibits12: Market segments
- Exhibits13: Chart on Global - Market size and forecast 2021-2026 ($ million)
- Exhibits14: Data Table on Global - Market size and forecast 2021-2026 ($ million)
- Exhibits15: Chart on Global Market: Year-over-year growth 2021-2026 (%)
- Exhibits16: Data Table on Global Market: Year-over-year growth 2021-2026 (%)
- Exhibits17: Five forces analysis - Comparison between2021 and 2026
- Exhibits18: Chart on Bargaining power of buyers - Impact of key factors 2021 and 2026
- Exhibits19: Bargaining power of suppliers - Impact of key factors in 2021 and 2026
- Exhibits20: Threat of new entrants - Impact of key factors in 2021 and 2026
- Exhibits21: Threat of substitutes - Impact of key factors in 2021 and 2026
- Exhibits22: Threat of rivalry - Impact of key factors in 2021 and 2026
- Exhibits23: Chart on Market condition - Five forces 2021 and 2026
- Exhibits24: Chart on Application - Market share 2021-2026 (%)
- Exhibits25: Data Table on Application - Market share 2021-2026 (%)
- Exhibits26: Chart on Comparison by Application
- Exhibits27: Data Table on Comparison by Application
- Exhibits28: Chart on Chemical defending - Market size and forecast 2021-2026 ($ million)
- Exhibits29: Data Table on Chemical defending - Market size and forecast 2021-2026 ($ million)
- Exhibits30: Chart on Chemical defending - Year-over-year growth 2021-2026 (%)
- Exhibits31: Data Table on Chemical defending - Year-over-year growth 2021-2026 (%)
- Exhibits32: Chart on Flame retardant - Market size and forecast 2021-2026 ($ million)
- Exhibits33: Data Table on Flame retardant - Market size and forecast 2021-2026 ($ million)
- Exhibits34: Chart on Flame retardant - Year-over-year growth 2021-2026 (%)
- Exhibits35: Data Table on Flame retardant - Year-over-year growth 2021-2026 (%)
- Exhibits36: Chart on Mechanical - Market size and forecast 2021-2026 ($ million)
- Exhibits37: Data Table on Mechanical - Market size and forecast 2021-2026 ($ million)
- Exhibits38: Chart on Mechanical - Year-over-year growth 2021-2026 (%)
- Exhibits39: Data Table on Mechanical - Year-over-year growth 2021-2026 (%)
- Exhibits40: Chart on High visibility - Market size and forecast 2021-2026 ($ million)
- Exhibits41: Data Table on High visibility - Market size and forecast 2021-2026 ($ million)
- Exhibits42: Chart on High visibility - Year-over-year growth 2021-2026 (%)
- Exhibits43: Data Table on High visibility - Year-over-year growth 2021-2026 (%)
- Exhibits44: Chart on Others - Market size and forecast 2021-2026 ($ million)
- Exhibits45: Data Table on Others - Market size and forecast 2021-2026 ($ million)
- Exhibits46: Chart on Others - Year-over-year growth 2021-2026 (%)
- Exhibits47: Data Table on Others - Year-over-year growth 2021-2026 (%)
- Exhibits48: Market opportunity by Application ($ million)
- Exhibits49: Analysis of price sensitivity, lifecycle, customer purchase basket, adoption rates, and purchase criteria
- Exhibits50: Chart on Market share By Geographical Landscape 2021-2026 (%)
- Exhibits51: Data Table on Market share By Geographical Landscape 2021-2026 (%)
- Exhibits52: Chart on Geographic comparison
- Exhibits53: Data Table on Geographic comparison
- Exhibits54: Chart on APAC - Market size and forecast 2021-2026 ($ million)
- Exhibits55: Data Table on APAC - Market size and forecast 2021-2026 ($ million)
- Exhibits56: Chart on APAC - Year-over-year growth 2021-2026 (%)
- Exhibits57: Data Table on APAC - Year-over-year growth 2021-2026 (%)
- Exhibits58: Chart on North America - Market size and forecast 2021-2026 ($ million)
- Exhibits59: Data Table on North America - Market size and forecast 2021-2026 ($ million)
- Exhibits60: Chart on North America - Year-over-year growth 2021-2026 (%)
- Exhibits61: Data Table on North America - Year-over-year growth 2021-2026 (%)
- Exhibits62: Chart on Europe - Market size and forecast 2021-2026 ($ million)
- Exhibits63: Data Table on Europe - Market size and forecast 2021-2026 ($ million)
- Exhibits64: Chart on Europe - Year-over-year growth 2021-2026 (%)
- Exhibits65: Data Table on Europe - Year-over-year growth 2021-2026 (%)
- Exhibits66: Chart on South America - Market size and forecast 2021-2026 ($ million)
- Exhibits67: Data Table on South America - Market size and forecast 2021-2026 ($ million)
- Exhibits68: Chart on South America - Year-over-year growth 2021-2026 (%)
- Exhibits69: Data Table on South America - Year-over-year growth 2021-2026 (%)
- Exhibits70: Chart on Middle East and Africa - Market size and forecast 2021-2026 ($ million)
- Exhibits71: Data Table on Middle East and Africa - Market size and forecast 2021-2026 ($ million)
- Exhibits72: Chart on Middle East and Africa - Year-over-year growth 2021-2026 (%)
- Exhibits73: Data Table on Middle East and Africa - Year-over-year growth 2021-2026 (%)
- Exhibits74: Chart on US - Market size and forecast 2021-2026 ($ million)
- Exhibits75: Data Table on US - Market size and forecast 2021-2026 ($ million)
- Exhibits76: Chart on US - Year-over-year growth 2021-2026 (%)
- Exhibits77: Data Table on US - Year-over-year growth 2021-2026 (%)
- Exhibits78: Chart on China - Market size and forecast 2021-2026 ($ million)
- Exhibits79: Data Table on China - Market size and forecast 2021-2026 ($ million)
- Exhibits80: Chart on China - Year-over-year growth 2021-2026 (%)
- Exhibits81: Data Table on China - Year-over-year growth 2021-2026 (%)
- Exhibits82: Chart on Japan - Market size and forecast 2021-2026 ($ million)
- Exhibits83: Data Table on Japan - Market size and forecast 2021-2026 ($ million)
- Exhibits84: Chart on Japan - Year-over-year growth 2021-2026 (%)
- Exhibits85: Data Table on Japan - Year-over-year growth 2021-2026 (%)
- Exhibits86: Chart on Germany - Market size and forecast 2021-2026 ($ million)
- Exhibits87: Data Table on Germany - Market size and forecast 2021-2026 ($ million)
- Exhibits88: Chart on Germany - Year-over-year growth 2021-2026 (%)
- Exhibits89: Data Table on Germany - Year-over-year growth 2021-2026 (%)
- Exhibits90: Chart on Canada - Market size and forecast 2021-2026 ($ million)
- Exhibits91: Data Table on Canada - Market size and forecast 2021-2026 ($ million)
- Exhibits92: Chart on Canada - Year-over-year growth 2021-2026 (%)
- Exhibits93: Data Table on Canada - Year-over-year growth 2021-2026 (%)
- Exhibits94: Chart on UK - Market size and forecast 2021-2026 ($ million)
- Exhibits95: Data Table on UK - Market size and forecast 2021-2026 ($ million)
- Exhibits96: Chart on UK - Year-over-year growth 2021-2026 (%)
- Exhibits97: Data Table on UK - Year-over-year growth 2021-2026 (%)
- Exhibits98: Market opportunity By Geographical Landscape ($ million)
- Exhibits99: Impact of drivers and challenges in 2021 and 2026
- Exhibits100: Overview on Criticality of inputs and Factors of differentiation
- Exhibits101: Overview on factors of disruption
- Exhibits102: Impact of key risks on business
- Exhibits103: Vendors covered
- Exhibits104: Matrix on vendor position and classification
- Exhibits105: 3M Corp - Overview
- Exhibits106: 3M Corp - Business segments
- Exhibits107: 3M Corp - Key news
- Exhibits108: 3M Corp - Key offerings
- Exhibits109: 3M Corp - Segment focus
- Exhibits110: Ansell Ltd. - Overview
- Exhibits111: Ansell Ltd. - Business segments
- Exhibits112: Ansell Ltd. - Key news
- Exhibits113: Ansell Ltd. - Key offerings
- Exhibits114: Ansell Ltd. - Segment focus
- Exhibits115: Ballyclare Ltd. - Overview
- Exhibits116: Ballyclare Ltd. - Product / Service
- Exhibits117: Ballyclare Ltd. - Key offerings
- Exhibits118: Delta Plus Group - Overview
- Exhibits119: Delta Plus Group - Business segments
- Exhibits120: Delta Plus Group - Key offerings
- Exhibits121: Delta Plus Group - Segment focus
- Exhibits122: DuPont de Nemours Inc. - Overview
- Exhibits123: DuPont de Nemours Inc. - Business segments
- Exhibits124: DuPont de Nemours Inc. - Key offerings
- Exhibits125: DuPont de Nemours Inc. - Segment focus
- Exhibits126: Honeywell International Inc. - Overview
- Exhibits127: Honeywell International Inc. - Business segments
- Exhibits128: Honeywell International Inc. - Key news
- Exhibits129: Honeywell International Inc. - Key offerings
- Exhibits130: Honeywell International Inc. - Segment focus
- Exhibits131: Kimberly Clark Corp. - Overview
- Exhibits132: Kimberly Clark Corp. - Business segments
- Exhibits133: Kimberly Clark Corp. - Key news
- Exhibits134: Kimberly Clark Corp. - Key offerings
- Exhibits135: Kimberly Clark Corp. - Segment focus
- Exhibits136: Lakeland Industries Inc. - Overview
- Exhibits137: Lakeland Industries Inc. - Business segments
- Exhibits138: Lakeland Industries Inc. - Key offerings
- Exhibits139: Lakeland Industries Inc. - Segment focus
- Exhibits140: Sioen Industries NV - Overview
- Exhibits141: Sioen Industries NV - Business segments
- Exhibits142: Sioen Industries NV - Key offerings
- Exhibits143: Sioen Industries NV - Segment focus
- Exhibits144: Teijin Ltd. - Overview
- Exhibits145: Teijin Ltd. - Business segments
- Exhibits146: Teijin Ltd. - Key offerings
- Exhibits147: Teijin Ltd. - Segment focus
- Exhibits148: Inclusions checklist
- Exhibits149: Exclusions checklist
- Exhibits150: Currency conversion rates for US$
- Exhibits151: Research methodology
- Exhibits152: Validation techniques employed for market sizing
- Exhibits153: Information sources
- Exhibits154: List of abbreviations
Technavio has been monitoring the safety apparel market and it is poised to grow by $ 9.80 bn during 2022-2026, decelerating at a CAGR of 11.3% during the forecast period. Our report on the safety apparel market provides a holistic analysis, market size and forecast, trends, growth drivers, and challenges, as well as vendor analysis covering around 25 vendors.
The report offers an up-to-date analysis regarding the current global market scenario, latest trends and drivers, and the overall market environment. The market is driven by high emphasis on customization and quality of safety apparel, flourishing construction and manufacturing industries in APAC, and implementation of regulations by agencies like OSHA.
The safety apparel market analysis includes the application segment and geographic landscape.
Technavio's safety apparel market is segmented as below:
By Application
- Chemical defending
- Flame retardant
- Mechanical
- High visibility
- Others
By Geographical Landscape
- APAC
- North America
- Europe
- South America
- Middle East and Africa
This study identifies the implementation of smart and wearable technology as one of the prime reasons driving the safety apparel market growth during the next few years. Also, mergers and acquisitions leading to a wider market reach and growing preference for online sales channels will lead to sizable demand in the market.
Technavio presents a detailed picture of the market by the way of study, synthesis, and summation of data from multiple sources by an analysis of key parameters. Our report on safety apparel market covers the following areas:
- Safety apparel market sizing
- Safety apparel market forecast
- Safety apparel market industry analysis
Technavio's robust vendor analysis is designed to help clients improve their market position, and in line with this, this report provides a detailed analysis of several leading safety apparel market vendors that include 3M Corp, Anbu Safety Industrial Co. Ltd., Ansell Ltd., ASATEX AG, Ballyclare Ltd., Delta Plus Group, DuPont de Nemours Inc., Honeywell International Inc., KERMEL, Kimberly Clark Corp., Lakeland Industries Inc., NASCO Industries Inc., OccuNomix International LLC, Sioen Industries NV, Teijin Ltd., UniFirst Corp., VF Imagewear Inc., and W. L. Gore and Associates Inc. Also, the safety apparel market analysis report includes information on upcoming trends and challenges that will influence market growth. This is to help companies strategize and leverage all forthcoming growth opportunities.
The study was conducted using an objective combination of primary and secondary information including inputs from key participants in the industry. The report contains a comprehensive market and vendor landscape in addition to an analysis of the key vendors.
Technavio presents a detailed picture of the market by the way of study, synthesis, and summation of data from multiple sources by an analysis of key parameters such as profit, pricing, competition, and promotions. It presents various market facets by identifying the key industry influencers. The data presented is comprehensive, reliable, and a result of extensive research - both primary and secondary. Technavio's market research reports provide a complete competitive landscape and an in-depth vendor selection methodology and analysis using qualitative and quantitative research to forecast the accurate market growth.
Table of Contents
1. Executive Summary
- 1.1 Market overview
- Exhibit 01: Executive Summary - Chart on Market Overview
- Exhibit 02: Executive Summary - Data Table on Market Overview
- Exhibit 03: Executive Summary - Chart on Global Market Characteristics
- Exhibit 04: Executive Summary - Chart on Market By Geographical Landscape
- Exhibit 05: Executive Summary - Chart on Market Segmentation by Application
- Exhibit 06: Executive Summary - Chart on Incremental Growth
- Exhibit 07: Executive Summary - Data Table on Incremental Growth
- Exhibit 08: Executive Summary - Chart on Vendor Market Positioning
2. Market Landscape
- 2.1 Market ecosystem
- Exhibit 09: Parent market
- Exhibit 10: Market Characteristics
3. Market Sizing
- 3.1 Market definition
- Exhibit 11: Offerings of vendors included in the market definition
- 3.2 Market segment analysis
- Exhibit 12: Market segments
- 3.3 Market size 2021
- 3.4 Market outlook: Forecast for 2021-2026
- Exhibit 13: Chart on Global - Market size and forecast 2021-2026 ($ million)
- Exhibit 14: Data Table on Global - Market size and forecast 2021-2026 ($ million)
- Exhibit 15: Chart on Global Market: Year-over-year growth 2021-2026 (%)
- Exhibit 16: Data Table on Global Market: Year-over-year growth 2021-2026 (%)
4. Five Forces Analysis
- 4.1 Five Forces Summary
- Exhibit 17: Five forces analysis - Comparison between2021 and 2026
- 4.2 Bargaining power of buyers
- Exhibit 18: Chart on Bargaining power of buyers - Impact of key factors 2021 and 2026
- 4.3 Bargaining power of suppliers
- Exhibit 19: Bargaining power of suppliers - Impact of key factors in 2021 and 2026
- 4.4 Threat of new entrants
- Exhibit 20: Threat of new entrants - Impact of key factors in 2021 and 2026
- 4.5 Threat of substitutes
- Exhibit 21: Threat of substitutes - Impact of key factors in 2021 and 2026
- 4.6 Threat of rivalry
- Exhibit 22: Threat of rivalry - Impact of key factors in 2021 and 2026
- 4.7 Market condition
- Exhibit 23: Chart on Market condition - Five forces 2021 and 2026
5. Market Segmentation by Application
- 5.1 Market segments
- Exhibit 24: Chart on Application - Market share 2021-2026 (%)
- Exhibit 25: Data Table on Application - Market share 2021-2026 (%)
- 5.2 Comparison by Application
- Exhibit 26: Chart on Comparison by Application
- Exhibit 27: Data Table on Comparison by Application
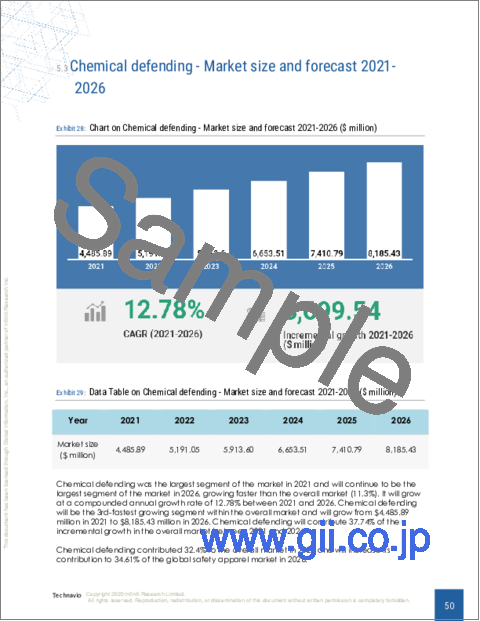
- 5.3 Chemical defending - Market size and forecast 2021-2026
- Exhibit 28: Chart on Chemical defending - Market size and forecast 2021-2026 ($ million)
- Exhibit 29: Data Table on Chemical defending - Market size and forecast 2021-2026 ($ million)
- Exhibit 30: Chart on Chemical defending - Year-over-year growth 2021-2026 (%)
- Exhibit 31: Data Table on Chemical defending - Year-over-year growth 2021-2026 (%)
- 5.4 Flame retardant - Market size and forecast 2021-2026
- Exhibit 32: Chart on Flame retardant - Market size and forecast 2021-2026 ($ million)
- Exhibit 33: Data Table on Flame retardant - Market size and forecast 2021-2026 ($ million)
- Exhibit 34: Chart on Flame retardant - Year-over-year growth 2021-2026 (%)
- Exhibit 35: Data Table on Flame retardant - Year-over-year growth 2021-2026 (%)
- 5.5 Mechanical - Market size and forecast 2021-2026
- Exhibit 36: Chart on Mechanical - Market size and forecast 2021-2026 ($ million)
- Exhibit 37: Data Table on Mechanical - Market size and forecast 2021-2026 ($ million)
- Exhibit 38: Chart on Mechanical - Year-over-year growth 2021-2026 (%)
- Exhibit 39: Data Table on Mechanical - Year-over-year growth 2021-2026 (%)
- 5.6 High visibility - Market size and forecast 2021-2026
- Exhibit 40: Chart on High visibility - Market size and forecast 2021-2026 ($ million)
- Exhibit 41: Data Table on High visibility - Market size and forecast 2021-2026 ($ million)
- Exhibit 42: Chart on High visibility - Year-over-year growth 2021-2026 (%)
- Exhibit 43: Data Table on High visibility - Year-over-year growth 2021-2026 (%)
- 5.7 Others - Market size and forecast 2021-2026
- Exhibit 44: Chart on Others - Market size and forecast 2021-2026 ($ million)
- Exhibit 45: Data Table on Others - Market size and forecast 2021-2026 ($ million)
- Exhibit 46: Chart on Others - Year-over-year growth 2021-2026 (%)
- Exhibit 47: Data Table on Others - Year-over-year growth 2021-2026 (%)
- 5.8 Market opportunity by Application
- Exhibit 48: Market opportunity by Application ($ million)
6. Customer landscape
- Technavio's customer landscape matrix comparing Drivers or price sensitivity, Adoption lifecycle, importance in customer price basket, Adoption rate and Key purchase criteria
- 6.1 Customer landscape overview
- Exhibit 49: Analysis of price sensitivity, lifecycle, customer purchase basket, adoption rates, and purchase criteria
7. Geographic Landscape
- 7.1 Geographic segmentation
- Exhibit 50: Chart on Market share By Geographical Landscape 2021-2026 (%)
- Exhibit 51: Data Table on Market share By Geographical Landscape 2021-2026 (%)
- 7.2 Geographic comparison
- Exhibit 52: Chart on Geographic comparison
- Exhibit 53: Data Table on Geographic comparison
- 7.3 APAC - Market size and forecast 2021-2026
- Exhibit 54: Chart on APAC - Market size and forecast 2021-2026 ($ million)
- Exhibit 55: Data Table on APAC- Market size and forecast 2021-2026 ($ million)
- Exhibit 56: Chart on APAC- Year-over-year growth 2021-2026 (%)
- Exhibit 57: Data Table on APAC- Year-over-year growth 2021-2026 (%)
- 7.4 North America - Market size and forecast 2021-2026
- Exhibit 58: Chart on North America - Market size and forecast 2021-2026 ($ million)
- Exhibit 59: Data Table on North America - Market size and forecast 2021-2026 ($ million)
- Exhibit 60: Chart on North America - Year-over-year growth 2021-2026 (%)
- Exhibit 61: Data Table on North America - Year-over-year growth 2021-2026 (%)
- 7.5 Europe - Market size and forecast 2021-2026
- Exhibit 62: Chart on Europe- Market size and forecast 2021-2026 ($ million)
- Exhibit 63: Data Table on Europe- Market size and forecast 2021-2026 ($ million)
- Exhibit 64: Chart on Europe- Year-over-year growth 2021-2026 (%)
- Exhibit 65: Data Table on Europe- Year-over-year growth 2021-2026 (%)
- 7.6 South America - Market size and forecast 2021-2026
- Exhibit 66: Chart on South America - Market size and forecast 2021-2026 ($ million)
- Exhibit 67: Data Table on South America - Market size and forecast 2021-2026 ($ million)
- Exhibit 68: Chart on South America - Year-over-year growth 2021-2026 (%)
- Exhibit 69: Data Table on South America - Year-over-year growth 2021-2026 (%)
- 7.7 Middle East and Africa - Market size and forecast 2021-2026
- Exhibit 70: Chart on Middle East and Africa - Market size and forecast 2021-2026 ($ million)
- Exhibit 71: Data Table on Middle East and Africa - Market size and forecast 2021-2026 ($ million)
- Exhibit 72: Chart on Middle East and Africa - Year-over-year growth 2021-2026 (%)
- Exhibit 73: Data Table on Middle East and Africa - Year-over-year growth 2021-2026 (%)
- 7.8 US - Market size and forecast 2021-2026
- Exhibit 74: Chart on US - Market size and forecast 2021-2026 ($ million)
- Exhibit 75: Data Table on US - Market size and forecast 2021-2026 ($ million)
- Exhibit 76: Chart on US - Year-over-year growth 2021-2026 (%)
- Exhibit 77: Data Table on US - Year-over-year growth 2021-2026 (%)
- 7.9 China - Market size and forecast 2021-2026
- Exhibit 78: Chart on China - Market size and forecast 2021-2026 ($ million)
- Exhibit 79: Data Table on China- Market size and forecast 2021-2026 ($ million)
- Exhibit 80: Chart on China- Year-over-year growth 2021-2026 (%)
- Exhibit 81: Data Table on China- Year-over-year growth 2021-2026 (%)
- 7.10 UK - Market size and forecast 2021-2026
- Exhibit 82: Chart on UK - Market size and forecast 2021-2026 ($ million)
- Exhibit 83: Data Table on UK - Market size and forecast 2021-2026 ($ million)
- Exhibit 84: Chart on UK - Year-over-year growth 2021-2026 (%)
- Exhibit 85: Data Table on UK - Year-over-year growth 2021-2026 (%)
- 7.11 Canada - Market size and forecast 2021-2026
- Exhibit 86: Chart on Canada - Market size and forecast 2021-2026 ($ million)
- Exhibit 87: Data Table on Canada - Market size and forecast 2021-2026 ($ million)
- Exhibit 88: Chart on Canada - Year-over-year growth 2021-2026 (%)
- Exhibit 89: Data Table on Canada - Year-over-year growth 2021-2026 (%)
- 7.13 Market opportunity By Geographical Landscape
- Exhibit 90: Market opportunity By Geographical Landscape ($ million)
8. Drivers, Challenges, and Trends
- 8.1 Market drivers
- 8.1.1 High emphasis on customization and quality of safety apparel
- 8.1.2 Flourishing construction and manufacturing industries in APAC
- 8.1.3 Implementation of regulations by agencies like OSHA
- 8.2 Market challenges
- 8.2.1 Increase in the cost of raw materials impacting the supply chain
- 8.2.2 Rapid product innovations impacting the sales of existing safety apparel
- 8.2.3 COVID-19 impact on the oil and gas industry
- 8.3 Impact of drivers and challenges
- Exhibit 91: Impact of drivers and challenges in 2021 and 2026
- 8.4 Market trends
- 8.4.1 Implementation of smart and wearable technology
- 8.4.2 Mergers and acquisitions leading to a wider market reach
- 8.4.3 Growing preference for online sales channels
9. Vendor Landscape
- 9.1 Overview
- 9.2 Vendor landscape
- Exhibit 92: Overview on Criticality of inputs and Factors of differentiation
- 9.3 Landscape disruption
- Exhibit 93: Overview on factors of disruption
- 9.4 Industry risks
- Exhibit 94: Impact of key risks on business
10. Vendor Analysis
- 10.1 Vendors covered
- Exhibit 95: Vendors covered
- 10.2 Market positioning of vendors
- Exhibit 96: Matrix on vendor position and classification
- 10.3 3M Corp
- Exhibit 97: 3M Corp - Overview
- Exhibit 98: 3M Corp - Business segments
- Exhibit 99: Alps Alpine Co. Ltd. - Key news
- Exhibit 100: 3M Corp - Key offerings
- Exhibit 101: 3M Corp - Segment focus
- 10.4 Ansell Ltd.
- Exhibit 102: Ansell Ltd. - Overview
- Exhibit 103: Ansell Ltd. - Business segments
- Exhibit 104: Ansell Ltd. - Key news
- Exhibit 105: Ansell Ltd. - Key offerings
- Exhibit 106: Ansell Ltd. - Segment focus
- 10.5 Ballyclare Ltd.
- Exhibit 107: Ballyclare Ltd. - Overview
- Exhibit 108: Ballyclare Ltd. - Product / Service
- Exhibit 109: Ballyclare Ltd. - Key offerings
- 10.6 Delta Plus Group
- Exhibit 110: Delta Plus Group - Overview
- Exhibit 111: Delta Plus Group - Business segments
- Exhibit 112: Delta Plus Group - Key offerings
- Exhibit 113: Delta Plus Group - Segment focus
- 10.7 DuPont de Nemours Inc.
- Exhibit 114: DuPont de Nemours Inc. - Overview
- Exhibit 115: DuPont de Nemours Inc. - Business segments
- Exhibit 116: DuPont de Nemours Inc. - Key offerings
- Exhibit 117: DuPont de Nemours Inc. - Segment focus
- 10.8 Honeywell International Inc.
- Exhibit 118: Honeywell International Inc. - Overview
- Exhibit 119: Honeywell International Inc. - Business segments
- Exhibit 120: Honeywell International Inc. - Key news
- Exhibit 121: Honeywell International Inc. - Key offerings
- Exhibit 122: Honeywell International Inc. - Segment focus
- 10.9 Kimberly Clark Corp.
- Exhibit 123: Kimberly Clark Corp. - Overview
- Exhibit 124: Kimberly Clark Corp. - Business segments
- Exhibit 125: Kimberly Clark Corp. - Key news
- Exhibit 126: Kimberly Clark Corp. - Key offerings
- Exhibit 127: Kimberly Clark Corp. - Segment focus