|
|
市場調査レポート
商品コード
1660783
オートクレーブの世界市場(2025年~2029年)Global Autoclave Market 2025-2029 |
||||||
|
|||||||
カスタマイズ可能
|
|||||||


| オートクレーブの世界市場(2025年~2029年) |
|
出版日: 2025年02月14日
発行: TechNavio
ページ情報: 英文 240 Pages
納期: 即納可能
|

全表示
- 概要
- 目次
世界のオートクレーブの市場規模は、2024年~2029年に7億3,740万米ドルに達し、予測期間中のCAGRは6.9%で成長すると予測されます。
当レポートでは、オートクレーブ市場の全体的な分析、市場規模・予測、動向、成長促進要因、課題、約25のベンダーを網羅したベンダー分析などを掲載しています。
当レポートは、現在の市場シナリオ、最新動向と促進要因、市場環境全体に関する最新分析を提供しています。市場は、医療機器の滅菌と連動した外科手術の増加、HAI(医療関連感染)予防のためのオートクレーブ機器に対する需要の高まり、ヘルスケア施設における廃棄物管理のニーズの高まりによって牽引されています。
| 市場範囲 | |
|---|---|
| 基準年 | 2025年 |
| 終了年 | 2029年 |
| 予測期間 | 2025年~2029年 |
| 成長モメンタム | 加速 |
| 前年比2025年 | 6.4% |
| CAGR | 6.9% |
| 増分額 | 7億3,740万米ドル |
本調査は、業界の主要参入企業からのインプットを含め、一次情報と二次情報を客観的に組み合わせて実施しました。レポートには、主要企業の分析に加え、包括的な市場規模データ、地域分析によるセグメント、ベンダー情勢が含まれています。レポートには実績データと予測データがあります。
本調査では、オートクレーブの技術的進歩が、今後数年間のオートクレーブ市場の成長を促進する主要な理由の1つであると特定しています。また、ヘルスケア支出の増加とオートクレーブにおけるロボット工学の採用は、市場の大きな需要につながります。
目次
第1章 エグゼクティブサマリー
- 市場概要
第2章 Technavioの分析
- 価格感度・ライフサイクル・顧客購入バスケット・採用率・購入基準の分析
- インプットの重要性と差別化の要因
- ディスラプションの要因
- 促進要因と課題の影響
第3章 市場情勢
- 市場エコシステム
- 市場の特徴
- バリューチェーン分析
第4章 市場規模
- 市場の定義
- 市場セグメント分析
- 市場規模(2024年)
- 市場の見通し(2024年~2029年)
第5章 市場規模実績
- オートクレーブの世界市場(2019年~2023年)
- タイプセグメント分析(2019年~2023年)
- エンドユーザーセグメント分析(2019年~2023年)
- 材料セグメント分析(2019年~2023年)
- 用途セグメント分析(2019年~2023年)
- 地域セグメント分析(2019年~2023年)
- 国セグメント分析(2019年~2023年)
第6章 定性分析
- AIの影響:オートクレーブの世界市場
第7章 ファイブフォース分析
- ファイブフォースの要約
- 買い手の交渉力
- 供給企業の交渉力
- 新規参入業者の脅威
- 代替品の脅威
- 競争の脅威
- 市況
第8章 市場セグメンテーション:タイプ別
- 市場セグメント
- 比較:タイプ別
- 垂直オートクレーブ:市場規模と予測(2024年~2029年)
- 水平オートクレーブ:市場規模と予測(2024年~2029年)
- その他:市場規模と予測(2024年~2029年)
- 市場機会:タイプ別
第9章 市場セグメンテーション:エンドユーザー別
- 市場セグメント
- 比較:エンドユーザー別
- ヘルスケア施設・診断研究所:市場規模と予測(2024年~2029年)
- 製薬バイオテクノロジー・医療機器企業:市場規模と予測(2024年~2029年)
- 学術研究機関:市場規模と予測(2024年~2029年)
- 市場機会:エンドユーザー別
第10章 市場セグメンテーション:材料別
- 市場セグメント
- 比較:材料別
- ステンレス鋼:市場規模と予測(2024年~2029年)
- 銅:市場規模と予測(2024年~2029年)
- 市場機会:材料別
第11章 市場セグメンテーション:用途別
- 市場セグメント
- 比較:用途別
- 医療:市場規模と予測(2024年~2029年)
- 製薬:市場規模と予測(2024年~2029年)
- 歯科:市場規模と予測(2024年~2029年)
- 研究室:市場規模と予測(2024年~2029年)
- 食品・飲料:市場規模と予測(2024年~2029年)
- 市場機会:用途別
第12章 顧客情勢
- 顧客情勢の概要
第13章 地域別情勢
- 地域別セグメンテーション
- 地域別比較
- 北米:市場規模と予測(2024年~2029年)
- 欧州:市場規模と予測(2024年~2029年)
- アジア:市場規模と予測(2024年~2029年)
- 世界のその他の地域:市場規模と予測(2024年~2029年)
- 米国:市場規模と予測(2024年~2029年)
- ドイツ:市場規模と予測(2024年~2029年)
- カナダ:市場規模と予測(2024年~2029年)
- 英国:市場規模と予測(2024年~2029年)
- 中国:市場規模と予測(2024年~2029年)
- フランス:市場規模と予測(2024年~2029年)
- 日本:市場規模と予測(2024年~2029年)
- イタリア:市場規模と予測(2024年~2029年)
- インド:市場規模と予測(2024年~2029年)
- 韓国:市場規模と予測(2024年~2029年)
- 市場機会:地域情勢別
第14章 促進要因・課題・機会・抑制要因
- 市場促進要因
- 市場の課題
- 促進要因と課題の影響
- 市場の機会・抑制要因
第15章 競合情勢
- 概要
- 競合情勢
- ディスラプションの状況
- 業界のリスク
第16章 競合分析
- 企業プロファイル
- 企業ランキング指数
- 企業の市場ポジショニング
- ANTONIO MATACHANA SA
- Astell Scientific
- Benchmark Scientific Inc.
- Celitron Medical Technologies Kft.
- De Lama Spa
- Fedegari Autoclavi Spa
- Getinge AB
- Johnson and Johnson Services Inc.
- LTE Scientific Ltd.
- MELAG Medizintechnik GmbH and Co. KG
- PHC Holdings Corp.
- STERIS plc
- Tuttnauer Israel Ltd.
- Yamato Scientific Co. Ltd.
- ZIRBUS technology GmbH
第17章 付録
The autoclave market is forecasted to grow by USD 737.4 million during 2024-2029, accelerating at a CAGR of 6.9% during the forecast period. The report on the autoclave market provides a holistic analysis, market size and forecast, trends, growth drivers, and challenges, as well as vendor analysis covering around 25 vendors.
The report offers an up-to-date analysis regarding the current market scenario, the latest trends and drivers, and the overall market environment. The market is driven by increasing surgical procedures coupled with sterilization of medical devices, growing demand for autoclave equipment to prevent hais, and increasing need for waste management in healthcare facilities.
| Market Scope | |
|---|---|
| Base Year | 2025 |
| End Year | 2029 |
| Series Year | 2025-2029 |
| Growth Momentum | Accelerate |
| YOY 2025 | 6.4% |
| CAGR | 6.9% |
| Incremental Value | $737.4 mn |
The study was conducted using an objective combination of primary and secondary information including inputs from key participants in the industry. The report contains a comprehensive market size data, segment with regional analysis and vendor landscape in addition to an analysis of the key companies. Reports have historic and forecast data.
Technavio's autoclave market is segmented as below:
By Type
- Vertical autoclaves
- Horizontal autoclaves
- Others
By End-user
- Healthcare facilities and diagnostic laboratories
- Pharmaceutical biotechnology and medical device companies
- Academic and research institutes
By Material
- Stainless steel
- Copper
By Application
- Medical
- Pharmaceutical
- Dental
- Laboratory
- Food and beverage
By Geographical Landscape
- North America
- Europe
- Asia
- Rest of World (ROW)
This study identifies the technological advances in autoclaves as one of the prime reasons driving the autoclave market growth during the next few years. Also, increasing healthcare spending and adoption of robotics in autoclaving will lead to sizable demand in the market.
The report on the autoclave market covers the following areas:
- Autoclave Market sizing
- Autoclave Market forecast
- Autoclave Market industry analysis
The robust vendor analysis is designed to help clients improve their market position, and in line with this, this report provides a detailed analysis of several leading autoclave market vendors that include ANTONIO MATACHANA SA, Astell Scientific, Azbil Corp., Benchmark Scientific Inc., Celitron Medical Technologies Kft., De Lama Spa, Fedegari Autoclavi Spa, Getinge AB, Johnson and Johnson Services Inc., LTE Scientific Ltd., MELAG Medizintechnik GmbH and Co. KG, Metall Zug AG, PHC Holdings Corp., Rodwell Engineering Group Ltd., SAKURA SEIKI Co. Ltd., Stahlbau engineering gmbh, STERIS PLC, Tuttnauer Israel Ltd., Yamato Scientific Co. Ltd., and ZIRBUS technology GmbH. Also, the autoclave market analysis report includes information on upcoming trends and challenges that will influence market growth. This is to help companies strategize and leverage all forthcoming growth opportunities.
The publisher presents a detailed picture of the market by the way of study, synthesis, and summation of data from multiple sources by an analysis of key parameters such as profit, pricing, competition, and promotions. It presents various market facets by identifying the key industry influencers. The data presented is comprehensive, reliable, and a result of extensive primary and secondary research. The market research reports provide a complete competitive landscape and an in-depth vendor selection methodology and analysis using qualitative and quantitative research to forecast accurate market growth.
Table of Contents
1 Executive Summary
- 1.1 Market overview
- Executive Summary - Chart on Market Overview
- Executive Summary - Data Table on Market Overview
- Executive Summary - Chart on Global Market Characteristics
- Executive Summary - Chart on Market By Geographical Landscape
- Executive Summary - Chart on Market Segmentation by Type
- Executive Summary - Chart on Market Segmentation by End-user
- Executive Summary - Chart on Market Segmentation by Material
- Executive Summary - Chart on Market Segmentation by Application
- Executive Summary - Chart on Incremental Growth
- Executive Summary - Data Table on Incremental Growth
- Executive Summary - Chart on Company Market Positioning
2 Technavio Analysis
- 2.1 Analysis of price sensitivity, lifecycle, customer purchase basket, adoption rates, and purchase criteria
- Analysis of price sensitivity, lifecycle, customer purchase basket, adoption rates, and purchase criteria
- 2.2 Criticality of inputs and Factors of differentiation
- Overview on criticality of inputs and factors of differentiation
- 2.3 Factors of disruption
- Overview on factors of disruption
- 2.4 Impact of drivers and challenges
- Impact of drivers and challenges in 2024 and 2029
3 Market Landscape
- 3.1 Market ecosystem
- Parent Market
- Data Table on - Parent Market
- 3.2 Market characteristics
- Market characteristics analysis
- 3.3 Value chain analysis
- Value chain analysis
4 Market Sizing
- 4.1 Market definition
- Offerings of companies included in the market definition
- 4.2 Market segment analysis
- Market segments
- 4.3 Market size 2024
- 4.4 Market outlook: Forecast for 2024-2029
- Chart on Global - Market size and forecast 2024-2029 ($ million)
- Data Table on Global - Market size and forecast 2024-2029 ($ million)
- Chart on Global Market: Year-over-year growth 2024-2029 (%)
- Data Table on Global Market: Year-over-year growth 2024-2029 (%)
5 Historic Market Size
- 5.1 Global Autoclave Market 2019 - 2023
- Historic Market Size - Data Table on Global Autoclave Market 2019 - 2023 ($ million)
- 5.2 Type segment analysis 2019 - 2023
- Historic Market Size - Type Segment 2019 - 2023 ($ million)
- 5.3 End-user segment analysis 2019 - 2023
- Historic Market Size - End-user Segment 2019 - 2023 ($ million)
- 5.4 Material segment analysis 2019 - 2023
- Historic Market Size - Material Segment 2019 - 2023 ($ million)
- 5.5 Application segment analysis 2019 - 2023
- Historic Market Size - Application Segment 2019 - 2023 ($ million)
- 5.6 Geography segment analysis 2019 - 2023
- Historic Market Size - Geography Segment 2019 - 2023 ($ million)
- 5.7 Country segment analysis 2019 - 2023
- Historic Market Size - Country Segment 2019 - 2023 ($ million)
6 Qualitative Analysis
- 6.1 Impact of AI on the global autoclave market
7 Five Forces Analysis
- 7.1 Five forces summary
- Five forces analysis - Comparison between 2024 and 2029
- 7.2 Bargaining power of buyers
- Bargaining power of buyers - Impact of key factors 2024 and 2029
- 7.3 Bargaining power of suppliers
- Bargaining power of suppliers - Impact of key factors in 2024 and 2029
- 7.4 Threat of new entrants
- Threat of new entrants - Impact of key factors in 2024 and 2029
- 7.5 Threat of substitutes
- Threat of substitutes - Impact of key factors in 2024 and 2029
- 7.6 Threat of rivalry
- Threat of rivalry - Impact of key factors in 2024 and 2029
- 7.7 Market condition
- Chart on Market condition - Five forces 2024 and 2029
8 Market Segmentation by Type
- 8.1 Market segments
- Chart on Type - Market share 2024-2029 (%)
- Data Table on Type - Market share 2024-2029 (%)
- 8.2 Comparison by Type
- Chart on Comparison by Type
- Data Table on Comparison by Type
- 8.3 Vertical autoclaves - Market size and forecast 2024-2029
- Chart on Vertical autoclaves - Market size and forecast 2024-2029 ($ million)
- Data Table on Vertical autoclaves - Market size and forecast 2024-2029 ($ million)
- Chart on Vertical autoclaves - Year-over-year growth 2024-2029 (%)
- Data Table on Vertical autoclaves - Year-over-year growth 2024-2029 (%)
- 8.4 Horizontal autoclaves - Market size and forecast 2024-2029
- Chart on Horizontal autoclaves - Market size and forecast 2024-2029 ($ million)
- Data Table on Horizontal autoclaves - Market size and forecast 2024-2029 ($ million)
- Chart on Horizontal autoclaves - Year-over-year growth 2024-2029 (%)
- Data Table on Horizontal autoclaves - Year-over-year growth 2024-2029 (%)
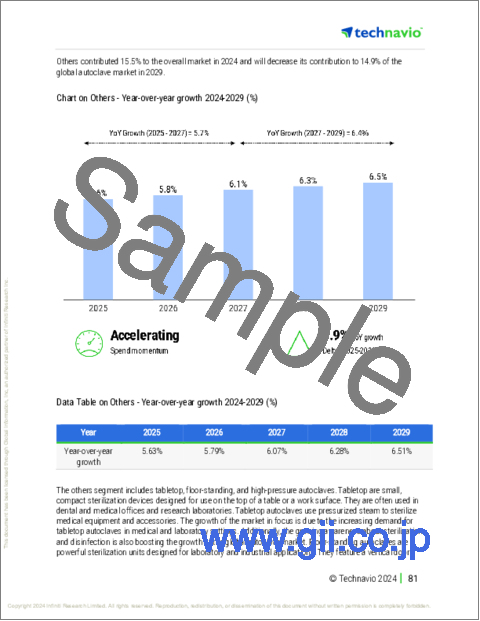
- 8.5 Others - Market size and forecast 2024-2029
- Chart on Others - Market size and forecast 2024-2029 ($ million)
- Data Table on Others - Market size and forecast 2024-2029 ($ million)
- Chart on Others - Year-over-year growth 2024-2029 (%)
- Data Table on Others - Year-over-year growth 2024-2029 (%)
- 8.6 Market opportunity by Type
- Market opportunity by Type ($ million)
- Data Table on Market opportunity by Type ($ million)
9 Market Segmentation by End-user
- 9.1 Market segments
- Chart on End-user - Market share 2024-2029 (%)
- Data Table on End-user - Market share 2024-2029 (%)
- 9.2 Comparison by End-user
- Chart on Comparison by End-user
- Data Table on Comparison by End-user
- 9.3 Healthcare facilities and diagnostic laboratories - Market size and forecast 2024-2029
- Chart on Healthcare facilities and diagnostic laboratories - Market size and forecast 2024-2029 ($ million)
- Data Table on Healthcare facilities and diagnostic laboratories - Market size and forecast 2024-2029 ($ million)
- Chart on Healthcare facilities and diagnostic laboratories - Year-over-year growth 2024-2029 (%)
- Data Table on Healthcare facilities and diagnostic laboratories - Year-over-year growth 2024-2029 (%)
- 9.4 Pharmaceutical biotechnology and medical device companies - Market size and forecast 2024-2029
- Chart on Pharmaceutical biotechnology and medical device companies - Market size and forecast 2024-2029 ($ million)
- Data Table on Pharmaceutical biotechnology and medical device companies - Market size and forecast 2024-2029 ($ million)
- Chart on Pharmaceutical biotechnology and medical device companies - Year-over-year growth 2024-2029 (%)
- Data Table on Pharmaceutical biotechnology and medical device companies - Year-over-year growth 2024-2029 (%)
- 9.5 Academic and research institutes - Market size and forecast 2024-2029
- Chart on Academic and research institutes - Market size and forecast 2024-2029 ($ million)
- Data Table on Academic and research institutes - Market size and forecast 2024-2029 ($ million)
- Chart on Academic and research institutes - Year-over-year growth 2024-2029 (%)
- Data Table on Academic and research institutes - Year-over-year growth 2024-2029 (%)
- 9.6 Market opportunity by End-user
- Market opportunity by End-user ($ million)
- Data Table on Market opportunity by End-user ($ million)
10 Market Segmentation by Material
- 10.1 Market segments
- Chart on Material - Market share 2024-2029 (%)
- Data Table on Material - Market share 2024-2029 (%)
- 10.2 Comparison by Material
- Chart on Comparison by Material
- Data Table on Comparison by Material
- 10.3 Stainless steel - Market size and forecast 2024-2029
- Chart on Stainless steel - Market size and forecast 2024-2029 ($ million)
- Data Table on Stainless steel - Market size and forecast 2024-2029 ($ million)
- Chart on Stainless steel - Year-over-year growth 2024-2029 (%)
- Data Table on Stainless steel - Year-over-year growth 2024-2029 (%)
- 10.4 Copper - Market size and forecast 2024-2029
- Chart on Copper - Market size and forecast 2024-2029 ($ million)
- Data Table on Copper - Market size and forecast 2024-2029 ($ million)
- Chart on Copper - Year-over-year growth 2024-2029 (%)
- Data Table on Copper - Year-over-year growth 2024-2029 (%)
- 10.5 Market opportunity by Material
- Market opportunity by Material ($ million)
- Data Table on Market opportunity by Material ($ million)
11 Market Segmentation by Application
- 11.1 Market segments
- Chart on Application - Market share 2024-2029 (%)
- Data Table on Application - Market share 2024-2029 (%)
- 11.2 Comparison by Application
- Chart on Comparison by Application
- Data Table on Comparison by Application
- 11.3 Medical - Market size and forecast 2024-2029
- Chart on Medical - Market size and forecast 2024-2029 ($ million)
- Data Table on Medical - Market size and forecast 2024-2029 ($ million)
- Chart on Medical - Year-over-year growth 2024-2029 (%)
- Data Table on Medical - Year-over-year growth 2024-2029 (%)
- 11.4 Pharmaceutical - Market size and forecast 2024-2029
- Chart on Pharmaceutical - Market size and forecast 2024-2029 ($ million)
- Data Table on Pharmaceutical - Market size and forecast 2024-2029 ($ million)
- Chart on Pharmaceutical - Year-over-year growth 2024-2029 (%)
- Data Table on Pharmaceutical - Year-over-year growth 2024-2029 (%)
- 11.5 Dental - Market size and forecast 2024-2029
- Chart on Dental - Market size and forecast 2024-2029 ($ million)
- Data Table on Dental - Market size and forecast 2024-2029 ($ million)
- Chart on Dental - Year-over-year growth 2024-2029 (%)
- Data Table on Dental - Year-over-year growth 2024-2029 (%)
- 11.6 Laboratory - Market size and forecast 2024-2029
- Chart on Laboratory - Market size and forecast 2024-2029 ($ million)
- Data Table on Laboratory - Market size and forecast 2024-2029 ($ million)
- Chart on Laboratory - Year-over-year growth 2024-2029 (%)
- Data Table on Laboratory - Year-over-year growth 2024-2029 (%)
- 11.7 Food and beverage - Market size and forecast 2024-2029
- Chart on Food and beverage - Market size and forecast 2024-2029 ($ million)
- Data Table on Food and beverage - Market size and forecast 2024-2029 ($ million)
- Chart on Food and beverage - Year-over-year growth 2024-2029 (%)
- Data Table on Food and beverage - Year-over-year growth 2024-2029 (%)
- 11.8 Market opportunity by Application
- Market opportunity by Application ($ million)
- Data Table on Market opportunity by Application ($ million)
12 Customer Landscape
- 12.1 Customer landscape overview
- Analysis of price sensitivity, lifecycle, customer purchase basket, adoption rates, and purchase criteria
13 Geographic Landscape
- 13.1 Geographic segmentation
- Chart on Market share By Geographical Landscape 2024-2029 (%)
- Data Table on Market share By Geographical Landscape 2024-2029 (%)
- 13.2 Geographic comparison
- Chart on Geographic comparison
- Data Table on Geographic comparison
- 13.3 North America - Market size and forecast 2024-2029
- Chart on North America - Market size and forecast 2024-2029 ($ million)
- Data Table on North America - Market size and forecast 2024-2029 ($ million)
- Chart on North America - Year-over-year growth 2024-2029 (%)
- Data Table on North America - Year-over-year growth 2024-2029 (%)
- 13.4 Europe - Market size and forecast 2024-2029
- Chart on Europe - Market size and forecast 2024-2029 ($ million)
- Data Table on Europe - Market size and forecast 2024-2029 ($ million)
- Chart on Europe - Year-over-year growth 2024-2029 (%)
- Data Table on Europe - Year-over-year growth 2024-2029 (%)
- 13.5 Asia - Market size and forecast 2024-2029
- Chart on Asia - Market size and forecast 2024-2029 ($ million)
- Data Table on Asia - Market size and forecast 2024-2029 ($ million)
- Chart on Asia - Year-over-year growth 2024-2029 (%)
- Data Table on Asia - Year-over-year growth 2024-2029 (%)
- 13.6 Rest of World (ROW) - Market size and forecast 2024-2029
- Chart on Rest of World (ROW) - Market size and forecast 2024-2029 ($ million)
- Data Table on Rest of World (ROW) - Market size and forecast 2024-2029 ($ million)
- Chart on Rest of World (ROW) - Year-over-year growth 2024-2029 (%)
- Data Table on Rest of World (ROW) - Year-over-year growth 2024-2029 (%)
- 13.7 US - Market size and forecast 2024-2029
- Chart on US - Market size and forecast 2024-2029 ($ million)
- Data Table on US - Market size and forecast 2024-2029 ($ million)
- Chart on US - Year-over-year growth 2024-2029 (%)
- Data Table on US - Year-over-year growth 2024-2029 (%)
- 13.8 Germany - Market size and forecast 2024-2029
- Chart on Germany - Market size and forecast 2024-2029 ($ million)
- Data Table on Germany - Market size and forecast 2024-2029 ($ million)
- Chart on Germany - Year-over-year growth 2024-2029 (%)
- Data Table on Germany - Year-over-year growth 2024-2029 (%)
- 13.9 Canada - Market size and forecast 2024-2029
- Chart on Canada - Market size and forecast 2024-2029 ($ million)
- Data Table on Canada - Market size and forecast 2024-2029 ($ million)
- Chart on Canada - Year-over-year growth 2024-2029 (%)
- Data Table on Canada - Year-over-year growth 2024-2029 (%)
- 13.10 UK - Market size and forecast 2024-2029
- Chart on UK - Market size and forecast 2024-2029 ($ million)
- Data Table on UK - Market size and forecast 2024-2029 ($ million)
- Chart on UK - Year-over-year growth 2024-2029 (%)
- Data Table on UK - Year-over-year growth 2024-2029 (%)
- 13.11 China - Market size and forecast 2024-2029
- Chart on China - Market size and forecast 2024-2029 ($ million)
- Data Table on China - Market size and forecast 2024-2029 ($ million)
- Chart on China - Year-over-year growth 2024-2029 (%)
- Data Table on China - Year-over-year growth 2024-2029 (%)
- 13.12 France - Market size and forecast 2024-2029
- Chart on France - Market size and forecast 2024-2029 ($ million)
- Data Table on France - Market size and forecast 2024-2029 ($ million)
- Chart on France - Year-over-year growth 2024-2029 (%)
- Data Table on France - Year-over-year growth 2024-2029 (%)
- 13.13 Japan - Market size and forecast 2024-2029
- Chart on Japan - Market size and forecast 2024-2029 ($ million)
- Data Table on Japan - Market size and forecast 2024-2029 ($ million)
- Chart on Japan - Year-over-year growth 2024-2029 (%)
- Data Table on Japan - Year-over-year growth 2024-2029 (%)
- 13.14 Italy - Market size and forecast 2024-2029
- Chart on Italy - Market size and forecast 2024-2029 ($ million)
- Data Table on Italy - Market size and forecast 2024-2029 ($ million)
- Chart on Italy - Year-over-year growth 2024-2029 (%)
- Data Table on Italy - Year-over-year growth 2024-2029 (%)
- 13.15 India - Market size and forecast 2024-2029
- Chart on India - Market size and forecast 2024-2029 ($ million)
- Data Table on India - Market size and forecast 2024-2029 ($ million)
- Chart on India - Year-over-year growth 2024-2029 (%)
- Data Table on India - Year-over-year growth 2024-2029 (%)
- 13.16 South Korea - Market size and forecast 2024-2029
- Chart on South Korea - Market size and forecast 2024-2029 ($ million)
- Data Table on South Korea - Market size and forecast 2024-2029 ($ million)
- Chart on South Korea - Year-over-year growth 2024-2029 (%)
- Data Table on South Korea - Year-over-year growth 2024-2029 (%)
- 13.17 Market opportunity By Geographical Landscape
- Market opportunity By Geographical Landscape ($ million)
- Data Tables on Market opportunity By Geographical Landscape ($ million)
14 Drivers, Challenges, and Opportunity/Restraints
- 14.1 Market drivers
- 14.2 Market challenges
- 14.3 Impact of drivers and challenges
- Impact of drivers and challenges in 2024 and 2029
- 14.4 Market opportunities/restraints
15 Competitive Landscape
- 15.1 Overview
- 15.2 Competitive Landscape
- Overview on criticality of inputs and factors of differentiation
- 15.3 Landscape disruption
- Overview on factors of disruption
- 15.4 Industry risks
- Impact of key risks on business
16 Competitive Analysis
- 16.1 Companies profiled
- Companies covered
- 16.2 Company ranking index
- Company ranking index
- 16.3 Market positioning of companies
- Matrix on companies position and classification
- 16.4 ANTONIO MATACHANA SA
- ANTONIO MATACHANA SA - Overview
- ANTONIO MATACHANA SA - Product / Service
- ANTONIO MATACHANA SA - Key offerings
- SWOT
- 16.5 Astell Scientific
- Astell Scientific - Overview
- Astell Scientific - Product / Service
- Astell Scientific - Key offerings
- SWOT
- 16.6 Benchmark Scientific Inc.
- Benchmark Scientific Inc. - Overview
- Benchmark Scientific Inc. - Product / Service
- Benchmark Scientific Inc. - Key offerings
- SWOT
- 16.7 Celitron Medical Technologies Kft.
- Celitron Medical Technologies Kft. - Overview
- Celitron Medical Technologies Kft. - Product / Service
- Celitron Medical Technologies Kft. - Key offerings
- SWOT
- 16.8 De Lama Spa
- De Lama Spa - Overview
- De Lama Spa - Product / Service
- De Lama Spa - Key offerings
- SWOT
- 16.9 Fedegari Autoclavi Spa
- Fedegari Autoclavi Spa - Overview
- Fedegari Autoclavi Spa - Product / Service
- Fedegari Autoclavi Spa - Key offerings
- SWOT
- 16.10 Getinge AB
- Getinge AB - Overview
- Getinge AB - Business segments
- Getinge AB - Key news
- Getinge AB - Key offerings
- Getinge AB - Segment focus
- SWOT
- 16.11 Johnson and Johnson Services Inc.
- Johnson and Johnson Services Inc. - Overview
- Johnson and Johnson Services Inc. - Business segments
- Johnson and Johnson Services Inc. - Key news
- Johnson and Johnson Services Inc. - Key offerings
- Johnson and Johnson Services Inc. - Segment focus
- SWOT
- 16.12 LTE Scientific Ltd.
- LTE Scientific Ltd. - Overview
- LTE Scientific Ltd. - Product / Service
- LTE Scientific Ltd. - Key offerings
- SWOT
- 16.13 MELAG Medizintechnik GmbH and Co. KG
- MELAG Medizintechnik GmbH and Co. KG - Overview
- MELAG Medizintechnik GmbH and Co. KG - Product / Service
- MELAG Medizintechnik GmbH and Co. KG - Key offerings
- SWOT
- 16.14 PHC Holdings Corp.
- PHC Holdings Corp. - Overview
- PHC Holdings Corp. - Business segments
- PHC Holdings Corp. - Key offerings
- PHC Holdings Corp. - Segment focus
- SWOT
- 16.15 STERIS plc
- STERIS plc - Overview
- STERIS plc - Business segments
- STERIS plc - Key news
- STERIS plc - Key offerings
- STERIS plc - Segment focus
- SWOT
- 16.16 Tuttnauer Israel Ltd.
- Tuttnauer Israel Ltd. - Overview
- Tuttnauer Israel Ltd. - Product / Service
- Tuttnauer Israel Ltd. - Key offerings
- SWOT
- 16.17 Yamato Scientific Co. Ltd.
- Yamato Scientific Co. Ltd. - Overview
- Yamato Scientific Co. Ltd. - Product / Service
- Yamato Scientific Co. Ltd. - Key offerings
- SWOT
- 16.18 ZIRBUS technology GmbH
- ZIRBUS technology GmbH - Overview
- ZIRBUS technology GmbH - Product / Service
- ZIRBUS technology GmbH - Key offerings
- SWOT
17 Appendix
- 17.1 Scope of the report
- 17.2 Inclusions and exclusions checklist
- Inclusions checklist
- Exclusions checklist
- 17.3 Currency conversion rates for US$
- Currency conversion rates for US$
- 17.4 Research methodology
- Research methodology
- 17.5 Data procurement
- Information sources
- 17.6 Data validation
- Data validation
- 17.7 Validation techniques employed for market sizing
- Validation techniques employed for market sizing
- 17.8 Data synthesis
- Data synthesis
- 17.9 360 degree market analysis
- 360 degree market analysis
- 17.10 List of abbreviations
- List of abbreviations
