|
|
市場調査レポート
商品コード
1915340
世界のギ酸市場2026-2030年Global Formic Acid Market 2026-2030 |
||||||
|
|||||||
カスタマイズ可能
|
|||||||

| 世界のギ酸市場2026-2030年 |
|
出版日: 2026年01月19日
発行: TechNavio
ページ情報: 英文 303 Pages
納期: 即納可能
|

概要
世界のギ酸市場は、2025年から2030年の間に7億1,350万米ドルの成長が見込まれ、予測期間中のCAGRは6.1%と予測されています。
本報告書では、世界のギ酸市場に関する包括的な分析、市場規模と予測、動向、成長要因、課題に加え、約25社のベンダー分析を提供しております。
本レポートは、現在の市場状況、最新の動向と促進要因、市場環境全般に関する最新の分析を提供します。市場は、農業および飼料用途からの需要増加、皮革・繊維加工における産業用途の拡大、特殊産業用途の成長、化学処理需要によって牽引されています。
本調査は、業界の主要関係者からの情報を含む、一次情報と二次情報の客観的な組み合わせを用いて実施されました。本レポートには、主要企業の分析に加え、包括的な市場規模データ、地域別分析を伴うセグメント、ベンダー情勢が含まれています。レポートには過去データと予測データが掲載されています。
| 市場範囲 | |
|---|---|
| 基準年 | 2026年 |
| 終了年 | 2030年 |
| 予測期間 | 2026-2030 |
| 成長モメンタム | 加速 |
| 前年比2026年 | 5.4% |
| CAGR | 6.1% |
| 増分額 | 7億1,350万米ドル |
本調査では、今後数年間における世界のギ酸市場成長を牽引する主要要因の一つとして、持続可能かつバイオベース生産への移行を挙げております。また、循環型経済と炭素利用の実践、ならびにサプライチェーン管理におけるデジタル化と自動化の統合が、市場において相当な需要を生み出すものと見込まれます。
目次
第1章 エグゼクティブサマリー
第2章 Technavio分析
- 価格・ライフサイクル・顧客購入バスケット・採用率・購入基準の分析
- インプットの重要性と差別化の要因
- 混乱の要因
- 促進要因と課題の影響
第3章 市場情勢
- 市場エコシステム
- 市場の特徴
- バリューチェーン分析
第4章 市場規模
- 市場の定義
- 市場セグメント分析
- 市場規模 2025
- 市場の見通し 2025-2030
第5章 市場規模実績
- 世界のギ酸市場 2020-2024
- 流通チャネルセグメント分析 2020-2024
- エンドユーザーセグメント分析 2020-2024
- グレードタイプセグメント分析 2020-2024
- 地域別セグメント分析 2020-2024
- 国別セグメント分析 2020-2024
第6章 定性分析
- AIが及ぼす影響世界のギ酸市場
第7章 ファイブフォース分析
- ファイブフォースの要約
- 買い手の交渉力
- 供給企業の交渉力
- 新規参入業者の脅威
- 代替品の脅威
- 競争の脅威
- 市況
第8章 市場セグメンテーション:流通チャネル別
- 比較:流通チャネル別
- オフライン
- オンライン
- 市場機会:流通チャネル別
第9章 市場セグメンテーション:エンドユーザー別
- 比較:エンドユーザー別
- 農業および飼料
- 皮革
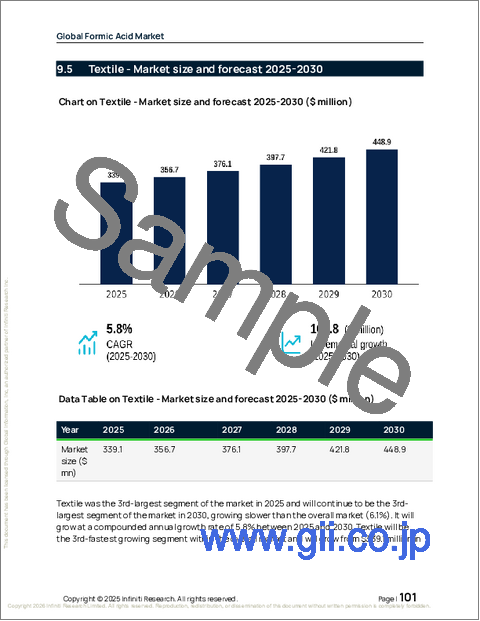
- 繊維産業
- 化学品・医薬品
- その他
- 市場機会:エンドユーザー別
第10章 市場セグメンテーション:グレードタイプ別
- 比較:グレードタイプ別
- 工業用グレード
- 医薬品グレード
- 食品グレード
- 市場機会:グレードタイプ別
第11章 顧客情勢
第12章 地域別情勢
- 地域別セグメンテーション
- 地域別比較
- アジア太平洋
- 中国
- 日本
- インド
- 韓国
- オーストラリア
- インドネシア
- 北米
- 米国
- カナダ
- メキシコ
- 欧州
- ドイツ
- 英国
- フランス
- イタリア
- スペイン
- オランダ
- 中東・アフリカ
- サウジアラビア
- アラブ首長国連邦
- 南アフリカ
- イスラエル
- トルコ
- 南米
- ブラジル
- アルゼンチン
- コロンビア
- 市場機会:地域別
第13章 促進要因・課題・機会
- 市場促進要因
- 市場の課題
- 促進要因と課題の影響
- 市場機会
第14章 競合情勢
- 概要
- 競合情勢
- 混乱の状況
- 業界のリスク
第15章 競合分析
- 企業プロファイル
- 企業ランキング指標
- 企業の市場ポジショニング
- Asahi Kasei Corp.
- BASF SE
- Cellmark AB
- China National Chemical Corp. Ltd.
- Eastman Chemical Co.
- EMCO Dyestuff Pvt. Ltd.
- Hydrite Chemical Co.
- Kemira Oyj
- Luxi Chemical Group Co. Ltd.
- Mudanjiang Fengda Chemical Co. Ltd.
- OXEA GmbH
- Perstorp Holding AB
- Shandong Acid Technology Co. Ltd.
- Thermo Fisher Scientific Inc.
- Tokyo Chemical Co. Ltd.
