|
|
市場調査レポート
商品コード
1515676
ePedigreeソフトウェアの世界市場 2024-2028Global ePedigree software market 2024-2028 |
||||||

|
|||||||
カスタマイズ可能
|
|||||||

| ePedigreeソフトウェアの世界市場 2024-2028 |
|
出版日: 2024年06月11日
発行: TechNavio
ページ情報: 英文 171 Pages
納期: 即納可能
|

全表示
- 概要
- 図表
- 目次
ePedigreeソフトウェア市場は2023-2028年に40億2,390万米ドル、予測期間中のCAGRは18.69%で成長すると予測されています。
当レポートでは、ePedigreeソフトウェア市場の全体的な分析、市場規模・予測、動向、成長促進要因、課題、約25のベンダーを網羅したベンダー分析などを掲載しています。
現在の市場シナリオ、最新動向と促進要因、市場環境全体に関する最新分析を提供しています。市場を牽引しているのは、偽造品対策としてシリアライザビリティに対する要求が高まっていること、技術導入率の上昇と技術の普及、政府規制へのコンプライアンスの確保などです。
| 市場範囲 | |
|---|---|
| 基準年 | 2024 |
| 終了年 | 2028 |
| 予測期間 | 2024-2028 |
| 成長モメンタム | 加速 |
| 前年比2024年 | 16.01% |
| CAGR | 18.69% |
| 増分額 | 40億2,390万米ドル |
本調査では、今後数年間のePedigreeソフトウェア市場成長を牽引する主な要因の1つとして、医薬品サプライチェーンのスマート化に向けたハイテク開拓を挙げています。また、製薬バリューチェーン全体におけるソフトウェアの採用によるデータの爆発的増加や、厳格な世界規制およびコンプライアンス基準の策定も、市場の大きな需要につながります。
目次
第1章 エグゼクティブサマリー
- 市場概要
第2章 市場情勢
- 市場エコシステム
- 市場の特徴
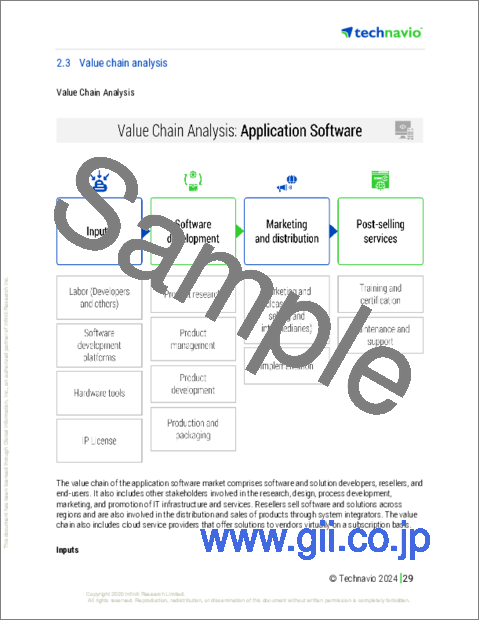
- バリューチェーン分析
第3章 市場規模の評価
- 市場の定義
- 市場セグメント分析
- 市場規模 2023
- 市場の見通し 2023-2028
第4章 市場規模実績
- 世界ePedigreeソフトウェア市場 2018-2022
- 展開別セグメント分析 2018-2022
- エンドユーザー別セグメント分析 2018-2022
- 地域別セグメント分析 2018-2022
- 国別セグメント分析 2018-2022
第5章 ファイブフォース分析
- ファイブフォースの要約
- 買い手の交渉力
- 供給企業の交渉力
- 新規参入業者の脅威
- 代替品の脅威
- 競争の脅威
- 市況
第6章 市場セグメンテーション:展開別
- 市場セグメンテーション
- 比較:展開別
- オンプレミス:市場規模と予測 2023-2028
- クラウド:市場規模と予測 2023-2028
- 市場機会:展開別
第7章 市場セグメンテーション:エンドユーザー別
- 市場セグメンテーション
- 比較:エンドユーザー別
- 大企業:市場規模と予測 2023-2028
- 中小企業:市場規模と予測 2023-2028
- 市場機会:エンドユーザー別
第8章 顧客情勢
- 顧客情勢の概要
第9章 地域別情勢
- 地域別セグメンテーション
- 地域別比較
- 北米:市場規模と予測 2023-2028
- 欧州:市場規模と予測 2023-2028
- アジア太平洋:市場規模と予測 2023-2028
- 南米:市場規模と予測 2023-2028
- 中東・アフリカ:市場規模と予測 2023-2028
- 米国:市場規模と予測 2023-2028
- ドイツ:市場規模と予測 2023-2028
- 日本:市場規模と予測 2023-2028
- フランス:市場規模と予測 2023-2028
- 中国:市場規模と予測 2023-2028
- 市場機会:地域情勢別
第10章 促進要因・課題・機会・抑制要因
- 市場促進要因
- 市場の課題
- 促進要因と課題の影響
- 市場の機会・抑制要因
第11章 競合情勢
- 概要
- 競合情勢
- 混乱の状況
- 業界のリスク
第12章 競合分析
- 企業プロファイル
- 企業の市場ポジショニング
- Altair Engineering Inc.
- ANSYS Inc.
- Antares Vision S.p.A
- Aptean Group of Companies
- Axway Software SA
- Bar Code Integrators Inc.
- Blue Yonder Inc.
- Labeling Systems LLC
- Merit Solutions Inc.
- Microsoft Corp.
- Oracle Corp.
- rfxcel Corp.
- SAP SE
- Siemens AG
- TraceLink Inc.
第13章 付録
Exhibits:
- Exhibits1: Executive Summary - Chart on Market Overview
- Exhibits2: Executive Summary - Data Table on Market Overview
- Exhibits3: Executive Summary - Chart on Global Market Characteristics
- Exhibits4: Executive Summary - Chart on Market By Geographical Landscape
- Exhibits5: Executive Summary - Chart on Market Segmentation by Deployment
- Exhibits6: Executive Summary - Chart on Market Segmentation by End-user
- Exhibits7: Executive Summary - Chart on Incremental Growth
- Exhibits8: Executive Summary - Data Table on Incremental Growth
- Exhibits9: Executive Summary - Chart on Company Market Positioning
- Exhibits10: Parent Market
- Exhibits11: Data Table on - Parent Market
- Exhibits12: Market characteristics analysis
- Exhibits13: Value Chain Analysis
- Exhibits14: Offerings of companies included in the market definition
- Exhibits15: Market segments
- Exhibits16: Chart on Global - Market size and forecast 2023-2028 ($ million)
- Exhibits17: Data Table on Global - Market size and forecast 2023-2028 ($ million)
- Exhibits18: Chart on Global Market: Year-over-year growth 2023-2028 (%)
- Exhibits19: Data Table on Global Market: Year-over-year growth 2023-2028 (%)
- Exhibits20: Historic Market Size - Data Table on Global EPedigree Software Market 2018 - 2022 ($ million)
- Exhibits21: Historic Market Size - Deployment Segment 2018 - 2022 ($ million)
- Exhibits22: Historic Market Size - End-user Segment 2018 - 2022 ($ million)
- Exhibits23: Historic Market Size - Geography Segment 2018 - 2022 ($ million)
- Exhibits24: Historic Market Size - Country Segment 2018 - 2022 ($ million)
- Exhibits25: Five forces analysis - Comparison between 2023 and 2028
- Exhibits26: Bargaining power of buyers - Impact of key factors 2023 and 2028
- Exhibits27: Bargaining power of suppliers - Impact of key factors in 2023 and 2028
- Exhibits28: Threat of new entrants - Impact of key factors in 2023 and 2028
- Exhibits29: Threat of substitutes - Impact of key factors in 2023 and 2028
- Exhibits30: Threat of rivalry - Impact of key factors in 2023 and 2028
- Exhibits31: Chart on Market condition - Five forces 2023 and 2028
- Exhibits32: Chart on Deployment - Market share 2023-2028 (%)
- Exhibits33: Data Table on Deployment - Market share 2023-2028 (%)
- Exhibits34: Chart on Comparison by Deployment
- Exhibits35: Data Table on Comparison by Deployment
- Exhibits36: Chart on On-premises - Market size and forecast 2023-2028 ($ million)
- Exhibits37: Data Table on On-premises - Market size and forecast 2023-2028 ($ million)
- Exhibits38: Chart on On-premises - Year-over-year growth 2023-2028 (%)
- Exhibits39: Data Table on On-premises - Year-over-year growth 2023-2028 (%)
- Exhibits40: Chart on Cloud - Market size and forecast 2023-2028 ($ million)
- Exhibits41: Data Table on Cloud - Market size and forecast 2023-2028 ($ million)
- Exhibits42: Chart on Cloud - Year-over-year growth 2023-2028 (%)
- Exhibits43: Data Table on Cloud - Year-over-year growth 2023-2028 (%)
- Exhibits44: Market opportunity by Deployment ($ million)
- Exhibits45: Data Table on Market opportunity by Deployment ($ million)
- Exhibits46: Chart on End-user - Market share 2023-2028 (%)
- Exhibits47: Data Table on End-user - Market share 2023-2028 (%)
- Exhibits48: Chart on Comparison by End-user
- Exhibits49: Data Table on Comparison by End-user
- Exhibits50: Chart on Large enterprise - Market size and forecast 2023-2028 ($ million)
- Exhibits51: Data Table on Large enterprise - Market size and forecast 2023-2028 ($ million)
- Exhibits52: Chart on Large enterprise - Year-over-year growth 2023-2028 (%)
- Exhibits53: Data Table on Large enterprise - Year-over-year growth 2023-2028 (%)
- Exhibits54: Chart on Small and medium enterprises - Market size and forecast 2023-2028 ($ million)
- Exhibits55: Data Table on Small and medium enterprises - Market size and forecast 2023-2028 ($ million)
- Exhibits56: Chart on Small and medium enterprises - Year-over-year growth 2023-2028 (%)
- Exhibits57: Data Table on Small and medium enterprises - Year-over-year growth 2023-2028 (%)
- Exhibits58: Market opportunity by End-user ($ million)
- Exhibits59: Data Table on Market opportunity by End-user ($ million)
- Exhibits60: Analysis of price sensitivity, lifecycle, customer purchase basket, adoption rates, and purchase criteria
- Exhibits61: Chart on Market share By Geographical Landscape 2023-2028 (%)
- Exhibits62: Data Table on Market share By Geographical Landscape 2023-2028 (%)
- Exhibits63: Chart on Geographic comparison
- Exhibits64: Data Table on Geographic comparison
- Exhibits65: Chart on North America - Market size and forecast 2023-2028 ($ million)
- Exhibits66: Data Table on North America - Market size and forecast 2023-2028 ($ million)
- Exhibits67: Chart on North America - Year-over-year growth 2023-2028 (%)
- Exhibits68: Data Table on North America - Year-over-year growth 2023-2028 (%)
- Exhibits69: Chart on Europe - Market size and forecast 2023-2028 ($ million)
- Exhibits70: Data Table on Europe - Market size and forecast 2023-2028 ($ million)
- Exhibits71: Chart on Europe - Year-over-year growth 2023-2028 (%)
- Exhibits72: Data Table on Europe - Year-over-year growth 2023-2028 (%)
- Exhibits73: Chart on APAC - Market size and forecast 2023-2028 ($ million)
- Exhibits74: Data Table on APAC - Market size and forecast 2023-2028 ($ million)
- Exhibits75: Chart on APAC - Year-over-year growth 2023-2028 (%)
- Exhibits76: Data Table on APAC - Year-over-year growth 2023-2028 (%)
- Exhibits77: Chart on South America - Market size and forecast 2023-2028 ($ million)
- Exhibits78: Data Table on South America - Market size and forecast 2023-2028 ($ million)
- Exhibits79: Chart on South America - Year-over-year growth 2023-2028 (%)
- Exhibits80: Data Table on South America - Year-over-year growth 2023-2028 (%)
- Exhibits81: Chart on Middle East and Africa - Market size and forecast 2023-2028 ($ million)
- Exhibits82: Data Table on Middle East and Africa - Market size and forecast 2023-2028 ($ million)
- Exhibits83: Chart on Middle East and Africa - Year-over-year growth 2023-2028 (%)
- Exhibits84: Data Table on Middle East and Africa - Year-over-year growth 2023-2028 (%)
- Exhibits85: Chart on US - Market size and forecast 2023-2028 ($ million)
- Exhibits86: Data Table on US - Market size and forecast 2023-2028 ($ million)
- Exhibits87: Chart on US - Year-over-year growth 2023-2028 (%)
- Exhibits88: Data Table on US - Year-over-year growth 2023-2028 (%)
- Exhibits89: Chart on Germany - Market size and forecast 2023-2028 ($ million)
- Exhibits90: Data Table on Germany - Market size and forecast 2023-2028 ($ million)
- Exhibits91: Chart on Germany - Year-over-year growth 2023-2028 (%)
- Exhibits92: Data Table on Germany - Year-over-year growth 2023-2028 (%)
- Exhibits93: Chart on Japan - Market size and forecast 2023-2028 ($ million)
- Exhibits94: Data Table on Japan - Market size and forecast 2023-2028 ($ million)
- Exhibits95: Chart on Japan - Year-over-year growth 2023-2028 (%)
- Exhibits96: Data Table on Japan - Year-over-year growth 2023-2028 (%)
- Exhibits97: Chart on France - Market size and forecast 2023-2028 ($ million)
- Exhibits98: Data Table on France - Market size and forecast 2023-2028 ($ million)
- Exhibits99: Chart on France - Year-over-year growth 2023-2028 (%)
- Exhibits100: Data Table on France - Year-over-year growth 2023-2028 (%)
- Exhibits101: Chart on China - Market size and forecast 2023-2028 ($ million)
- Exhibits102: Data Table on China - Market size and forecast 2023-2028 ($ million)
- Exhibits103: Chart on China - Year-over-year growth 2023-2028 (%)
- Exhibits104: Data Table on China - Year-over-year growth 2023-2028 (%)
- Exhibits105: Market opportunity By Geographical Landscape ($ million)
- Exhibits106: Data Tables on Market opportunity By Geographical Landscape ($ million)
- Exhibits107: Impact of drivers and challenges in 2023 and 2028
- Exhibits108: Overview on criticality of inputs and factors of differentiation
- Exhibits109: Overview on factors of disruption
- Exhibits110: Impact of key risks on business
- Exhibits111: Companies covered
- Exhibits112: Matrix on companies position and classification
- Exhibits113: Altair Engineering Inc. - Overview
- Exhibits114: Altair Engineering Inc. - Business segments
- Exhibits115: Altair Engineering Inc. - Key news
- Exhibits116: Altair Engineering Inc. - Key offerings
- Exhibits117: Altair Engineering Inc. - Segment focus
- Exhibits118: ANSYS Inc. - Overview
- Exhibits119: ANSYS Inc. - Product / Service
- Exhibits120: ANSYS Inc. - Key news
- Exhibits121: ANSYS Inc. - Key offerings
- Exhibits122: Antares Vision S.p.A - Overview
- Exhibits123: Antares Vision S.p.A - Product / Service
- Exhibits124: Antares Vision S.p.A - Key offerings
- Exhibits125: Aptean Group of Companies - Overview
- Exhibits126: Aptean Group of Companies - Product / Service
- Exhibits127: Aptean Group of Companies - Key news
- Exhibits128: Aptean Group of Companies - Key offerings
- Exhibits129: Axway Software SA - Overview
- Exhibits130: Axway Software SA - Business segments
- Exhibits131: Axway Software SA - Key news
- Exhibits132: Axway Software SA - Key offerings
- Exhibits133: Axway Software SA - Segment focus
- Exhibits134: Bar Code Integrators Inc. - Overview
- Exhibits135: Bar Code Integrators Inc. - Product / Service
- Exhibits136: Bar Code Integrators Inc. - Key offerings
- Exhibits137: Blue Yonder Inc. - Overview
- Exhibits138: Blue Yonder Inc. - Product / Service
- Exhibits139: Blue Yonder Inc. - Key offerings
- Exhibits140: Labeling Systems LLC - Overview
- Exhibits141: Labeling Systems LLC - Product / Service
- Exhibits142: Labeling Systems LLC - Key offerings
- Exhibits143: Merit Solutions Inc. - Overview
- Exhibits144: Merit Solutions Inc. - Product / Service
- Exhibits145: Merit Solutions Inc. - Key offerings
- Exhibits146: Microsoft Corp. - Overview
- Exhibits147: Microsoft Corp. - Business segments
- Exhibits148: Microsoft Corp. - Key news
- Exhibits149: Microsoft Corp. - Key offerings
- Exhibits150: Microsoft Corp. - Segment focus
- Exhibits151: Oracle Corp. - Overview
- Exhibits152: Oracle Corp. - Business segments
- Exhibits153: Oracle Corp. - Key news
- Exhibits154: Oracle Corp. - Key offerings
- Exhibits155: Oracle Corp. - Segment focus
- Exhibits156: rfxcel Corp. - Overview
- Exhibits157: rfxcel Corp. - Product / Service
- Exhibits158: rfxcel Corp. - Key offerings
- Exhibits159: SAP SE - Overview
- Exhibits160: SAP SE - Business segments
- Exhibits161: SAP SE - Key news
- Exhibits162: SAP SE - Key offerings
- Exhibits163: SAP SE - Segment focus
- Exhibits164: Siemens AG - Overview
- Exhibits165: Siemens AG - Business segments
- Exhibits166: Siemens AG - Key news
- Exhibits167: Siemens AG - Key offerings
- Exhibits168: Siemens AG - Segment focus
- Exhibits169: TraceLink Inc. - Overview
- Exhibits170: TraceLink Inc. - Product / Service
- Exhibits171: TraceLink Inc. - Key offerings
- Exhibits172: Inclusions checklist
- Exhibits173: Exclusions checklist
- Exhibits174: Currency conversion rates for US$
- Exhibits175: Research methodology
- Exhibits176: Information sources
- Exhibits177: Data validation
- Exhibits178: Validation techniques employed for market sizing
- Exhibits179: Data synthesis
- Exhibits180: 360 degree market analysis
- Exhibits181: List of abbreviations
The epedigree software market is forecasted to grow by USD 4023.9 mn during 2023-2028, accelerating at a CAGR of 18.69% during the forecast period. The report on the epedigree software market provides a holistic analysis, market size and forecast, trends, growth drivers, and challenges, as well as vendor analysis covering around 25 vendors.
The report offers an up-to-date analysis regarding the current market scenario, the latest trends and drivers, and the overall market environment. The market is driven by rising requirements for serializability to tackle counterfeiting, increase in rate of technology adoption and proliferation of technologies, and ensuring compliance with governmental regulations.
Technavio's epedigree software market is segmented as below:
| Market Scope | |
|---|---|
| Base Year | 2024 |
| End Year | 2028 |
| Series Year | 2024-2028 |
| Growth Momentum | Accelerate |
| YOY 2024 | 16.01% |
| CAGR | 18.69% |
| Incremental Value | $4023.9mn |
ByDeployment
- On-premises
- Cloud
ByEnd-user
- Large enterprise
- Small and medium enterprises
ByGeography
- North America
- Europe
- APAC
- South America
- Middle East and Africa
This study identifies the high-tech developments to smarten pharma supply chain as one of the prime reasons driving the epedigree software market growth during the next few years. Also, data explosion due to adoption of software across pharma value chain and development of strict global regulatory and compliance standards will lead to sizable demand in the market.
The report on the epedigree software market covers the following areas:
- Epedigree software market sizing
- Epedigree software market forecast
- Epedigree software market industry analysis
The robust vendor analysis is designed to help clients improve their market position, and in line with this, this report provides a detailed analysis of several leading epedigree software market vendors that include Altair Engineering Inc., ANSYS Inc., Antares Vision S.p.A, Aptean Group of Companies, Axway Software SA, Bar Code Integrators Inc., Blue Yonder Inc., Labeling Systems LLC, Merit Solutions Inc., Microsoft Corp., Optel Group, Oracle Corp., rfxcel Corp., SAP SE, Siemens AG, and TraceLink Inc.. Also, the epedigree software market analysis report includes information on upcoming trends and challenges that will influence market growth. This is to help companies strategize and leverage all forthcoming growth opportunities.
The study was conducted using an objective combination of primary and secondary information including inputs from key participants in the industry. The report contains a comprehensive market and vendor landscape in addition to an analysis of the key vendors.
The publisher presents a detailed picture of the market by the way of study, synthesis, and summation of data from multiple sources by an analysis of key parameters such as profit, pricing, competition, and promotions. It presents various market facets by identifying the key industry influencers. The data presented is comprehensive, reliable, and a result of extensive research - both primary and secondary. The market research reports provide a complete competitive landscape and an in-depth vendor selection methodology and analysis using qualitative and quantitative research to forecast the accurate market growth.
Table of Contents
1 Executive Summary
- 1.1 Market overview
- Executive Summary - Chart on Market Overview
- Executive Summary - Data Table on Market Overview
- Executive Summary - Chart on Global Market Characteristics
- Executive Summary - Chart on Market By Geographical Landscape
- Executive Summary - Chart on Market Segmentation by Deployment
- Executive Summary - Chart on Market Segmentation by End-user
- Executive Summary - Chart on Incremental Growth
- Executive Summary - Data Table on Incremental Growth
- Executive Summary - Chart on Company Market Positioning
2 Market Landscape
- 2.1 Market ecosystem
- Parent Market
- Data Table on - Parent Market
- 2.2 Market characteristics
- Market characteristics analysis
- 2.3 Value chain analysis
- Value Chain Analysis
3 Market Sizing
- 3.1 Market definition
- Offerings of companies included in the market definition
- 3.2 Market segment analysis
- Market segments
- 3.3 Market size 2023
- 3.4 Market outlook: Forecast for 2023-2028
- Chart on Global - Market size and forecast 2023-2028 ($ million)
- Data Table on Global - Market size and forecast 2023-2028 ($ million)
- Chart on Global Market: Year-over-year growth 2023-2028 (%)
- Data Table on Global Market: Year-over-year growth 2023-2028 (%)
4 Historic Market Size
- 4.1 Global EPedigree Software Market 2018 - 2022
- Historic Market Size - Data Table on Global EPedigree Software Market 2018 - 2022 ($ million)
- 4.2 Deployment segment analysis 2018 - 2022
- Historic Market Size - Deployment Segment 2018 - 2022 ($ million)
- 4.3 End-user segment analysis 2018 - 2022
- Historic Market Size - End-user Segment 2018 - 2022 ($ million)
- 4.4 Geography segment analysis 2018 - 2022
- Historic Market Size - Geography Segment 2018 - 2022 ($ million)
- 4.5 Country segment analysis 2018 - 2022
- Historic Market Size - Country Segment 2018 - 2022 ($ million)
5 Five Forces Analysis
- 5.1 Five forces summary
- Five forces analysis - Comparison between 2023 and 2028
- 5.2 Bargaining power of buyers
- Bargaining power of buyers - Impact of key factors 2023 and 2028
- 5.3 Bargaining power of suppliers
- Bargaining power of suppliers - Impact of key factors in 2023 and 2028
- 5.4 Threat of new entrants
- Threat of new entrants - Impact of key factors in 2023 and 2028
- 5.5 Threat of substitutes
- Threat of substitutes - Impact of key factors in 2023 and 2028
- 5.6 Threat of rivalry
- Threat of rivalry - Impact of key factors in 2023 and 2028
- 5.7 Market condition
- Chart on Market condition - Five forces 2023 and 2028
6 Market Segmentation by Deployment
- 6.1 Market segments
- Chart on Deployment - Market share 2023-2028 (%)
- Data Table on Deployment - Market share 2023-2028 (%)
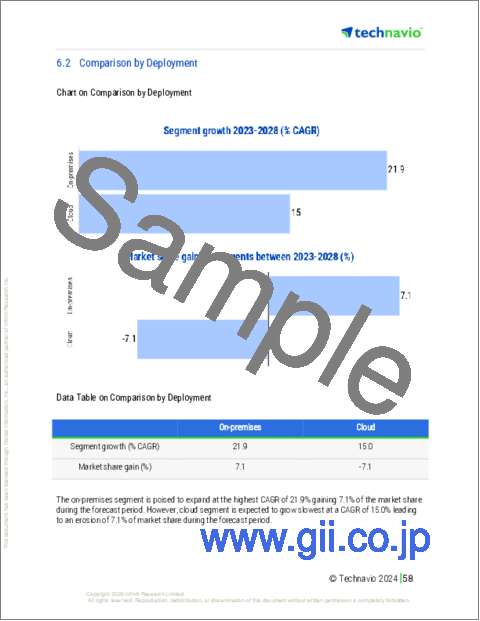
- 6.2 Comparison by Deployment
- Chart on Comparison by Deployment
- Data Table on Comparison by Deployment
- 6.3 On-premises - Market size and forecast 2023-2028
- Chart on On-premises - Market size and forecast 2023-2028 ($ million)
- Data Table on On-premises - Market size and forecast 2023-2028 ($ million)
- Chart on On-premises - Year-over-year growth 2023-2028 (%)
- Data Table on On-premises - Year-over-year growth 2023-2028 (%)
- 6.4 Cloud - Market size and forecast 2023-2028
- Chart on Cloud - Market size and forecast 2023-2028 ($ million)
- Data Table on Cloud - Market size and forecast 2023-2028 ($ million)
- Chart on Cloud - Year-over-year growth 2023-2028 (%)
- Data Table on Cloud - Year-over-year growth 2023-2028 (%)
- 6.5 Market opportunity by Deployment
- Market opportunity by Deployment ($ million)
- Data Table on Market opportunity by Deployment ($ million)
7 Market Segmentation by End-user
- 7.1 Market segments
- Chart on End-user - Market share 2023-2028 (%)
- Data Table on End-user - Market share 2023-2028 (%)
- 7.2 Comparison by End-user
- Chart on Comparison by End-user
- Data Table on Comparison by End-user
- 7.3 Large enterprise - Market size and forecast 2023-2028
- Chart on Large enterprise - Market size and forecast 2023-2028 ($ million)
- Data Table on Large enterprise - Market size and forecast 2023-2028 ($ million)
- Chart on Large enterprise - Year-over-year growth 2023-2028 (%)
- Data Table on Large enterprise - Year-over-year growth 2023-2028 (%)
- 7.4 Small and medium enterprises - Market size and forecast 2023-2028
- Chart on Small and medium enterprises - Market size and forecast 2023-2028 ($ million)
- Data Table on Small and medium enterprises - Market size and forecast 2023-2028 ($ million)
- Chart on Small and medium enterprises - Year-over-year growth 2023-2028 (%)
- Data Table on Small and medium enterprises - Year-over-year growth 2023-2028 (%)
- 7.5 Market opportunity by End-user
- Market opportunity by End-user ($ million)
- Data Table on Market opportunity by End-user ($ million)
8 Customer Landscape
- 8.1 Customer landscape overview
- Analysis of price sensitivity, lifecycle, customer purchase basket, adoption rates, and purchase criteria
9 Geographic Landscape
- 9.1 Geographic segmentation
- Chart on Market share By Geographical Landscape 2023-2028 (%)
- Data Table on Market share By Geographical Landscape 2023-2028 (%)
- 9.2 Geographic comparison
- Chart on Geographic comparison
- Data Table on Geographic comparison
- 9.3 North America - Market size and forecast 2023-2028
- Chart on North America - Market size and forecast 2023-2028 ($ million)
- Data Table on North America - Market size and forecast 2023-2028 ($ million)
- Chart on North America - Year-over-year growth 2023-2028 (%)
- Data Table on North America - Year-over-year growth 2023-2028 (%)
- 9.4 Europe - Market size and forecast 2023-2028
- Chart on Europe - Market size and forecast 2023-2028 ($ million)
- Data Table on Europe - Market size and forecast 2023-2028 ($ million)
- Chart on Europe - Year-over-year growth 2023-2028 (%)
- Data Table on Europe - Year-over-year growth 2023-2028 (%)
- 9.5 APAC - Market size and forecast 2023-2028
- Chart on APAC - Market size and forecast 2023-2028 ($ million)
- Data Table on APAC - Market size and forecast 2023-2028 ($ million)
- Chart on APAC - Year-over-year growth 2023-2028 (%)
- Data Table on APAC - Year-over-year growth 2023-2028 (%)
- 9.6 South America - Market size and forecast 2023-2028
- Chart on South America - Market size and forecast 2023-2028 ($ million)
- Data Table on South America - Market size and forecast 2023-2028 ($ million)
- Chart on South America - Year-over-year growth 2023-2028 (%)
- Data Table on South America - Year-over-year growth 2023-2028 (%)
- 9.7 Middle East and Africa - Market size and forecast 2023-2028
- Chart on Middle East and Africa - Market size and forecast 2023-2028 ($ million)
- Data Table on Middle East and Africa - Market size and forecast 2023-2028 ($ million)
- Chart on Middle East and Africa - Year-over-year growth 2023-2028 (%)
- Data Table on Middle East and Africa - Year-over-year growth 2023-2028 (%)
- 9.8 US - Market size and forecast 2023-2028
- Chart on US - Market size and forecast 2023-2028 ($ million)
- Data Table on US - Market size and forecast 2023-2028 ($ million)
- Chart on US - Year-over-year growth 2023-2028 (%)
- Data Table on US - Year-over-year growth 2023-2028 (%)
- 9.9 Germany - Market size and forecast 2023-2028
- Chart on Germany - Market size and forecast 2023-2028 ($ million)
- Data Table on Germany - Market size and forecast 2023-2028 ($ million)
- Chart on Germany - Year-over-year growth 2023-2028 (%)
- Data Table on Germany - Year-over-year growth 2023-2028 (%)
- 9.10 Japan - Market size and forecast 2023-2028
- Chart on Japan - Market size and forecast 2023-2028 ($ million)
- Data Table on Japan - Market size and forecast 2023-2028 ($ million)
- Chart on Japan - Year-over-year growth 2023-2028 (%)
- Data Table on Japan - Year-over-year growth 2023-2028 (%)
- 9.11 France - Market size and forecast 2023-2028
- Chart on France - Market size and forecast 2023-2028 ($ million)
- Data Table on France - Market size and forecast 2023-2028 ($ million)
- Chart on France - Year-over-year growth 2023-2028 (%)
- Data Table on France - Year-over-year growth 2023-2028 (%)
- 9.12 China - Market size and forecast 2023-2028
- Chart on China - Market size and forecast 2023-2028 ($ million)
- Data Table on China - Market size and forecast 2023-2028 ($ million)
- Chart on China - Year-over-year growth 2023-2028 (%)
- Data Table on China - Year-over-year growth 2023-2028 (%)
- 9.13 Market opportunity By Geographical Landscape
- Market opportunity By Geographical Landscape ($ million)
- Data Tables on Market opportunity By Geographical Landscape ($ million)
10 Drivers, Challenges, and Opportunity/Restraints
- 10.1 Market drivers
- 10.2 Market challenges
- 10.3 Impact of drivers and challenges
- Impact of drivers and challenges in 2023 and 2028
- 10.4 Market opportunities/restraints
11 Competitive Landscape
- 11.1 Overview
- 11.2 Competitive Landscape
- Overview on criticality of inputs and factors of differentiation
- 11.3 Landscape disruption
- Overview on factors of disruption
- 11.4 Industry risks
- Impact of key risks on business
12 Competitive Analysis
- 12.1 Companies profiled
- Companies covered
- 12.2 Market positioning of companies
- Matrix on companies position and classification
- 12.3 Altair Engineering Inc.
- Altair Engineering Inc. - Overview
- Altair Engineering Inc. - Business segments
- Altair Engineering Inc. - Key news
- Altair Engineering Inc. - Key offerings
- Altair Engineering Inc. - Segment focus
- 12.4 ANSYS Inc.
- ANSYS Inc. - Overview
- ANSYS Inc. - Product / Service
- ANSYS Inc. - Key news
- ANSYS Inc. - Key offerings
- 12.5 Antares Vision S.p.A
- Antares Vision S.p.A - Overview
- Antares Vision S.p.A - Product / Service
- Antares Vision S.p.A - Key offerings
- 12.6 Aptean Group of Companies
- Aptean Group of Companies - Overview
- Aptean Group of Companies - Product / Service
- Aptean Group of Companies - Key news
- Aptean Group of Companies - Key offerings
- 12.7 Axway Software SA
- Axway Software SA - Overview
- Axway Software SA - Business segments
- Axway Software SA - Key news
- Axway Software SA - Key offerings
- Axway Software SA - Segment focus
- 12.8 Bar Code Integrators Inc.
- Bar Code Integrators Inc. - Overview
- Bar Code Integrators Inc. - Product / Service
- Bar Code Integrators Inc. - Key offerings
- 12.9 Blue Yonder Inc.
- Blue Yonder Inc. - Overview
- Blue Yonder Inc. - Product / Service
- Blue Yonder Inc. - Key offerings
- 12.10 Labeling Systems LLC
- Labeling Systems LLC - Overview
- Labeling Systems LLC - Product / Service
- Labeling Systems LLC - Key offerings
- 12.11 Merit Solutions Inc.
- Merit Solutions Inc. - Overview
- Merit Solutions Inc. - Product / Service
- Merit Solutions Inc. - Key offerings
- 12.12 Microsoft Corp.
- Microsoft Corp. - Overview
- Microsoft Corp. - Business segments
- Microsoft Corp. - Key news
- Microsoft Corp. - Key offerings
- Microsoft Corp. - Segment focus
- 12.13 Oracle Corp.
- Oracle Corp. - Overview
- Oracle Corp. - Business segments
- Oracle Corp. - Key news
- Oracle Corp. - Key offerings
- Oracle Corp. - Segment focus
- 12.14 rfxcel Corp.
- rfxcel Corp. - Overview
- rfxcel Corp. - Product / Service
- rfxcel Corp. - Key offerings
- 12.15 SAP SE
- SAP SE - Overview
- SAP SE - Business segments
- SAP SE - Key news
- SAP SE - Key offerings
- SAP SE - Segment focus
- 12.16 Siemens AG
- Siemens AG - Overview
- Siemens AG - Business segments
- Siemens AG - Key news
- Siemens AG - Key offerings
- Siemens AG - Segment focus
- 12.17 TraceLink Inc.
- TraceLink Inc. - Overview
- TraceLink Inc. - Product / Service
- TraceLink Inc. - Key offerings
13 Appendix
- 13.1 Scope of the report
- 13.2 Inclusions and exclusions checklist
- Inclusions checklist
- Exclusions checklist
- 13.3 Currency conversion rates for US$
- Currency conversion rates for US$
- 13.4 Research methodology
- Research methodology
- 13.5 Data procurement
- Information sources
- 13.6 Data validation
- Data validation
- 13.7 Validation techniques employed for market sizing
- Validation techniques employed for market sizing
- 13.8 Data synthesis
- Data synthesis
- 13.9 360 degree market analysis
- 360 degree market analysis
- 13.10 List of abbreviations
- List of abbreviations
