|
|
市場調査レポート
商品コード
1464529
スマートフォン用電源管理ICの世界市場 2024-2028Global Smartphone Power Management IC Market 2024-2028 |
||||||
|
|||||||
カスタマイズ可能
|
|||||||

| スマートフォン用電源管理ICの世界市場 2024-2028 |
|
出版日: 2024年04月01日
発行: TechNavio
ページ情報: 英文 185 Pages
納期: 即納可能
|

全表示
- 概要
- 図表
- 目次
スマートフォン用電源管理IC市場は2023-2028年に53億7,000万米ドル、予測期間中のCAGRは7.14%で成長すると予測されます。
当レポートでは、スマートフォン用電源管理IC市場の全体的な分析、市場規模・予測、動向、成長促進要因、課題、約25のベンダーを網羅したベンダー分析などを掲載しています。
現在の市場シナリオ、最新動向と促進要因、市場環境全体に関する最新分析を提供しています。市場は、インターネットの普及とデータトラフィックの増加、スマートフォンへの先進技術の統合、プレミアムレンジ(高位)スマートフォンの採用拡大が牽引しています。
| 市場範囲 | |
|---|---|
| 基準年 | 2024 |
| 終了年 | 2028 |
| 予測期間 | 2024-2028 |
| 成長モメンタム | 加速 |
| 前年比2024年 | 5.86% |
| CAGR | 7.14% |
| 増分額 | 53億7,000万米ドル |
本調査では、半導体デバイスの微細化が今後数年間のスマートフォン用電源管理IC市場成長を牽引する主要因の1つであるとしています。また、より高い効率を提供するICへの窒化ガリウム(GAN)技術の採用や、より多くのチップを必要とする大口径ウエハーへの移行は、市場の大きな需要につながります。
目次
第1章 エグゼクティブサマリー
- 市場概要
第2章 市場情勢
- 市場エコシステム
第3章 市場規模の評価
- 市場の定義
- 市場セグメント分析
- 市場規模 2023
- 市場の見通し 2023-2028
第4章 市場規模実績
- スマートフォン用電源管理ICの世界市場 2018-2022
- 価格セグメント分析 2018-2022
- タイプセグメント分析 2018-2022
- 地域別セグメント分析 2018-2022
- 国別セグメント分析 2018-2022
第5章 ファイブフォース分析
- ファイブフォースの要約
- 買い手の交渉力
- 供給企業の交渉力
- 新規参入業者の脅威
- 代替品の脅威
- 競争の脅威
- 市況
第6章 市場セグメンテーション価格別
- 市場セグメント
- 比較価格別
- 高位(プレミアム):市場規模と予測 2023-2028
- 中位:市場規模と予測 2023-2028
- 低位:市場規模と予測 2023-2028
- 市場機会価格別
第7章 市場セグメンテーション:タイプ別
- 市場セグメント
- 比較:タイプ別
- 統合型ASSP電源管理IC:市場規模と予測 2023-2028
- バッテリー管理IC:市場規模と予測 2023-2028
- その他:市場規模と予測 2023-2028
- 市場機会:タイプ別
第8章 顧客情勢
- 顧客情勢の概要
第9章 地域別情勢
- 地域別セグメンテーション
- 地域別比較
- アジア太平洋:市場規模と予測 2023-2028
- 北米:市場規模と予測 2023-2028
- 欧州:市場規模と予測 2023-2028
- 中東・アフリカ:市場規模と予測 2023-2028
- 南米:市場規模と予測 2023-2028
- 中国:市場規模と予測 2023-2028
- 韓国:市場規模と予測 2023-2028
- 米国:市場規模と予測 2023-2028
- 日本:市場規模と予測 2023-2028
- カナダ:市場規模と予測 2023-2028
- 市場機会:地域情勢別
第10章 促進要因、課題、および動向
- 市場促進要因
- 市場の課題
- 促進要因と課題の影響
- 市場動向
第11章 ベンダー情勢
- 概要
- ベンダー情勢
- 混乱の状況
- 業界のリスク
第12章 ベンダー分析
- 対象ベンダー
- ベンダーの市場ポジショニング
- Analog Devices Inc.
- Diodes Inc.
- Infineon Technologies AG
- MagnaChip Semiconductor Corp.
- MediaTek Inc.
- Microchip Technology Inc.
- Nisshinbo Holdings Inc.
- NXP Semiconductors NV
- ON Semiconductor Corp.
- Qorvo Inc.
- Qualcomm Inc.
- Renesas Electronics Corp.
- Samsung Electronics Co. Ltd.
- STMicroelectronics International NV
- Texas Instruments Inc.
第13章 付録
Exhibits:
- Exhibits1: Executive Summary - Chart on Market Overview
- Exhibits2: Executive Summary - Data Table on Market Overview
- Exhibits3: Executive Summary - Chart on Global Market Characteristics
- Exhibits4: Executive Summary - Chart on Market By Geographical Landscape
- Exhibits5: Executive Summary - Chart on Market Segmentation by Price
- Exhibits6: Executive Summary - Chart on Market Segmentation by Type
- Exhibits7: Executive Summary - Chart on Incremental Growth
- Exhibits8: Executive Summary - Data Table on Incremental Growth
- Exhibits9: Executive Summary - Chart on Vendor Market Positioning
- Exhibits10: Parent market
- Exhibits11: Market Characteristics
- Exhibits12: Offerings of vendors included in the market definition
- Exhibits13: Market segments
- Exhibits14: Chart on Global - Market size and forecast 2023-2028 ($ billion)
- Exhibits15: Data Table on Global - Market size and forecast 2023-2028 ($ billion)
- Exhibits16: Chart on Global Market: Year-over-year growth 2023-2028 (%)
- Exhibits17: Data Table on Global Market: Year-over-year growth 2023-2028 (%)
- Exhibits18: Historic Market Size - Data Table on global smartphone power management ic market 2018 - 2022 ($ billion)
- Exhibits19: Historic Market Size - Price Segment 2018 - 2022 ($ billion)
- Exhibits20: Historic Market Size - Type Segment 2018 - 2022 ($ billion)
- Exhibits21: Historic Market Size - Geography Segment 2018 - 2022 ($ billion)
- Exhibits22: Historic Market Size - Country Segment 2018 - 2022 ($ billion)
- Exhibits23: Five forces analysis - Comparison between 2023 and 2028
- Exhibits24: Chart on Bargaining power of buyers - Impact of key factors 2023 and 2028
- Exhibits25: Bargaining power of suppliers - Impact of key factors in 2023 and 2028
- Exhibits26: Threat of new entrants - Impact of key factors in 2023 and 2028
- Exhibits27: Threat of substitutes - Impact of key factors in 2023 and 2028
- Exhibits28: Threat of rivalry - Impact of key factors in 2023 and 2028
- Exhibits29: Chart on Market condition - Five forces 2023 and 2028
- Exhibits30: Chart on Price - Market share 2023-2028 (%)
- Exhibits31: Data Table on Price - Market share 2023-2028 (%)
- Exhibits32: Chart on Comparison by Price
- Exhibits33: Data Table on Comparison by Price
- Exhibits34: Chart on Premium range - Market size and forecast 2023-2028 ($ billion)
- Exhibits35: Data Table on Premium range - Market size and forecast 2023-2028 ($ billion)
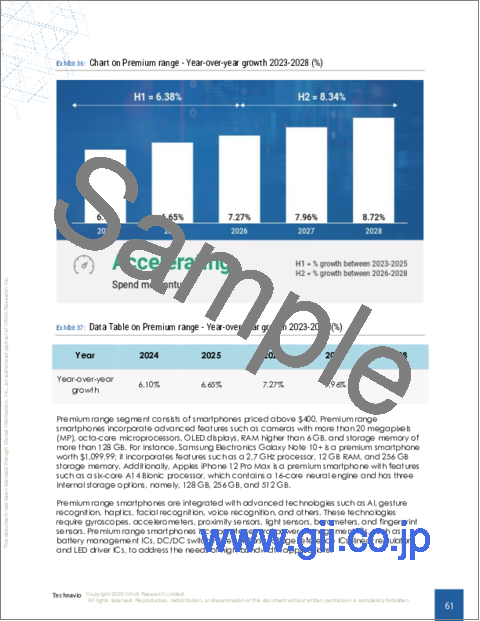
- Exhibits36: Chart on Premium range - Year-over-year growth 2023-2028 (%)
- Exhibits37: Data Table on Premium range - Year-over-year growth 2023-2028 (%)
- Exhibits38: Chart on Medium range - Market size and forecast 2023-2028 ($ billion)
- Exhibits39: Data Table on Medium range - Market size and forecast 2023-2028 ($ billion)
- Exhibits40: Chart on Medium range - Year-over-year growth 2023-2028 (%)
- Exhibits41: Data Table on Medium range - Year-over-year growth 2023-2028 (%)
- Exhibits42: Chart on Low range - Market size and forecast 2023-2028 ($ billion)
- Exhibits43: Data Table on Low range - Market size and forecast 2023-2028 ($ billion)
- Exhibits44: Chart on Low range - Year-over-year growth 2023-2028 (%)
- Exhibits45: Data Table on Low range - Year-over-year growth 2023-2028 (%)
- Exhibits46: Market opportunity by Price ($ billion)
- Exhibits47: Data Table on Market opportunity by Price ($ billion)
- Exhibits48: Chart on Type - Market share 2023-2028 (%)
- Exhibits49: Data Table on Type - Market share 2023-2028 (%)
- Exhibits50: Chart on Comparison by Type
- Exhibits51: Data Table on Comparison by Type
- Exhibits52: Chart on Integrated ASSP power management ICs - Market size and forecast 2023-2028 ($ billion)
- Exhibits53: Data Table on Integrated ASSP power management ICs - Market size and forecast 2023-2028 ($ billion)
- Exhibits54: Chart on Integrated ASSP power management ICs - Year-over-year growth 2023-2028 (%)
- Exhibits55: Data Table on Integrated ASSP power management ICs - Year-over-year growth 2023-2028 (%)
- Exhibits56: Chart on Battery management ICs - Market size and forecast 2023-2028 ($ billion)
- Exhibits57: Data Table on Battery management ICs - Market size and forecast 2023-2028 ($ billion)
- Exhibits58: Chart on Battery management ICs - Year-over-year growth 2023-2028 (%)
- Exhibits59: Data Table on Battery management ICs - Year-over-year growth 2023-2028 (%)
- Exhibits60: Chart on Others - Market size and forecast 2023-2028 ($ billion)
- Exhibits61: Data Table on Others - Market size and forecast 2023-2028 ($ billion)
- Exhibits62: Chart on Others - Year-over-year growth 2023-2028 (%)
- Exhibits63: Data Table on Others - Year-over-year growth 2023-2028 (%)
- Exhibits64: Market opportunity by Type ($ billion)
- Exhibits65: Data Table on Market opportunity by Type ($ billion)
- Exhibits66: Analysis of price sensitivity, lifecycle, customer purchase basket, adoption rates, and purchase criteria
- Exhibits67: Chart on Market share By Geographical Landscape 2023-2028 (%)
- Exhibits68: Data Table on Market share By Geographical Landscape 2023-2028 (%)
- Exhibits69: Chart on Geographic comparison
- Exhibits70: Data Table on Geographic comparison
- Exhibits71: Chart on APAC - Market size and forecast 2023-2028 ($ billion)
- Exhibits72: Data Table on APAC - Market size and forecast 2023-2028 ($ billion)
- Exhibits73: Chart on APAC - Year-over-year growth 2023-2028 (%)
- Exhibits74: Data Table on APAC - Year-over-year growth 2023-2028 (%)
- Exhibits75: Chart on North America - Market size and forecast 2023-2028 ($ billion)
- Exhibits76: Data Table on North America - Market size and forecast 2023-2028 ($ billion)
- Exhibits77: Chart on North America - Year-over-year growth 2023-2028 (%)
- Exhibits78: Data Table on North America - Year-over-year growth 2023-2028 (%)
- Exhibits79: Chart on Europe - Market size and forecast 2023-2028 ($ billion)
- Exhibits80: Data Table on Europe - Market size and forecast 2023-2028 ($ billion)
- Exhibits81: Chart on Europe - Year-over-year growth 2023-2028 (%)
- Exhibits82: Data Table on Europe - Year-over-year growth 2023-2028 (%)
- Exhibits83: Chart on Middle East and Africa - Market size and forecast 2023-2028 ($ billion)
- Exhibits84: Data Table on Middle East and Africa - Market size and forecast 2023-2028 ($ billion)
- Exhibits85: Chart on Middle East and Africa - Year-over-year growth 2023-2028 (%)
- Exhibits86: Data Table on Middle East and Africa - Year-over-year growth 2023-2028 (%)
- Exhibits87: Chart on South America - Market size and forecast 2023-2028 ($ billion)
- Exhibits88: Data Table on South America - Market size and forecast 2023-2028 ($ billion)
- Exhibits89: Chart on South America - Year-over-year growth 2023-2028 (%)
- Exhibits90: Data Table on South America - Year-over-year growth 2023-2028 (%)
- Exhibits91: Chart on China - Market size and forecast 2023-2028 ($ billion)
- Exhibits92: Data Table on China - Market size and forecast 2023-2028 ($ billion)
- Exhibits93: Chart on China - Year-over-year growth 2023-2028 (%)
- Exhibits94: Data Table on China - Year-over-year growth 2023-2028 (%)
- Exhibits95: Chart on South Korea - Market size and forecast 2023-2028 ($ billion)
- Exhibits96: Data Table on South Korea - Market size and forecast 2023-2028 ($ billion)
- Exhibits97: Chart on South Korea - Year-over-year growth 2023-2028 (%)
- Exhibits98: Data Table on South Korea - Year-over-year growth 2023-2028 (%)
- Exhibits99: Chart on US - Market size and forecast 2023-2028 ($ billion)
- Exhibits100: Data Table on US - Market size and forecast 2023-2028 ($ billion)
- Exhibits101: Chart on US - Year-over-year growth 2023-2028 (%)
- Exhibits102: Data Table on US - Year-over-year growth 2023-2028 (%)
- Exhibits103: Chart on Japan - Market size and forecast 2023-2028 ($ billion)
- Exhibits104: Data Table on Japan - Market size and forecast 2023-2028 ($ billion)
- Exhibits105: Chart on Japan - Year-over-year growth 2023-2028 (%)
- Exhibits106: Data Table on Japan - Year-over-year growth 2023-2028 (%)
- Exhibits107: Chart on Canada - Market size and forecast 2023-2028 ($ billion)
- Exhibits108: Data Table on Canada - Market size and forecast 2023-2028 ($ billion)
- Exhibits109: Chart on Canada - Year-over-year growth 2023-2028 (%)
- Exhibits110: Data Table on Canada - Year-over-year growth 2023-2028 (%)
- Exhibits111: Market opportunity By Geographical Landscape ($ billion)
- Exhibits112: Data Tables on Market opportunity By Geographical Landscape ($ billion)
- Exhibits113: Impact of drivers and challenges in 2023 and 2028
- Exhibits114: Overview on Criticality of inputs and Factors of differentiation
- Exhibits115: Overview on factors of disruption
- Exhibits116: Impact of key risks on business
- Exhibits117: Vendors covered
- Exhibits118: Matrix on vendor position and classification
- Exhibits119: Analog Devices Inc. - Overview
- Exhibits120: Analog Devices Inc. - Business segments
- Exhibits121: Analog Devices Inc. - Key news
- Exhibits122: Analog Devices Inc. - Key offerings
- Exhibits123: Analog Devices Inc. - Segment focus
- Exhibits124: Diodes Inc. - Overview
- Exhibits125: Diodes Inc. - Product / Service
- Exhibits126: Diodes Inc. - Key news
- Exhibits127: Diodes Inc. - Key offerings
- Exhibits128: Infineon Technologies AG - Overview
- Exhibits129: Infineon Technologies AG - Business segments
- Exhibits130: Infineon Technologies AG - Key news
- Exhibits131: Infineon Technologies AG - Key offerings
- Exhibits132: Infineon Technologies AG - Segment focus
- Exhibits133: MagnaChip Semiconductor Corp. - Overview
- Exhibits134: MagnaChip Semiconductor Corp. - Product / Service
- Exhibits135: MagnaChip Semiconductor Corp. - Key news
- Exhibits136: MagnaChip Semiconductor Corp. - Key offerings
- Exhibits137: MediaTek Inc. - Overview
- Exhibits138: MediaTek Inc. - Product / Service
- Exhibits139: MediaTek Inc. - Key offerings
- Exhibits140: Microchip Technology Inc. - Overview
- Exhibits141: Microchip Technology Inc. - Business segments
- Exhibits142: Microchip Technology Inc. - Key news
- Exhibits143: Microchip Technology Inc. - Key offerings
- Exhibits144: Microchip Technology Inc. - Segment focus
- Exhibits145: Nisshinbo Holdings Inc. - Overview
- Exhibits146: Nisshinbo Holdings Inc. - Business segments
- Exhibits147: Nisshinbo Holdings Inc. - Key offerings
- Exhibits148: Nisshinbo Holdings Inc. - Segment focus
- Exhibits149: NXP Semiconductors NV - Overview
- Exhibits150: NXP Semiconductors NV - Product / Service
- Exhibits151: NXP Semiconductors NV - Key news
- Exhibits152: NXP Semiconductors NV - Key offerings
- Exhibits153: ON Semiconductor Corp. - Overview
- Exhibits154: ON Semiconductor Corp. - Business segments
- Exhibits155: ON Semiconductor Corp. - Key news
- Exhibits156: ON Semiconductor Corp. - Key offerings
- Exhibits157: ON Semiconductor Corp. - Segment focus
- Exhibits158: Qorvo Inc. - Overview
- Exhibits159: Qorvo Inc. - Business segments
- Exhibits160: Qorvo Inc. - Key news
- Exhibits161: Qorvo Inc. - Key offerings
- Exhibits162: Qorvo Inc. - Segment focus
- Exhibits163: Qualcomm Inc. - Overview
- Exhibits164: Qualcomm Inc. - Business segments
- Exhibits165: Qualcomm Inc. - Key news
- Exhibits166: Qualcomm Inc. - Key offerings
- Exhibits167: Qualcomm Inc. - Segment focus
- Exhibits168: Renesas Electronics Corp. - Overview
- Exhibits169: Renesas Electronics Corp. - Business segments
- Exhibits170: Renesas Electronics Corp. - Key news
- Exhibits171: Renesas Electronics Corp. - Key offerings
- Exhibits172: Renesas Electronics Corp. - Segment focus
- Exhibits173: Samsung Electronics Co. Ltd. - Overview
- Exhibits174: Samsung Electronics Co. Ltd. - Business segments
- Exhibits175: Samsung Electronics Co. Ltd. - Key news
- Exhibits176: Samsung Electronics Co. Ltd. - Key offerings
- Exhibits177: Samsung Electronics Co. Ltd. - Segment focus
- Exhibits178: STMicroelectronics International NV - Overview
- Exhibits179: STMicroelectronics International NV - Business segments
- Exhibits180: STMicroelectronics International NV - Key news
- Exhibits181: STMicroelectronics International NV - Key offerings
- Exhibits182: STMicroelectronics International NV - Segment focus
- Exhibits183: Texas Instruments Inc. - Overview
- Exhibits184: Texas Instruments Inc. - Business segments
- Exhibits185: Texas Instruments Inc. - Key news
- Exhibits186: Texas Instruments Inc. - Key offerings
- Exhibits187: Texas Instruments Inc. - Segment focus
- Exhibits188: Inclusions checklist
- Exhibits189: Exclusions checklist
- Exhibits190: Currency conversion rates for US$
- Exhibits191: Research methodology
- Exhibits192: Validation techniques employed for market sizing
- Exhibits193: Information sources
- Exhibits194: List of abbreviations
The smartphone power management IC market is forecasted to grow by USD 5.37 bn during 2023-2028, accelerating at a CAGR of 7.14% during the forecast period. The report on the smartphone power management IC market provides a holistic analysis, market size and forecast, trends, growth drivers, and challenges, as well as vendor analysis covering around 25 vendors.
The report offers an up-to-date analysis regarding the current market scenario, the latest trends and drivers, and the overall market environment. The market is driven by growing internet penetration and data traffic, integration of advanced technologies in smartphones, and growing adoption of premium-range smartphones.
Technavio's smartphone power management IC market is segmented as below:
| Market Scope | |
|---|---|
| Base Year | 2024 |
| End Year | 2028 |
| Series Year | 2024-2028 |
| Growth Momentum | Accelerate |
| YOY 2024 | 5.86% |
| CAGR | 7.14% |
| Incremental Value | $5.37bn |
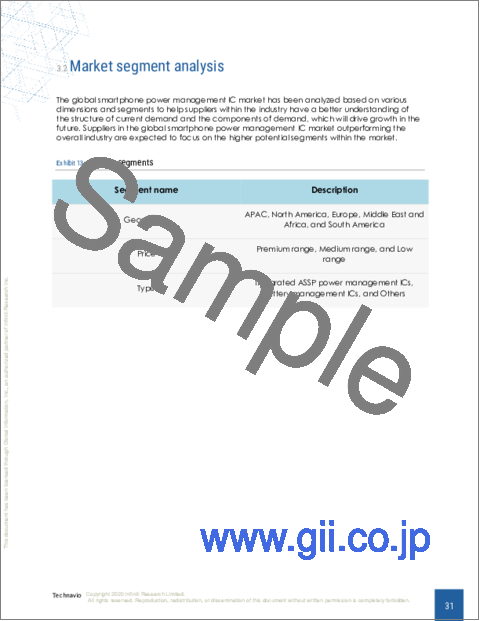
By Price
- Premium range
- Medium range
- Low range
By Type
- Integrated ASSP power management ICs
- Battery management ICs
- Others
By Geographical Landscape
- APAC
- North America
- Europe
- Middle East and Africa
- South America
This study identifies the miniaturization of semiconductor devices as one of the prime reasons driving the smartphone power management IC market growth during the next few years. Also, the adoption of gallium nitride (GAN) technology in ICs offering higher efficiency and transition to large-diameter wafers demanding more chips will lead to sizable demand in the market.
The report on the smartphone power management ic market covers the following areas:
- Smartphone power management IC market sizing
- Smartphone power management IC market forecast
- Smartphone power management IC market industry analysis
The robust vendor analysis is designed to help clients improve their market position, and in line with this, this report provides a detailed analysis of several leading smartphone power management IC market vendors that include Analog Devices Inc., Infineon Technologies AG, MagnaChip Semiconductor Corp., MediaTek Inc., Microchip Technology Inc., Nisshinbo Holdings Inc., NXP Semiconductors NV, ON Semiconductor Corp., Qorvo Inc., Qualcomm Inc., Renesas Electronics Corp., Richtek Technology Corp., ROHM Co. Ltd., Samsung Electronics Co. Ltd., Semtech Corp., STMicroelectronics International NV, Texas Instruments Inc., Toshiba Corp., and Diodes Inc.. Also, the smartphone power management IC market analysis report includes information on upcoming trends and challenges that will influence market growth. This is to help companies strategize and leverage all forthcoming growth opportunities.
The study was conducted using an objective combination of primary and secondary information including inputs from key participants in the industry. The report contains a comprehensive market and vendor landscape in addition to an analysis of the key vendors.
The publisher presents a detailed picture of the market by way of study, synthesis, and summation of data from multiple sources through an analysis of key parameters such as profit, pricing, competition, and promotions. It presents various market facets by identifying the key industry influencers. The data presented is comprehensive, reliable, and a result of extensive research - both primary and secondary. The market research reports provide a complete competitive landscape and an in-depth vendor selection methodology and analysis using qualitative and quantitative research to forecast accurate market growth.
Table of Contents
1 Executive Summary
- 1.1 Market overview
2 Market Landscape
- 2.1 Market ecosystem
3 Market Sizing
- 3.1 Market definition
- 3.2 Market segment analysis
- 3.3 Market size 2023
- 3.4 Market outlook: Forecast for 2023-2028
4 Historic Market Size
- 4.1 Global smartphone power management IC market 2018 - 2022
- 4.2 Price Segment Analysis 2018 - 2022
- 4.3 Type Segment Analysis 2018 - 2022
- 4.4 Geography Segment Analysis 2018 - 2022
- 4.5 Country Segment Analysis 2018 - 2022
5 Five Forces Analysis
- 5.1 Five forces summary
- 5.2 Bargaining power of buyers
- 5.3 Bargaining power of suppliers
- 5.4 Threat of new entrants
- 5.5 Threat of substitutes
- 5.6 Threat of rivalry
- 5.7 Market condition
6 Market Segmentation by Price
- 6.1 Market segments
- 6.2 Comparison by Price
- 6.3 Premium range - Market size and forecast 2023-2028
- 6.4 Medium range - Market size and forecast 2023-2028
- 6.5 Low range - Market size and forecast 2023-2028
- 6.6 Market opportunity by Price
7 Market Segmentation by Type
- 7.1 Market segments
- 7.2 Comparison by Type
- 7.3 Integrated ASSP power management ICs - Market size and forecast 2023-2028
- 7.4 Battery management ICs - Market size and forecast 2023-2028
- 7.5 Others - Market size and forecast 2023-2028
- 7.6 Market opportunity by Type
8 Customer Landscape
- 8.1 Customer landscape overview
9 Geographic Landscape
- 9.1 Geographic segmentation
- 9.2 Geographic comparison
- 9.3 APAC - Market size and forecast 2023-2028
- 9.4 North America - Market size and forecast 2023-2028
- 9.5 Europe - Market size and forecast 2023-2028
- 9.6 Middle East and Africa - Market size and forecast 2023-2028
- 9.7 South America - Market size and forecast 2023-2028
- 9.8 China - Market size and forecast 2023-2028
- 9.9 South Korea - Market size and forecast 2023-2028
- 9.10 US - Market size and forecast 2023-2028
- 9.11 Japan - Market size and forecast 2023-2028
- 9.12 Canada - Market size and forecast 2023-2028
- 9.13 Market opportunity By Geographical Landscape
10 Drivers, Challenges, and Trends
- 10.1 Market drivers
- 10.2 Market challenges
- 10.3 Impact of drivers and challenges
- 10.4 Market trends
11 Vendor Landscape
- 11.1 Overview
- 11.2 Vendor landscape
- 11.3 Landscape disruption
- 11.4 Industry risks
12 Vendor Analysis
- 12.1 Vendors covered
- 12.2 Market positioning of vendors
- 12.3 Analog Devices Inc.
- 12.4 Diodes Inc.
- 12.5 Infineon Technologies AG
- 12.6 MagnaChip Semiconductor Corp.
- 12.7 MediaTek Inc.
- 12.8 Microchip Technology Inc.
- 12.9 Nisshinbo Holdings Inc.
- 12.10 NXP Semiconductors NV
- 12.11 ON Semiconductor Corp.
- 12.12 Qorvo Inc.
- 12.13 Qualcomm Inc.
- 12.14 Renesas Electronics Corp.
- 12.15 Samsung Electronics Co. Ltd.
- 12.16 STMicroelectronics International NV
- 12.17 Texas Instruments Inc.
13 Appendix
- 13.1 Scope of the report
- 13.2 Inclusions and exclusions checklist
- 13.3 Currency conversion rates for US$
- 13.4 Research methodology
- 13.5 List of abbreviations

