|
|
市場調査レポート
商品コード
1936693
eラーニングの世界市場、2026年~2030年Global E-Learning Market 2026-2030 |
||||||

|
|||||||
カスタマイズ可能
|
|||||||

| eラーニングの世界市場、2026年~2030年 |
|
出版日: 2026年02月11日
発行: TechNavio
ページ情報: 英文 292 Pages
納期: 即納可能
|

概要
世界のeラーニング市場は、2025年から2030年の間に5,490億440万米ドルの成長が見込まれ、予測期間中のCAGRは24.2%と予測されています。
本報告書では、世界のeラーニング市場に関する包括的な分析、市場規模と予測、動向、成長要因、課題に加え、約25社のベンダー分析を提供しております。
本レポートは、現在の市場状況、最新の動向と促進要因、市場環境全般に関する最新の分析を提供します。市場の成長は、学術分野におけるデジタルトランスフォーメーションによる学習成果の向上、デジタルコンテンツ開発におけるコスト効率と拡張性、ゲーミフィケーションを活用した学習体験による学生のエンゲージメント向上によって牽引されています。
本調査は、業界の主要関係者からの情報を含む一次情報と二次情報を客観的に組み合わせて実施されました。本レポートには、主要企業の分析に加え、包括的な市場規模データ、地域別分析を伴うセグメント、ベンダー情勢が含まれています。レポートには過去データと予測データが掲載されています。
| 市場範囲 | |
|---|---|
| 基準年 | 2026年 |
| 終了年 | 2030年 |
| 予測期間 | 2026-2030 |
| 成長モメンタム | 加速 |
| 前年比2026年 | 19.5% |
| CAGR | 24.2% |
| 増分額 | 5,490億440万米ドル |
本調査では、今後数年間における世界のeラーニング市場成長を牽引する主要要因の一つとして、マイクロラーニングが好まれるデジタル教育形式として拡大していることを特定しております。また、学術分野のeラーニングにおけるクラウドベースプラットフォームへの依存度の高まり、ならびにデジタル学習エコシステムへのインダストリー4.0技術の統合が進むことで、市場において相当な需要が生まれる見込みです。
目次
第1章 エグゼクティブサマリー
第2章 Technavio分析
- 価格・ライフサイクル・顧客購入バスケット・採用率・購入基準の分析
- インプットの重要性と差別化の要因
- 混乱の要因
- 促進要因と課題の影響
第3章 市場情勢
- 市場エコシステム
- 市場の特徴
- バリューチェーン分析
第4章 市場規模
- 市場の定義
- 市場セグメント分析
- 市場規模 2025
- 市場の見通し 2025-2030
第5章 市場規模実績
- 世界のeラーニング市場 2020-2024
- エンドユーザーセグメント分析 2020-2024
- 展開セグメント分析 2020-2024
- 技術セグメント分析 2020-2024
- 地域別セグメント分析 2020-2024
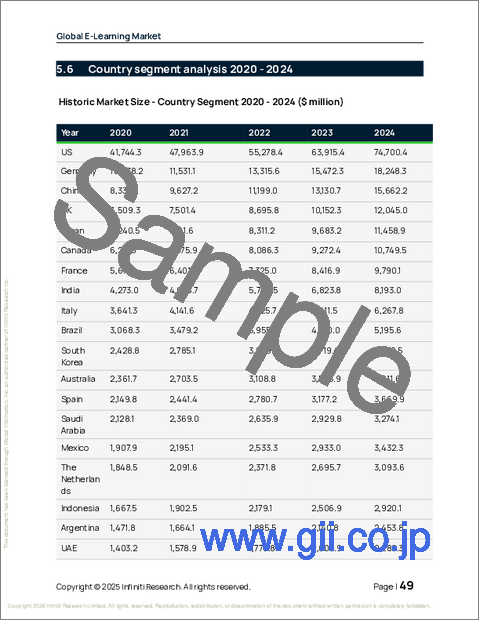
- 国別セグメント分析 2020-2024
第6章 定性分析
- AIの影響:eラーニングの世界市場
第7章 ファイブフォース分析
- ファイブフォースの要約
- 買い手の交渉力
- 供給企業の交渉力
- 新規参入業者の脅威
- 代替品の脅威
- 競争の脅威
- 市況
第8章 市場セグメンテーション:エンドユーザー別
- 比較:エンドユーザー別
- 高等教育機関
- 法人向け
- K-12
- 市場機会:エンドユーザー別
第9章 市場セグメンテーション:展開別
- 比較:展開別
- オンプレミス
- クラウド
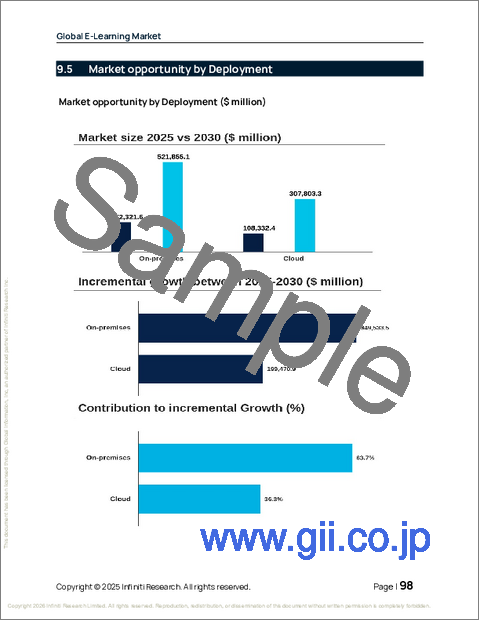
- 市場機会:展開別
第10章 市場セグメンテーション:技術別
- 比較:技術別
- オンラインeラーニング
- LMS
- その他
- 市場機会:技術別
第11章 顧客情勢
第12章 地域別情勢
- 地域別セグメンテーション
- 地域別比較
- 北米
- 米国
- カナダ
- メキシコ
- 欧州
- ドイツ
- 英国
- フランス
- イタリア
- スペイン
- オランダ
- アジア太平洋
- 中国
- 日本
- インド
- 韓国
- オーストラリア
- インドネシア
- 南米
- ブラジル
- アルゼンチン
- コロンビア
- 中東・アフリカ
- サウジアラビア
- アラブ首長国連邦
- 南アフリカ
- イスラエル
- トルコ
- 市場機会:地域別
第13章 促進要因・課題・機会
- 市場促進要因
- 市場の課題
- 促進要因と課題の影響
- 市場機会
第14章 競合情勢
- 概要
- 競合情勢
- 混乱の状況
- 業界のリスク
第15章 競合分析
- 企業プロファイル
- 企業ランキング指標
- 企業の市場ポジショニング
- 2U Inc.
- Aptara Inc.
- Berlitz Corp.
- Chegg Inc.
- Cornerstone OnDemand Inc.
- D2L Corp.
- Google LLC
- Instructure Holdings Inc.
- Microsoft Corp.
- Pearson Plc
- Pluralsight LLC
- Sanako
- SAP SE
- Skillsoft Corp.
- Udemy Inc.
