|
|
市場調査レポート
商品コード
1788462
直接接続型AIストレージシステムの世界市場 2025-2029Global Direct Attached AI Storage System Market 2025-2029 |
||||||

|
|||||||
カスタマイズ可能
|
|||||||

| 直接接続型AIストレージシステムの世界市場 2025-2029 |
|
出版日: 2025年08月02日
発行: TechNavio
ページ情報: 英文 252 Pages
納期: 即納可能
|

全表示
- 概要
- 図表
- 目次
直接接続型AIストレージシステム市場は2024-2029年に199億8,320万米ドル、予測期間中のCAGRは24.2%で成長すると予測されます。
当レポートでは、直接接続型AIストレージシステム市場の全体的な分析、市場規模・予測、動向、成長促進要因、課題、約25のベンダーを網羅したベンダー分析などを掲載しています。
現在の市場シナリオ、最新動向と促進要因、市場環境全体に関する最新分析を提供しています。市場は、低レイテンシと高スループットの必要性、データ集約的なジェネレーティブAIと大規模モデルの普及、コンピュートROIを最大化する経済的な必要性によって牽引されています。
| 市場範囲 | |
|---|---|
| 基準年 | 2025 |
| 終了年 | 2029 |
| 予測期間 | 2025-2029 |
| 成長モメンタム | 加速 |
| 前年比 | 21.1% |
| CAGR | 24.2% |
| 増分額 | 199億8,320万米ドル |
本調査は、業界の主要参加者からのインプットを含め、一次情報と二次情報を客観的に組み合わせて実施しました。レポートには、主要企業の分析に加え、包括的な市場規模データ、地域別分析によるセグメント、ベンダー情勢が含まれています。レポートには過去データと予測データがあります。
本調査では、今後数年間の直接接続型AIストレージシステム市場の成長を促進する主な理由の1つとして、ペタバイトスケールの超高密度システムへの推進を挙げています。また、ダスクラスターのソフトウェア定義による統合や、リソースを分割するためのCXLの出現は、市場の大きな需要につながると思われます。
目次
第1章 エグゼクティブサマリー
- 市場概要
第2章 Technavio分析
- 価格・ライフサイクル・顧客購入バスケット・採用率・購入基準の分析
- インプットの重要性と差別化の要因
- 混乱の要因
- 促進要因と課題の影響
第3章 市場情勢
- 市場エコシステム
- 市場の特徴
- バリューチェーン分析
第4章 市場規模
- 市場の定義
- 市場セグメント分析
- 市場規模 2024
- 市場の見通し 2024-2029
第5章 市場規模実績
- 直接接続型AIストレージシステムの世界市場 2019-2023
- 製品セグメント分析 2019-2023
- 方法セグメント分析 2019-2023
- タイプセグメント分析 2019-2023
- エンドユーザーセグメント分析 2019-2023
- 地域別セグメント分析 2019-2023
- 国別セグメント分析 2019-2023
第6章 ファイブフォース分析
- ファイブフォースの要約
- 買い手の交渉力
- 供給企業の交渉力
- 新規参入業者の脅威
- 代替品の脅威
- 競争の脅威
- 市況
第7章 市場セグメンテーション:製品別
- 市場セグメント
- 比較:製品別
- ハードウェア:市場規模と予測 2024-2029
- ソフトウェア:市場規模と予測 2024-2029
- 市場機会:製品別
第8章 市場セグメンテーション:方法別
- 市場セグメント
- 比較:方法別
- ブロックストレージ:市場規模と予測 2024-2029
- ファイルストレージ:市場規模と予測 2024-2029
- オブジェクトストレージ:市場規模と予測 2024-2029
- 市場機会:方法別
第9章 市場セグメンテーション:タイプ別
- 市場セグメント
- 比較:タイプ別
- ソリッドステートドライブ:市場規模と予測 2024-2029
- ハードディスクドライブ:市場規模と予測 2024-2029
- 市場機会:タイプ別
第10章 市場セグメンテーション:エンドユーザー別
- 市場セグメント
- 比較:エンドユーザー別
- 企業:市場規模と予測 2024-2029
- クラウドサービスプロバイダー:市場規模と予測 2024-2029
- 政府機関:市場規模と予測 2024-2029
- 通信会社:市場規模と予測 2024-2029
- 市場機会:エンドユーザー別
第11章 顧客情勢
- 顧客情勢の概要
第12章 地域別情勢
- 地域別セグメンテーション
- 地域別比較
- 北米:市場規模と予測 2024-2029
- アジア太平洋:市場規模と予測 2024-2029
- 欧州:市場規模と予測 2024-2029
- 南米:市場規模と予測 2024-2029
- 中東・アフリカ:市場規模と予測 2024-2029
- 米国:市場規模と予測 2024-2029
- 中国:市場規模と予測 2024-2029
- 日本:市場規模と予測 2024-2029
- インド:市場規模と予測 2024-2029
- ドイツ:市場規模と予測 2024-2029
- カナダ:市場規模と予測 2024-2029
- 英国:市場規模と予測 2024-2029
- 韓国:市場規模と予測 2024-2029
- ブラジル:市場規模と予測 2024-2029
- フランス:市場規模と予測 2024-2029
- 市場機会:地域情勢別
第13章 促進要因・課題・機会・抑制要因
- 市場促進要因
- 市場の課題
- 促進要因と課題の影響
- 市場の機会・抑制要因
第14章 競合情勢
- 概要
- 競合情勢
- 混乱の状況
- 業界のリスク
第15章 競合分析
- 企業プロファイル
- 企業ランキング指数
- 企業の市場ポジショニング
- Amazon Web Services Inc.
- Dell Technologies Inc.
- Google LLC
- Hewlett Packard Enterprise Co.
- Hitachi Vantara LLC
- International Business Machines Corp.
- Lenovo Group Ltd.
- Microsoft Corp.
- NetApp Inc.
- NVIDIA Corp.
- Pure Storage Inc.
- Samsung Electronics Co. Ltd.
- Seagate Technology LLC
- Super Micro Computer Inc.
- Western Digital Corp
第16章 付録
Exhibits:
- Exhibits1: Executive Summary - Chart on Market Overview
- Exhibits2: Executive Summary - Data Table on Market Overview
- Exhibits3: Executive Summary - Chart on Global Market Characteristics
- Exhibits4: Executive Summary - Chart on Market By Geographical Landscape
- Exhibits5: Executive Summary - Chart on Market Segmentation by Product
- Exhibits6: Executive Summary - Chart on Market Segmentation by Method
- Exhibits7: Executive Summary - Chart on Market Segmentation by Type
- Exhibits8: Executive Summary - Chart on Market Segmentation by End-user
- Exhibits9: Executive Summary - Chart on Incremental Growth
- Exhibits10: Executive Summary - Data Table on Incremental Growth
- Exhibits11: Executive Summary - Chart on Company Market Positioning
- Exhibits12: Analysis of price sensitivity, lifecycle, customer purchase basket, adoption rates, and purchase criteria
- Exhibits13: Overview on criticality of inputs and factors of differentiation
- Exhibits14: Overview on factors of disruption
- Exhibits15: Impact of drivers and challenges in 2024 and 2029
- Exhibits16: Parent Market
- Exhibits17: Data Table on - Parent Market
- Exhibits18: Market characteristics analysis
- Exhibits19: Value chain analysis
- Exhibits20: Offerings of companies included in the market definition
- Exhibits21: Market segments
- Exhibits22: Chart on Global - Market size and forecast 2024-2029 ($ million)
- Exhibits23: Data Table on Global - Market size and forecast 2024-2029 ($ million)
- Exhibits24: Chart on Global Market: Year-over-year growth 2024-2029 (%)
- Exhibits25: Data Table on Global Market: Year-over-year growth 2024-2029 (%)
- Exhibits26: Historic Market Size - Data Table on Global Direct Attached AI Storage System Market 2019 - 2023 ($ million)
- Exhibits27: Historic Market Size - Product Segment 2019 - 2023 ($ million)
- Exhibits28: Historic Market Size - Method Segment 2019 - 2023 ($ million)
- Exhibits29: Historic Market Size - Type Segment 2019 - 2023 ($ million)
- Exhibits30: Historic Market Size - End-user Segment 2019 - 2023 ($ million)
- Exhibits31: Historic Market Size - Geography Segment 2019 - 2023 ($ million)
- Exhibits32: Historic Market Size - Country Segment 2019 - 2023 ($ million)
- Exhibits33: Five forces analysis - Comparison between 2024 and 2029
- Exhibits34: Bargaining power of buyers - Impact of key factors 2024 and 2029
- Exhibits35: Bargaining power of suppliers - Impact of key factors in 2024 and 2029
- Exhibits36: Threat of new entrants - Impact of key factors in 2024 and 2029
- Exhibits37: Threat of substitutes - Impact of key factors in 2024 and 2029
- Exhibits38: Threat of rivalry - Impact of key factors in 2024 and 2029
- Exhibits39: Chart on Market condition - Five forces 2024 and 2029
- Exhibits40: Chart on Product - Market share 2024-2029 (%)
- Exhibits41: Data Table on Product - Market share 2024-2029 (%)
- Exhibits42: Chart on Comparison by Product
- Exhibits43: Data Table on Comparison by Product
- Exhibits44: Chart on Hardware - Market size and forecast 2024-2029 ($ million)
- Exhibits45: Data Table on Hardware - Market size and forecast 2024-2029 ($ million)
- Exhibits46: Chart on Hardware - Year-over-year growth 2024-2029 (%)
- Exhibits47: Data Table on Hardware - Year-over-year growth 2024-2029 (%)
- Exhibits48: Chart on Software - Market size and forecast 2024-2029 ($ million)
- Exhibits49: Data Table on Software - Market size and forecast 2024-2029 ($ million)
- Exhibits50: Chart on Software - Year-over-year growth 2024-2029 (%)
- Exhibits51: Data Table on Software - Year-over-year growth 2024-2029 (%)
- Exhibits52: Market opportunity by Product ($ million)
- Exhibits53: Data Table on Market opportunity by Product ($ million)
- Exhibits54: Chart on Method - Market share 2024-2029 (%)
- Exhibits55: Data Table on Method - Market share 2024-2029 (%)
- Exhibits56: Chart on Comparison by Method
- Exhibits57: Data Table on Comparison by Method
- Exhibits58: Chart on Block storage - Market size and forecast 2024-2029 ($ million)
- Exhibits59: Data Table on Block storage - Market size and forecast 2024-2029 ($ million)
- Exhibits60: Chart on Block storage - Year-over-year growth 2024-2029 (%)
- Exhibits61: Data Table on Block storage - Year-over-year growth 2024-2029 (%)
- Exhibits62: Chart on File storage - Market size and forecast 2024-2029 ($ million)
- Exhibits63: Data Table on File storage - Market size and forecast 2024-2029 ($ million)
- Exhibits64: Chart on File storage - Year-over-year growth 2024-2029 (%)
- Exhibits65: Data Table on File storage - Year-over-year growth 2024-2029 (%)
- Exhibits66: Chart on Object storage - Market size and forecast 2024-2029 ($ million)
- Exhibits67: Data Table on Object storage - Market size and forecast 2024-2029 ($ million)
- Exhibits68: Chart on Object storage - Year-over-year growth 2024-2029 (%)
- Exhibits69: Data Table on Object storage - Year-over-year growth 2024-2029 (%)
- Exhibits70: Market opportunity by Method ($ million)
- Exhibits71: Data Table on Market opportunity by Method ($ million)
- Exhibits72: Chart on Type - Market share 2024-2029 (%)
- Exhibits73: Data Table on Type - Market share 2024-2029 (%)
- Exhibits74: Chart on Comparison by Type
- Exhibits75: Data Table on Comparison by Type
- Exhibits76: Chart on Solid state drive - Market size and forecast 2024-2029 ($ million)
- Exhibits77: Data Table on Solid state drive - Market size and forecast 2024-2029 ($ million)
- Exhibits78: Chart on Solid state drive - Year-over-year growth 2024-2029 (%)
- Exhibits79: Data Table on Solid state drive - Year-over-year growth 2024-2029 (%)
- Exhibits80: Chart on Hard disc drive - Market size and forecast 2024-2029 ($ million)
- Exhibits81: Data Table on Hard disc drive - Market size and forecast 2024-2029 ($ million)
- Exhibits82: Chart on Hard disc drive - Year-over-year growth 2024-2029 (%)
- Exhibits83: Data Table on Hard disc drive - Year-over-year growth 2024-2029 (%)
- Exhibits84: Market opportunity by Type ($ million)
- Exhibits85: Data Table on Market opportunity by Type ($ million)
- Exhibits86: Chart on End-user - Market share 2024-2029 (%)
- Exhibits87: Data Table on End-user - Market share 2024-2029 (%)
- Exhibits88: Chart on Comparison by End-user
- Exhibits89: Data Table on Comparison by End-user
- Exhibits90: Chart on Enterprises - Market size and forecast 2024-2029 ($ million)
- Exhibits91: Data Table on Enterprises - Market size and forecast 2024-2029 ($ million)
- Exhibits92: Chart on Enterprises - Year-over-year growth 2024-2029 (%)
- Exhibits93: Data Table on Enterprises - Year-over-year growth 2024-2029 (%)
- Exhibits94: Chart on Cloud services providers - Market size and forecast 2024-2029 ($ million)
- Exhibits95: Data Table on Cloud services providers - Market size and forecast 2024-2029 ($ million)
- Exhibits96: Chart on Cloud services providers - Year-over-year growth 2024-2029 (%)
- Exhibits97: Data Table on Cloud services providers - Year-over-year growth 2024-2029 (%)
- Exhibits98: Chart on Government bodies - Market size and forecast 2024-2029 ($ million)
- Exhibits99: Data Table on Government bodies - Market size and forecast 2024-2029 ($ million)
- Exhibits100: Chart on Government bodies - Year-over-year growth 2024-2029 (%)
- Exhibits101: Data Table on Government bodies - Year-over-year growth 2024-2029 (%)
- Exhibits102: Chart on Telecom companies - Market size and forecast 2024-2029 ($ million)
- Exhibits103: Data Table on Telecom companies - Market size and forecast 2024-2029 ($ million)
- Exhibits104: Chart on Telecom companies - Year-over-year growth 2024-2029 (%)
- Exhibits105: Data Table on Telecom companies - Year-over-year growth 2024-2029 (%)
- Exhibits106: Market opportunity by End-user ($ million)
- Exhibits107: Data Table on Market opportunity by End-user ($ million)
- Exhibits108: Analysis of price sensitivity, lifecycle, customer purchase basket, adoption rates, and purchase criteria
- Exhibits109: Chart on Market share By Geographical Landscape 2024-2029 (%)
- Exhibits110: Data Table on Market share By Geographical Landscape 2024-2029 (%)
- Exhibits111: Chart on Geographic comparison
- Exhibits112: Data Table on Geographic comparison
- Exhibits113: Chart on North America - Market size and forecast 2024-2029 ($ million)
- Exhibits114: Data Table on North America - Market size and forecast 2024-2029 ($ million)
- Exhibits115: Chart on North America - Year-over-year growth 2024-2029 (%)
- Exhibits116: Data Table on North America - Year-over-year growth 2024-2029 (%)
- Exhibits117: Chart on APAC - Market size and forecast 2024-2029 ($ million)
- Exhibits118: Data Table on APAC - Market size and forecast 2024-2029 ($ million)
- Exhibits119: Chart on APAC - Year-over-year growth 2024-2029 (%)
- Exhibits120: Data Table on APAC - Year-over-year growth 2024-2029 (%)
- Exhibits121: Chart on Europe - Market size and forecast 2024-2029 ($ million)
- Exhibits122: Data Table on Europe - Market size and forecast 2024-2029 ($ million)
- Exhibits123: Chart on Europe - Year-over-year growth 2024-2029 (%)
- Exhibits124: Data Table on Europe - Year-over-year growth 2024-2029 (%)
- Exhibits125: Chart on South America - Market size and forecast 2024-2029 ($ million)
- Exhibits126: Data Table on South America - Market size and forecast 2024-2029 ($ million)
- Exhibits127: Chart on South America - Year-over-year growth 2024-2029 (%)
- Exhibits128: Data Table on South America - Year-over-year growth 2024-2029 (%)
- Exhibits129: Chart on Middle East and Africa - Market size and forecast 2024-2029 ($ million)
- Exhibits130: Data Table on Middle East and Africa - Market size and forecast 2024-2029 ($ million)
- Exhibits131: Chart on Middle East and Africa - Year-over-year growth 2024-2029 (%)
- Exhibits132: Data Table on Middle East and Africa - Year-over-year growth 2024-2029 (%)
- Exhibits133: Chart on US - Market size and forecast 2024-2029 ($ million)
- Exhibits134: Data Table on US - Market size and forecast 2024-2029 ($ million)
- Exhibits135: Chart on US - Year-over-year growth 2024-2029 (%)
- Exhibits136: Data Table on US - Year-over-year growth 2024-2029 (%)
- Exhibits137: Chart on China - Market size and forecast 2024-2029 ($ million)
- Exhibits138: Data Table on China - Market size and forecast 2024-2029 ($ million)
- Exhibits139: Chart on China - Year-over-year growth 2024-2029 (%)
- Exhibits140: Data Table on China - Year-over-year growth 2024-2029 (%)
- Exhibits141: Chart on Japan - Market size and forecast 2024-2029 ($ million)
- Exhibits142: Data Table on Japan - Market size and forecast 2024-2029 ($ million)
- Exhibits143: Chart on Japan - Year-over-year growth 2024-2029 (%)
- Exhibits144: Data Table on Japan - Year-over-year growth 2024-2029 (%)
- Exhibits145: Chart on India - Market size and forecast 2024-2029 ($ million)
- Exhibits146: Data Table on India - Market size and forecast 2024-2029 ($ million)
- Exhibits147: Chart on India - Year-over-year growth 2024-2029 (%)
- Exhibits148: Data Table on India - Year-over-year growth 2024-2029 (%)
- Exhibits149: Chart on Germany - Market size and forecast 2024-2029 ($ million)
- Exhibits150: Data Table on Germany - Market size and forecast 2024-2029 ($ million)
- Exhibits151: Chart on Germany - Year-over-year growth 2024-2029 (%)
- Exhibits152: Data Table on Germany - Year-over-year growth 2024-2029 (%)
- Exhibits153: Chart on Canada - Market size and forecast 2024-2029 ($ million)
- Exhibits154: Data Table on Canada - Market size and forecast 2024-2029 ($ million)
- Exhibits155: Chart on Canada - Year-over-year growth 2024-2029 (%)
- Exhibits156: Data Table on Canada - Year-over-year growth 2024-2029 (%)
- Exhibits157: Chart on UK - Market size and forecast 2024-2029 ($ million)
- Exhibits158: Data Table on UK - Market size and forecast 2024-2029 ($ million)
- Exhibits159: Chart on UK - Year-over-year growth 2024-2029 (%)
- Exhibits160: Data Table on UK - Year-over-year growth 2024-2029 (%)
- Exhibits161: Chart on South Korea - Market size and forecast 2024-2029 ($ million)
- Exhibits162: Data Table on South Korea - Market size and forecast 2024-2029 ($ million)
- Exhibits163: Chart on South Korea - Year-over-year growth 2024-2029 (%)
- Exhibits164: Data Table on South Korea - Year-over-year growth 2024-2029 (%)
- Exhibits165: Chart on Brazil - Market size and forecast 2024-2029 ($ million)
- Exhibits166: Data Table on Brazil - Market size and forecast 2024-2029 ($ million)
- Exhibits167: Chart on Brazil - Year-over-year growth 2024-2029 (%)
- Exhibits168: Data Table on Brazil - Year-over-year growth 2024-2029 (%)
- Exhibits169: Chart on France - Market size and forecast 2024-2029 ($ million)
- Exhibits170: Data Table on France - Market size and forecast 2024-2029 ($ million)
- Exhibits171: Chart on France - Year-over-year growth 2024-2029 (%)
- Exhibits172: Data Table on France - Year-over-year growth 2024-2029 (%)
- Exhibits173: Market opportunity By Geographical Landscape ($ million)
- Exhibits174: Data Tables on Market opportunity By Geographical Landscape ($ million)
- Exhibits175: Impact of drivers and challenges in 2024 and 2029
- Exhibits176: Overview on criticality of inputs and factors of differentiation
- Exhibits177: Overview on factors of disruption
- Exhibits178: Impact of key risks on business
- Exhibits179: Companies covered
- Exhibits180: Company ranking index
- Exhibits181: Matrix on companies position and classification
- Exhibits182: Amazon Web Services Inc. - Overview
- Exhibits183: Amazon Web Services Inc. - Product / Service
- Exhibits184: Amazon Web Services Inc. - Key news
- Exhibits185: Amazon Web Services Inc. - Key offerings
- Exhibits186: SWOT
- Exhibits187: Dell Technologies Inc. - Overview
- Exhibits188: Dell Technologies Inc. - Business segments
- Exhibits189: Dell Technologies Inc. - Key news
- Exhibits190: Dell Technologies Inc. - Key offerings
- Exhibits191: Dell Technologies Inc. - Segment focus
- Exhibits192: SWOT
- Exhibits193: Google LLC - Overview
- Exhibits194: Google LLC - Product / Service
- Exhibits195: Google LLC - Key offerings
- Exhibits196: SWOT
- Exhibits197: Hewlett Packard Enterprise Co. - Overview
- Exhibits198: Hewlett Packard Enterprise Co. - Business segments
- Exhibits199: Hewlett Packard Enterprise Co. - Key news
- Exhibits200: Hewlett Packard Enterprise Co. - Key offerings
- Exhibits201: Hewlett Packard Enterprise Co. - Segment focus
- Exhibits202: SWOT
- Exhibits203: Hitachi Vantara LLC - Overview
- Exhibits204: Hitachi Vantara LLC - Product / Service
- Exhibits205: Hitachi Vantara LLC - Key news
- Exhibits206: Hitachi Vantara LLC - Key offerings
- Exhibits207: SWOT
- Exhibits208: International Business Machines Corp. - Overview
- Exhibits209: International Business Machines Corp. - Business segments
- Exhibits210: International Business Machines Corp. - Key news
- Exhibits211: International Business Machines Corp. - Key offerings
- Exhibits212: International Business Machines Corp. - Segment focus
- Exhibits213: SWOT
- Exhibits214: Lenovo Group Ltd. - Overview
- Exhibits215: Lenovo Group Ltd. - Business segments
- Exhibits216: Lenovo Group Ltd. - Key news
- Exhibits217: Lenovo Group Ltd. - Key offerings
- Exhibits218: Lenovo Group Ltd. - Segment focus
- Exhibits219: SWOT
- Exhibits220: Microsoft Corp. - Overview
- Exhibits221: Microsoft Corp. - Business segments
- Exhibits222: Microsoft Corp. - Key news
- Exhibits223: Microsoft Corp. - Key offerings
- Exhibits224: Microsoft Corp. - Segment focus
- Exhibits225: SWOT
- Exhibits226: NetApp Inc. - Overview
- Exhibits227: NetApp Inc. - Product / Service
- Exhibits228: NetApp Inc. - Key news
- Exhibits229: NetApp Inc. - Key offerings
- Exhibits230: SWOT
- Exhibits231: NVIDIA Corp. - Overview
- Exhibits232: NVIDIA Corp. - Business segments
- Exhibits233: NVIDIA Corp. - Key news
- Exhibits234: NVIDIA Corp. - Key offerings
- Exhibits235: NVIDIA Corp. - Segment focus
- Exhibits236: SWOT
- Exhibits237: Pure Storage Inc. - Overview
- Exhibits238: Pure Storage Inc. - Product / Service
- Exhibits239: Pure Storage Inc. - Key news
- Exhibits240: Pure Storage Inc. - Key offerings
- Exhibits241: SWOT
- Exhibits242: Samsung Electronics Co. Ltd. - Overview
- Exhibits243: Samsung Electronics Co. Ltd. - Business segments
- Exhibits244: Samsung Electronics Co. Ltd. - Key news
- Exhibits245: Samsung Electronics Co. Ltd. - Key offerings
- Exhibits246: Samsung Electronics Co. Ltd. - Segment focus
- Exhibits247: SWOT
- Exhibits248: Seagate Technology LLC - Overview
- Exhibits249: Seagate Technology LLC - Product / Service
- Exhibits250: Seagate Technology LLC - Key news
- Exhibits251: Seagate Technology LLC - Key offerings
- Exhibits252: SWOT
- Exhibits253: Super Micro Computer Inc. - Overview
- Exhibits254: Super Micro Computer Inc. - Business segments
- Exhibits255: Super Micro Computer Inc. - Key news
- Exhibits256: Super Micro Computer Inc. - Key offerings
- Exhibits257: Super Micro Computer Inc. - Segment focus
- Exhibits258: SWOT
- Exhibits259: Western Digital Corp - Overview
- Exhibits260: Western Digital Corp - Business segments
- Exhibits261: Western Digital Corp - Key offerings
- Exhibits262: Western Digital Corp - Segment focus
- Exhibits263: SWOT
- Exhibits264: Inclusions checklist
- Exhibits265: Exclusions checklist
- Exhibits266: Currency conversion rates for US$
- Exhibits267: Research methodology
- Exhibits268: Information sources
- Exhibits269: Data validation
- Exhibits270: Validation techniques employed for market sizing
- Exhibits271: Data synthesis
- Exhibits272: 360 degree market analysis
- Exhibits273: List of abbreviations
The direct attached AI storage system market is forecasted to grow by USD 19,983.2 mn during 2024-2029, accelerating at a CAGR of 24.2% during the forecast period. The report on the direct attached AI storage system market provides a holistic analysis, market size and forecast, trends, growth drivers, and challenges, as well as vendor analysis covering around 25 vendors.
The report offers an up-to-date analysis regarding the current market scenario, the latest trends and drivers, and the overall market environment. The market is driven by imperative for low latency and high throughput, proliferation of data intensive generative AI and large models, and economic imperative to maximize compute roi.
| Market Scope | |
|---|---|
| Base Year | 2025 |
| End Year | 2029 |
| Series Year | 2025-2029 |
| Growth Momentum | Accelerate |
| YOY 2025 | 21.1% |
| CAGR | 24.2% |
| Incremental Value | $19,983.2 mn |
The study was conducted using an objective combination of primary and secondary information including inputs from key participants in the industry. The report contains a comprehensive market size data, segment with regional analysis and vendor landscape in addition to an analysis of the key companies. Reports have historic and forecast data.
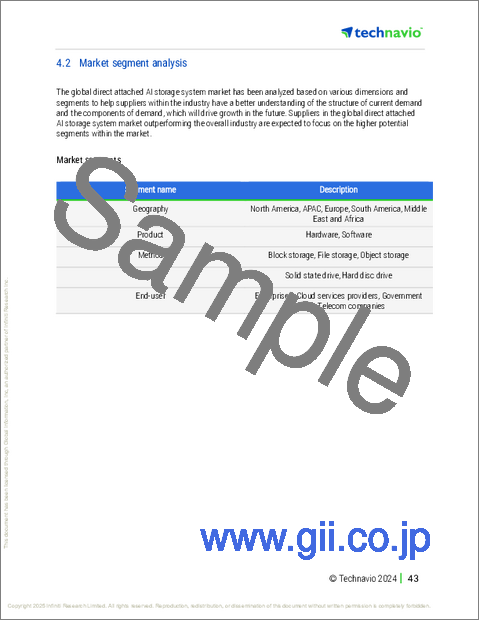
Technavio's direct attached AI storage system market is segmented as below:
By Product
- Hardware
- Software
By Method
- Block storage
- File storage
- Object storage
By Type
- Solid state drive
- Hard disc drive
By End-user
- Enterprises
- Cloud services providers
- Government bodies
- Telecom companies
By Geographical Landscape
- North America
- APAC
- Europe
- South America
- Middle East and Africa
This study identifies the drive towards petabyte scale, hyper-dense systems as one of the prime reasons driving the direct attached AI storage system market growth during the next few years. Also, software defined unification of das clusters and emergence of cxl for resource disaggregation will lead to sizable demand in the market.
The report on the direct attached AI storage system market covers the following areas:
- Direct Attached AI Storage System Market sizing
- Direct Attached AI Storage System Market forecast
- Direct Attached AI Storage System Market industry analysis
The robust vendor analysis is designed to help clients improve their market position, and in line with this, this report provides a detailed analysis of several leading direct attached AI storage system market vendors that include Amazon Web Services Inc., Dell Technologies Inc., Fujitsu Ltd., Google LLC, Hewlett Packard Enterprise Co., Hitachi Vantara LLC, International Business Machines Corp., Lenovo Group Ltd., Micron Technology Inc., Microsoft Corp., NetApp Inc., NVIDIA Corp., Pure Storage Inc., Samsung Electronics Co. Ltd., Seagate Technology LLC, StorONE Inc., Super Micro Computer Inc., Synology Inc., and Western Digital Corp. Also, the direct attached AI storage system market analysis report includes information on upcoming trends and challenges that will influence market growth. This is to help companies strategize and leverage all forthcoming growth opportunities.
The publisher presents a detailed picture of the market by the way of study, synthesis, and summation of data from multiple sources by an analysis of key parameters such as profit, pricing, competition, and promotions. It presents various market facets by identifying the key industry influencers. The data presented is comprehensive, reliable, and a result of extensive primary and secondary research. The market research reports provide a complete competitive landscape and an in-depth vendor selection methodology and analysis using qualitative and quantitative research to forecast accurate market growth.
Table of Contents
1 Executive Summary
- 1.1 Market overview
- Executive Summary - Chart on Market Overview
- Executive Summary - Data Table on Market Overview
- Executive Summary - Chart on Global Market Characteristics
- Executive Summary - Chart on Market By Geographical Landscape
- Executive Summary - Chart on Market Segmentation by Product
- Executive Summary - Chart on Market Segmentation by Method
- Executive Summary - Chart on Market Segmentation by Type
- Executive Summary - Chart on Market Segmentation by End-user
- Executive Summary - Chart on Incremental Growth
- Executive Summary - Data Table on Incremental Growth
- Executive Summary - Chart on Company Market Positioning
2 Technavio Analysis
- 2.1 Analysis of price sensitivity, lifecycle, customer purchase basket, adoption rates, and purchase criteria
- Analysis of price sensitivity, lifecycle, customer purchase basket, adoption rates, and purchase criteria
- 2.2 Criticality of inputs and Factors of differentiation
- Overview on criticality of inputs and factors of differentiation
- 2.3 Factors of disruption
- Overview on factors of disruption
- 2.4 Impact of drivers and challenges
- Impact of drivers and challenges in 2024 and 2029
3 Market Landscape
- 3.1 Market ecosystem
- Parent Market
- Data Table on - Parent Market
- 3.2 Market characteristics
- Market characteristics analysis
- 3.3 Value chain analysis
- Value chain analysis
4 Market Sizing
- 4.1 Market definition
- Offerings of companies included in the market definition
- 4.2 Market segment analysis
- Market segments
- 4.3 Market size 2024
- 4.4 Market outlook: Forecast for 2024-2029
- Chart on Global - Market size and forecast 2024-2029 ($ million)
- Data Table on Global - Market size and forecast 2024-2029 ($ million)
- Chart on Global Market: Year-over-year growth 2024-2029 (%)
- Data Table on Global Market: Year-over-year growth 2024-2029 (%)
5 Historic Market Size
- 5.1 Global Direct Attached AI Storage System Market 2019 - 2023
- Historic Market Size - Data Table on Global Direct Attached AI Storage System Market 2019 - 2023 ($ million)
- 5.2 Product segment analysis 2019 - 2023
- Historic Market Size - Product Segment 2019 - 2023 ($ million)
- 5.3 Method segment analysis 2019 - 2023
- Historic Market Size - Method Segment 2019 - 2023 ($ million)
- 5.4 Type segment analysis 2019 - 2023
- Historic Market Size - Type Segment 2019 - 2023 ($ million)
- 5.5 End-user segment analysis 2019 - 2023
- Historic Market Size - End-user Segment 2019 - 2023 ($ million)
- 5.6 Geography segment analysis 2019 - 2023
- Historic Market Size - Geography Segment 2019 - 2023 ($ million)
- 5.7 Country segment analysis 2019 - 2023
- Historic Market Size - Country Segment 2019 - 2023 ($ million)
6 Five Forces Analysis
- 6.1 Five forces summary
- Five forces analysis - Comparison between 2024 and 2029
- 6.2 Bargaining power of buyers
- Bargaining power of buyers - Impact of key factors 2024 and 2029
- 6.3 Bargaining power of suppliers
- Bargaining power of suppliers - Impact of key factors in 2024 and 2029
- 6.4 Threat of new entrants
- Threat of new entrants - Impact of key factors in 2024 and 2029
- 6.5 Threat of substitutes
- Threat of substitutes - Impact of key factors in 2024 and 2029
- 6.6 Threat of rivalry
- Threat of rivalry - Impact of key factors in 2024 and 2029
- 6.7 Market condition
- Chart on Market condition - Five forces 2024 and 2029
7 Market Segmentation by Product
- 7.1 Market segments
- Chart on Product - Market share 2024-2029 (%)
- Data Table on Product - Market share 2024-2029 (%)
- 7.2 Comparison by Product
- Chart on Comparison by Product
- Data Table on Comparison by Product
- 7.3 Hardware - Market size and forecast 2024-2029
- Chart on Hardware - Market size and forecast 2024-2029 ($ million)
- Data Table on Hardware - Market size and forecast 2024-2029 ($ million)
- Chart on Hardware - Year-over-year growth 2024-2029 (%)
- Data Table on Hardware - Year-over-year growth 2024-2029 (%)
- 7.4 Software - Market size and forecast 2024-2029
- Chart on Software - Market size and forecast 2024-2029 ($ million)
- Data Table on Software - Market size and forecast 2024-2029 ($ million)
- Chart on Software - Year-over-year growth 2024-2029 (%)
- Data Table on Software - Year-over-year growth 2024-2029 (%)
- 7.5 Market opportunity by Product
- Market opportunity by Product ($ million)
- Data Table on Market opportunity by Product ($ million)
8 Market Segmentation by Method
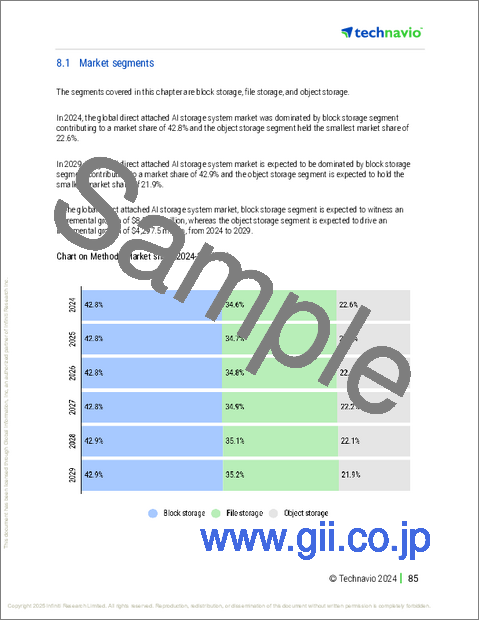
- 8.1 Market segments
- Chart on Method - Market share 2024-2029 (%)
- Data Table on Method - Market share 2024-2029 (%)
- 8.2 Comparison by Method
- Chart on Comparison by Method
- Data Table on Comparison by Method
- 8.3 Block storage - Market size and forecast 2024-2029
- Chart on Block storage - Market size and forecast 2024-2029 ($ million)
- Data Table on Block storage - Market size and forecast 2024-2029 ($ million)
- Chart on Block storage - Year-over-year growth 2024-2029 (%)
- Data Table on Block storage - Year-over-year growth 2024-2029 (%)
- 8.4 File storage - Market size and forecast 2024-2029
- Chart on File storage - Market size and forecast 2024-2029 ($ million)
- Data Table on File storage - Market size and forecast 2024-2029 ($ million)
- Chart on File storage - Year-over-year growth 2024-2029 (%)
- Data Table on File storage - Year-over-year growth 2024-2029 (%)
- 8.5 Object storage - Market size and forecast 2024-2029
- Chart on Object storage - Market size and forecast 2024-2029 ($ million)
- Data Table on Object storage - Market size and forecast 2024-2029 ($ million)
- Chart on Object storage - Year-over-year growth 2024-2029 (%)
- Data Table on Object storage - Year-over-year growth 2024-2029 (%)
- 8.6 Market opportunity by Method
- Market opportunity by Method ($ million)
- Data Table on Market opportunity by Method ($ million)
9 Market Segmentation by Type
- 9.1 Market segments
- Chart on Type - Market share 2024-2029 (%)
- Data Table on Type - Market share 2024-2029 (%)
- 9.2 Comparison by Type
- Chart on Comparison by Type
- Data Table on Comparison by Type
- 9.3 Solid state drive - Market size and forecast 2024-2029
- Chart on Solid state drive - Market size and forecast 2024-2029 ($ million)
- Data Table on Solid state drive - Market size and forecast 2024-2029 ($ million)
- Chart on Solid state drive - Year-over-year growth 2024-2029 (%)
- Data Table on Solid state drive - Year-over-year growth 2024-2029 (%)
- 9.4 Hard disc drive - Market size and forecast 2024-2029
- Chart on Hard disc drive - Market size and forecast 2024-2029 ($ million)
- Data Table on Hard disc drive - Market size and forecast 2024-2029 ($ million)
- Chart on Hard disc drive - Year-over-year growth 2024-2029 (%)
- Data Table on Hard disc drive - Year-over-year growth 2024-2029 (%)
- 9.5 Market opportunity by Type
- Market opportunity by Type ($ million)
- Data Table on Market opportunity by Type ($ million)
10 Market Segmentation by End-user
- 10.1 Market segments
- Chart on End-user - Market share 2024-2029 (%)
- Data Table on End-user - Market share 2024-2029 (%)
- 10.2 Comparison by End-user
- Chart on Comparison by End-user
- Data Table on Comparison by End-user
- 10.3 Enterprises - Market size and forecast 2024-2029
- Chart on Enterprises - Market size and forecast 2024-2029 ($ million)
- Data Table on Enterprises - Market size and forecast 2024-2029 ($ million)
- Chart on Enterprises - Year-over-year growth 2024-2029 (%)
- Data Table on Enterprises - Year-over-year growth 2024-2029 (%)
- 10.4 Cloud services providers - Market size and forecast 2024-2029
- Chart on Cloud services providers - Market size and forecast 2024-2029 ($ million)
- Data Table on Cloud services providers - Market size and forecast 2024-2029 ($ million)
- Chart on Cloud services providers - Year-over-year growth 2024-2029 (%)
- Data Table on Cloud services providers - Year-over-year growth 2024-2029 (%)
- 10.5 Government bodies - Market size and forecast 2024-2029
- Chart on Government bodies - Market size and forecast 2024-2029 ($ million)
- Data Table on Government bodies - Market size and forecast 2024-2029 ($ million)
- Chart on Government bodies - Year-over-year growth 2024-2029 (%)
- Data Table on Government bodies - Year-over-year growth 2024-2029 (%)
- 10.6 Telecom companies - Market size and forecast 2024-2029
- Chart on Telecom companies - Market size and forecast 2024-2029 ($ million)
- Data Table on Telecom companies - Market size and forecast 2024-2029 ($ million)
- Chart on Telecom companies - Year-over-year growth 2024-2029 (%)
- Data Table on Telecom companies - Year-over-year growth 2024-2029 (%)
- 10.7 Market opportunity by End-user
- Market opportunity by End-user ($ million)
- Data Table on Market opportunity by End-user ($ million)
11 Customer Landscape
- 11.1 Customer landscape overview
- Analysis of price sensitivity, lifecycle, customer purchase basket, adoption rates, and purchase criteria
12 Geographic Landscape
- 12.1 Geographic segmentation
- Chart on Market share By Geographical Landscape 2024-2029 (%)
- Data Table on Market share By Geographical Landscape 2024-2029 (%)
- 12.2 Geographic comparison
- Chart on Geographic comparison
- Data Table on Geographic comparison
- 12.3 North America - Market size and forecast 2024-2029
- Chart on North America - Market size and forecast 2024-2029 ($ million)
- Data Table on North America - Market size and forecast 2024-2029 ($ million)
- Chart on North America - Year-over-year growth 2024-2029 (%)
- Data Table on North America - Year-over-year growth 2024-2029 (%)
- 12.4 APAC - Market size and forecast 2024-2029
- Chart on APAC - Market size and forecast 2024-2029 ($ million)
- Data Table on APAC - Market size and forecast 2024-2029 ($ million)
- Chart on APAC - Year-over-year growth 2024-2029 (%)
- Data Table on APAC - Year-over-year growth 2024-2029 (%)
- 12.5 Europe - Market size and forecast 2024-2029
- Chart on Europe - Market size and forecast 2024-2029 ($ million)
- Data Table on Europe - Market size and forecast 2024-2029 ($ million)
- Chart on Europe - Year-over-year growth 2024-2029 (%)
- Data Table on Europe - Year-over-year growth 2024-2029 (%)
- 12.6 South America - Market size and forecast 2024-2029
- Chart on South America - Market size and forecast 2024-2029 ($ million)
- Data Table on South America - Market size and forecast 2024-2029 ($ million)
- Chart on South America - Year-over-year growth 2024-2029 (%)
- Data Table on South America - Year-over-year growth 2024-2029 (%)
- 12.7 Middle East and Africa - Market size and forecast 2024-2029
- Chart on Middle East and Africa - Market size and forecast 2024-2029 ($ million)
- Data Table on Middle East and Africa - Market size and forecast 2024-2029 ($ million)
- Chart on Middle East and Africa - Year-over-year growth 2024-2029 (%)
- Data Table on Middle East and Africa - Year-over-year growth 2024-2029 (%)
- 12.8 US - Market size and forecast 2024-2029
- Chart on US - Market size and forecast 2024-2029 ($ million)
- Data Table on US - Market size and forecast 2024-2029 ($ million)
- Chart on US - Year-over-year growth 2024-2029 (%)
- Data Table on US - Year-over-year growth 2024-2029 (%)
- 12.9 China - Market size and forecast 2024-2029
- Chart on China - Market size and forecast 2024-2029 ($ million)
- Data Table on China - Market size and forecast 2024-2029 ($ million)
- Chart on China - Year-over-year growth 2024-2029 (%)
- Data Table on China - Year-over-year growth 2024-2029 (%)
- 12.10 Japan - Market size and forecast 2024-2029
- Chart on Japan - Market size and forecast 2024-2029 ($ million)
- Data Table on Japan - Market size and forecast 2024-2029 ($ million)
- Chart on Japan - Year-over-year growth 2024-2029 (%)
- Data Table on Japan - Year-over-year growth 2024-2029 (%)
- 12.11 India - Market size and forecast 2024-2029
- Chart on India - Market size and forecast 2024-2029 ($ million)
- Data Table on India - Market size and forecast 2024-2029 ($ million)
- Chart on India - Year-over-year growth 2024-2029 (%)
- Data Table on India - Year-over-year growth 2024-2029 (%)
- 12.12 Germany - Market size and forecast 2024-2029
- Chart on Germany - Market size and forecast 2024-2029 ($ million)
- Data Table on Germany - Market size and forecast 2024-2029 ($ million)
- Chart on Germany - Year-over-year growth 2024-2029 (%)
- Data Table on Germany - Year-over-year growth 2024-2029 (%)
- 12.13 Canada - Market size and forecast 2024-2029
- Chart on Canada - Market size and forecast 2024-2029 ($ million)
- Data Table on Canada - Market size and forecast 2024-2029 ($ million)
- Chart on Canada - Year-over-year growth 2024-2029 (%)
- Data Table on Canada - Year-over-year growth 2024-2029 (%)
- 12.14 UK - Market size and forecast 2024-2029
- Chart on UK - Market size and forecast 2024-2029 ($ million)
- Data Table on UK - Market size and forecast 2024-2029 ($ million)
- Chart on UK - Year-over-year growth 2024-2029 (%)
- Data Table on UK - Year-over-year growth 2024-2029 (%)
- 12.15 South Korea - Market size and forecast 2024-2029
- Chart on South Korea - Market size and forecast 2024-2029 ($ million)
- Data Table on South Korea - Market size and forecast 2024-2029 ($ million)
- Chart on South Korea - Year-over-year growth 2024-2029 (%)
- Data Table on South Korea - Year-over-year growth 2024-2029 (%)
- 12.16 Brazil - Market size and forecast 2024-2029
- Chart on Brazil - Market size and forecast 2024-2029 ($ million)
- Data Table on Brazil - Market size and forecast 2024-2029 ($ million)
- Chart on Brazil - Year-over-year growth 2024-2029 (%)
- Data Table on Brazil - Year-over-year growth 2024-2029 (%)
- 12.17 France - Market size and forecast 2024-2029
- Chart on France - Market size and forecast 2024-2029 ($ million)
- Data Table on France - Market size and forecast 2024-2029 ($ million)
- Chart on France - Year-over-year growth 2024-2029 (%)
- Data Table on France - Year-over-year growth 2024-2029 (%)
- 12.18 Market opportunity By Geographical Landscape
- Market opportunity By Geographical Landscape ($ million)
- Data Tables on Market opportunity By Geographical Landscape ($ million)
13 Drivers, Challenges, and Opportunity/Restraints
- 13.1 Market drivers
- 13.2 Market challenges
- 13.3 Impact of drivers and challenges
- Impact of drivers and challenges in 2024 and 2029
- 13.4 Market opportunities/restraints
14 Competitive Landscape
- 14.1 Overview
- 14.2 Competitive Landscape
- Overview on criticality of inputs and factors of differentiation
- 14.3 Landscape disruption
- Overview on factors of disruption
- 14.4 Industry risks
- Impact of key risks on business
15 Competitive Analysis
- 15.1 Companies profiled
- Companies covered
- 15.2 Company ranking index
- Company ranking index
- 15.3 Market positioning of companies
- Matrix on companies position and classification
- 15.4 Amazon Web Services Inc.
- Amazon Web Services Inc. - Overview
- Amazon Web Services Inc. - Product / Service
- Amazon Web Services Inc. - Key news
- Amazon Web Services Inc. - Key offerings
- SWOT
- 15.5 Dell Technologies Inc.
- Dell Technologies Inc. - Overview
- Dell Technologies Inc. - Business segments
- Dell Technologies Inc. - Key news
- Dell Technologies Inc. - Key offerings
- Dell Technologies Inc. - Segment focus
- SWOT
- 15.6 Google LLC
- Google LLC - Overview
- Google LLC - Product / Service
- Google LLC - Key offerings
- SWOT
- 15.7 Hewlett Packard Enterprise Co.
- Hewlett Packard Enterprise Co. - Overview
- Hewlett Packard Enterprise Co. - Business segments
- Hewlett Packard Enterprise Co. - Key news
- Hewlett Packard Enterprise Co. - Key offerings
- Hewlett Packard Enterprise Co. - Segment focus
- SWOT
- 15.8 Hitachi Vantara LLC
- Hitachi Vantara LLC - Overview
- Hitachi Vantara LLC - Product / Service
- Hitachi Vantara LLC - Key news
- Hitachi Vantara LLC - Key offerings
- SWOT
- 15.9 International Business Machines Corp.
- International Business Machines Corp. - Overview
- International Business Machines Corp. - Business segments
- International Business Machines Corp. - Key news
- International Business Machines Corp. - Key offerings
- International Business Machines Corp. - Segment focus
- SWOT
- 15.10 Lenovo Group Ltd.
- Lenovo Group Ltd. - Overview
- Lenovo Group Ltd. - Business segments
- Lenovo Group Ltd. - Key news
- Lenovo Group Ltd. - Key offerings
- Lenovo Group Ltd. - Segment focus
- SWOT
- 15.11 Microsoft Corp.
- Microsoft Corp. - Overview
- Microsoft Corp. - Business segments
- Microsoft Corp. - Key news
- Microsoft Corp. - Key offerings
- Microsoft Corp. - Segment focus
- SWOT
- 15.12 NetApp Inc.
- NetApp Inc. - Overview
- NetApp Inc. - Product / Service
- NetApp Inc. - Key news
- NetApp Inc. - Key offerings
- SWOT
- 15.13 NVIDIA Corp.
- NVIDIA Corp. - Overview
- NVIDIA Corp. - Business segments
- NVIDIA Corp. - Key news
- NVIDIA Corp. - Key offerings
- NVIDIA Corp. - Segment focus
- SWOT
- 15.14 Pure Storage Inc.
- Pure Storage Inc. - Overview
- Pure Storage Inc. - Product / Service
- Pure Storage Inc. - Key news
- Pure Storage Inc. - Key offerings
- SWOT
- 15.15 Samsung Electronics Co. Ltd.
- Samsung Electronics Co. Ltd. - Overview
- Samsung Electronics Co. Ltd. - Business segments
- Samsung Electronics Co. Ltd. - Key news
- Samsung Electronics Co. Ltd. - Key offerings
- Samsung Electronics Co. Ltd. - Segment focus
- SWOT
- 15.16 Seagate Technology LLC
- Seagate Technology LLC - Overview
- Seagate Technology LLC - Product / Service
- Seagate Technology LLC - Key news
- Seagate Technology LLC - Key offerings
- SWOT
- 15.17 Super Micro Computer Inc.
- Super Micro Computer Inc. - Overview
- Super Micro Computer Inc. - Business segments
- Super Micro Computer Inc. - Key news
- Super Micro Computer Inc. - Key offerings
- Super Micro Computer Inc. - Segment focus
- SWOT
- 15.18 Western Digital Corp
- Western Digital Corp - Overview
- Western Digital Corp - Business segments
- Western Digital Corp - Key offerings
- Western Digital Corp - Segment focus
- SWOT
16 Appendix
- 16.1 Scope of the report
- 16.2 Inclusions and exclusions checklist
- Inclusions checklist
- Exclusions checklist
- 16.3 Currency conversion rates for US$
- Currency conversion rates for US$
- 16.4 Research methodology
- Research methodology
- 16.5 Data procurement
- Information sources
- 16.6 Data validation
- Data validation
- 16.7 Validation techniques employed for market sizing
- Validation techniques employed for market sizing
- 16.8 Data synthesis
- Data synthesis
- 16.9 360 degree market analysis
- 360 degree market analysis
- 16.10 List of abbreviations
- List of abbreviations
