|
|
市場調査レポート
商品コード
1756615
ニットとかぎ針編みの世界市場 2025年~2029年Global Knitting and Crochet Market 2025-2029 |
||||||

|
|||||||
カスタマイズ可能
|
|||||||


| ニットとかぎ針編みの世界市場 2025年~2029年 |
|
出版日: 2025年06月14日
発行: TechNavio
ページ情報: 英文 221 Pages
納期: 即納可能
|

全表示
- 概要
- 図表
- 目次
ニットとかぎ針編み市場は2024年~2029年に122億7,990万米ドル、予測期間中のCAGRは6.9%で成長すると予測されます。
当レポートでは、ニットとかぎ針編み市場の全体的な分析、市場規模・予測、動向、成長促進要因、課題、約25のベンダーを網羅したベンダー分析などを掲載しています。
現在の市場シナリオ、最新動向と促進要因、市場環境全体に関する最新分析を提供しています。市場は、研修や雇用機会への取り組み、編み物やファイバークラフトの健康効果、ソーシャルメディアを通じたニットとかぎ針編み製品の販売増加などが牽引しています。
| 市場範囲 | |
|---|---|
| 基準年 | 2025 |
| 終了年 | 2029 |
| 予測期間 | 2025-2029 |
| 成長モメンタム | 加速 |
| 前年比 | 6.4% |
| CAGR | 6.9% |
| 増分額 | 122億7,990万米ドル |
本調査は、業界の主要参加者からのインプットを含め、一次情報と二次情報を客観的に組み合わせて実施しました。本レポートには、主要企業の分析に加え、包括的な市場規模データ、地域分析によるセグメント、ベンダー情勢が含まれています。レポートには過去データと予測データがあります。
本調査では、編み機の技術革新が今後数年間のニットとかぎ針編み市場の成長を牽引する主要因の一つであると指摘しています。また、カフェにおける独創的なアプローチや新製品の発売は、市場の大きな需要につながると思われます。
目次
第1章 エグゼクティブサマリー
- 市場概要
第2章 Technavio分析
- 価格・ライフサイクル・顧客購入バスケット・採用率・購入基準の分析
- インプットの重要性と差別化の要因
- 混乱の要因
- 促進要因と課題の影響
第3章 市場情勢
- 市場エコシステム
- 市場の特徴
- バリューチェーン分析
第4章 市場規模
- 市場の定義
- 市場セグメント分析
- 市場規模 2024
- 市場の見通し 2024年~2029年
第5章 市場規模実績
- ニットとかぎ針編みの世界市場 2019年~2023年
- 用途別セグメント分析 2019年~2023年
- 流通チャネル別セグメント分析 2019年~2023年
- 材料別セグメント分析 2019年~2023年
- 地域別セグメント分析 2019年~2023年
- 国別セグメント分析 2019年~2023年
第6章 定性分析
- AIの影響:ニットとかぎ針編みの世界市場
第7章 ファイブフォース分析
- ファイブフォースの要約
- 買い手の交渉力
- 供給企業の交渉力
- 新規参入業者の脅威
- 代替品の脅威
- 競争の脅威
- 市況
第8章 市場セグメンテーション:用途別
- 市場セグメント
- 比較:用途別
- 衣服:市場規模と予測 2024年~2029年
- ホームテキスタイル:市場規模と予測 2024年~2029年
- 産業:市場規模と予測 2024年~2029年
- その他:市場規模と予測 2024年~2029年
- 市場機会:用途別
第9章 市場セグメンテーション:流通チャネル別
- 市場セグメント
- 比較:流通チャネル別
- オンライン:市場規模と予測 2024年~2029年
- オフライン:市場規模と予測 2024年~2029年
- 市場機会:流通チャネル別
第10章 市場セグメンテーション:材料別
- 市場セグメント
- 比較:材料別
- 天然繊維:市場規模と予測 2024年~2029年
- 合成繊維:市場規模と予測 2024年~2029年
- 混紡繊維:市場規模と予測 2024年~2029年
- 有機材料:市場規模と予測 2024年~2029年
- 市場機会:材料別
第11章 顧客情勢
- 顧客情勢の概要
第12章 地域別情勢
- 地域別セグメンテーション
- 地域別比較
- アジア太平洋:市場規模と予測 2024年~2029年
- 北米:市場規模と予測 2024年~2029年
- 欧州:市場規模と予測 2024年~2029年
- 南米:市場規模と予測 2024年~2029年
- 中東・アフリカ:市場規模と予測 2024年~2029年
- 中国:市場規模と予測 2024年~2029年
- 米国:市場規模と予測 2024年~2029年
- 日本:市場規模と予測 2024年~2029年
- インド:市場規模と予測 2024年~2029年
- オーストラリア:市場規模と予測 2024年~2029年
- ドイツ:市場規模と予測 2024年~2029年
- 英国:市場規模と予測 2024年~2029年
- ブラジル:市場規模と予測 2024年~2029年
- カナダ:市場規模と予測 2024年~2029年
- フランス:市場規模と予測 2024年~2029年
- 市場機会:地域情勢別
第13章 促進要因・課題・機会・抑制要因
- 市場促進要因
- 市場の課題
- 促進要因と課題の影響
- 市場の機会・抑制要因
第14章 競合情勢
- 概要
- 競合情勢
- 混乱の状況
- 業界のリスク
第15章 競合分析
- 企業プロファイル
- 企業ランキング指数
- 企業の市場ポジショニング
- ABHINANDAN KNITS PVT. LTD.
- Contempora Fabrics
- KPR Mill Ltd.
- Laguna Fabrics Inc.
- Lenzing AG
- Loyal Textile Mills Ltd.
- Pacific Textiles Holdings Ltd.
- Pine Crest Fabrics Inc.
- RSWM Ltd.
- Sivaraj Spinning Mills Pvt Ltd.
- TEEJAY LANKA PLC
- The LYCRA Co. LLC
- Tintex Textiles
- Toray Industries Inc.
- W.Ball and Son Ltd.
第16章 付録
Exhibits:
- Exhibits1: Executive Summary - Chart on Market Overview
- Exhibits2: Executive Summary - Data Table on Market Overview
- Exhibits3: Executive Summary - Chart on Global Market Characteristics
- Exhibits4: Executive Summary - Chart on Market By Geographical Landscape
- Exhibits5: Executive Summary - Chart on Market Segmentation by Application
- Exhibits6: Executive Summary - Chart on Market Segmentation by Distribution Channel
- Exhibits7: Executive Summary - Chart on Market Segmentation by Material
- Exhibits8: Executive Summary - Chart on Incremental Growth
- Exhibits9: Executive Summary - Data Table on Incremental Growth
- Exhibits10: Executive Summary - Chart on Company Market Positioning
- Exhibits11: Analysis of price sensitivity, lifecycle, customer purchase basket, adoption rates, and purchase criteria
- Exhibits12: Overview on criticality of inputs and factors of differentiation
- Exhibits13: Overview on factors of disruption
- Exhibits14: Impact of drivers and challenges in 2024 and 2029
- Exhibits15: Parent Market
- Exhibits16: Data Table on - Parent Market
- Exhibits17: Market characteristics analysis
- Exhibits18: Value chain analysis
- Exhibits19: Offerings of companies included in the market definition
- Exhibits20: Market segments
- Exhibits21: Chart on Global - Market size and forecast 2024-2029 ($ million)
- Exhibits22: Data Table on Global - Market size and forecast 2024-2029 ($ million)
- Exhibits23: Chart on Global Market: Year-over-year growth 2024-2029 (%)
- Exhibits24: Data Table on Global Market: Year-over-year growth 2024-2029 (%)
- Exhibits25: Historic Market Size - Data Table on Global Knitting And Crochet Market 2019 - 2023 ($ million)
- Exhibits26: Historic Market Size - Application Segment 2019 - 2023 ($ million)
- Exhibits27: Historic Market Size - Distribution Channel Segment 2019 - 2023 ($ million)
- Exhibits28: Historic Market Size - Material Segment 2019 - 2023 ($ million)
- Exhibits29: Historic Market Size - Geography Segment 2019 - 2023 ($ million)
- Exhibits30: Historic Market Size - Country Segment 2019 - 2023 ($ million)
- Exhibits31: Five forces analysis - Comparison between 2024 and 2029
- Exhibits32: Bargaining power of buyers - Impact of key factors 2024 and 2029
- Exhibits33: Bargaining power of suppliers - Impact of key factors in 2024 and 2029
- Exhibits34: Threat of new entrants - Impact of key factors in 2024 and 2029
- Exhibits35: Threat of substitutes - Impact of key factors in 2024 and 2029
- Exhibits36: Threat of rivalry - Impact of key factors in 2024 and 2029
- Exhibits37: Chart on Market condition - Five forces 2024 and 2029
- Exhibits38: Chart on Application - Market share 2024-2029 (%)
- Exhibits39: Data Table on Application - Market share 2024-2029 (%)
- Exhibits40: Chart on Comparison by Application
- Exhibits41: Data Table on Comparison by Application
- Exhibits42: Chart on Apparel - Market size and forecast 2024-2029 ($ million)
- Exhibits43: Data Table on Apparel - Market size and forecast 2024-2029 ($ million)
- Exhibits44: Chart on Apparel - Year-over-year growth 2024-2029 (%)
- Exhibits45: Data Table on Apparel - Year-over-year growth 2024-2029 (%)
- Exhibits46: Chart on Home textile - Market size and forecast 2024-2029 ($ million)
- Exhibits47: Data Table on Home textile - Market size and forecast 2024-2029 ($ million)
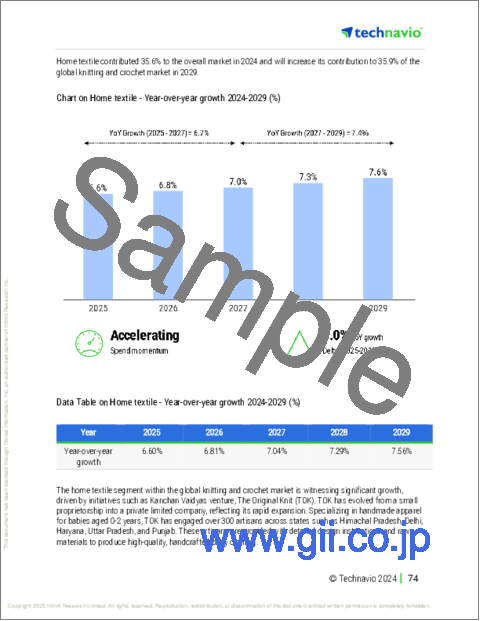
- Exhibits48: Chart on Home textile - Year-over-year growth 2024-2029 (%)
- Exhibits49: Data Table on Home textile - Year-over-year growth 2024-2029 (%)
- Exhibits50: Chart on Industrial - Market size and forecast 2024-2029 ($ million)
- Exhibits51: Data Table on Industrial - Market size and forecast 2024-2029 ($ million)
- Exhibits52: Chart on Industrial - Year-over-year growth 2024-2029 (%)
- Exhibits53: Data Table on Industrial - Year-over-year growth 2024-2029 (%)
- Exhibits54: Chart on Others - Market size and forecast 2024-2029 ($ million)
- Exhibits55: Data Table on Others - Market size and forecast 2024-2029 ($ million)
- Exhibits56: Chart on Others - Year-over-year growth 2024-2029 (%)
- Exhibits57: Data Table on Others - Year-over-year growth 2024-2029 (%)
- Exhibits58: Market opportunity by Application ($ million)
- Exhibits59: Data Table on Market opportunity by Application ($ million)
- Exhibits60: Chart on Distribution Channel - Market share 2024-2029 (%)
- Exhibits61: Data Table on Distribution Channel - Market share 2024-2029 (%)
- Exhibits62: Chart on Comparison by Distribution Channel
- Exhibits63: Data Table on Comparison by Distribution Channel
- Exhibits64: Chart on Online - Market size and forecast 2024-2029 ($ million)
- Exhibits65: Data Table on Online - Market size and forecast 2024-2029 ($ million)
- Exhibits66: Chart on Online - Year-over-year growth 2024-2029 (%)
- Exhibits67: Data Table on Online - Year-over-year growth 2024-2029 (%)
- Exhibits68: Chart on Offline - Market size and forecast 2024-2029 ($ million)
- Exhibits69: Data Table on Offline - Market size and forecast 2024-2029 ($ million)
- Exhibits70: Chart on Offline - Year-over-year growth 2024-2029 (%)
- Exhibits71: Data Table on Offline - Year-over-year growth 2024-2029 (%)
- Exhibits72: Market opportunity by Distribution Channel ($ million)
- Exhibits73: Data Table on Market opportunity by Distribution Channel ($ million)
- Exhibits74: Chart on Material - Market share 2024-2029 (%)
- Exhibits75: Data Table on Material - Market share 2024-2029 (%)
- Exhibits76: Chart on Comparison by Material
- Exhibits77: Data Table on Comparison by Material
- Exhibits78: Chart on Natural fibers - Market size and forecast 2024-2029 ($ million)
- Exhibits79: Data Table on Natural fibers - Market size and forecast 2024-2029 ($ million)
- Exhibits80: Chart on Natural fibers - Year-over-year growth 2024-2029 (%)
- Exhibits81: Data Table on Natural fibers - Year-over-year growth 2024-2029 (%)
- Exhibits82: Chart on Synthetic fibers - Market size and forecast 2024-2029 ($ million)
- Exhibits83: Data Table on Synthetic fibers - Market size and forecast 2024-2029 ($ million)
- Exhibits84: Chart on Synthetic fibers - Year-over-year growth 2024-2029 (%)
- Exhibits85: Data Table on Synthetic fibers - Year-over-year growth 2024-2029 (%)
- Exhibits86: Chart on Blended fibers - Market size and forecast 2024-2029 ($ million)
- Exhibits87: Data Table on Blended fibers - Market size and forecast 2024-2029 ($ million)
- Exhibits88: Chart on Blended fibers - Year-over-year growth 2024-2029 (%)
- Exhibits89: Data Table on Blended fibers - Year-over-year growth 2024-2029 (%)
- Exhibits90: Chart on Organic materials - Market size and forecast 2024-2029 ($ million)
- Exhibits91: Data Table on Organic materials - Market size and forecast 2024-2029 ($ million)
- Exhibits92: Chart on Organic materials - Year-over-year growth 2024-2029 (%)
- Exhibits93: Data Table on Organic materials - Year-over-year growth 2024-2029 (%)
- Exhibits94: Market opportunity by Material ($ million)
- Exhibits95: Data Table on Market opportunity by Material ($ million)
- Exhibits96: Analysis of price sensitivity, lifecycle, customer purchase basket, adoption rates, and purchase criteria
- Exhibits97: Chart on Market share By Geographical Landscape 2024-2029 (%)
- Exhibits98: Data Table on Market share By Geographical Landscape 2024-2029 (%)
- Exhibits99: Chart on Geographic comparison
- Exhibits100: Data Table on Geographic comparison
- Exhibits101: Chart on APAC - Market size and forecast 2024-2029 ($ million)
- Exhibits102: Data Table on APAC - Market size and forecast 2024-2029 ($ million)
- Exhibits103: Chart on APAC - Year-over-year growth 2024-2029 (%)
- Exhibits104: Data Table on APAC - Year-over-year growth 2024-2029 (%)
- Exhibits105: Chart on North America - Market size and forecast 2024-2029 ($ million)
- Exhibits106: Data Table on North America - Market size and forecast 2024-2029 ($ million)
- Exhibits107: Chart on North America - Year-over-year growth 2024-2029 (%)
- Exhibits108: Data Table on North America - Year-over-year growth 2024-2029 (%)
- Exhibits109: Chart on Europe - Market size and forecast 2024-2029 ($ million)
- Exhibits110: Data Table on Europe - Market size and forecast 2024-2029 ($ million)
- Exhibits111: Chart on Europe - Year-over-year growth 2024-2029 (%)
- Exhibits112: Data Table on Europe - Year-over-year growth 2024-2029 (%)
- Exhibits113: Chart on South America - Market size and forecast 2024-2029 ($ million)
- Exhibits114: Data Table on South America - Market size and forecast 2024-2029 ($ million)
- Exhibits115: Chart on South America - Year-over-year growth 2024-2029 (%)
- Exhibits116: Data Table on South America - Year-over-year growth 2024-2029 (%)
- Exhibits117: Chart on Middle East and Africa - Market size and forecast 2024-2029 ($ million)
- Exhibits118: Data Table on Middle East and Africa - Market size and forecast 2024-2029 ($ million)
- Exhibits119: Chart on Middle East and Africa - Year-over-year growth 2024-2029 (%)
- Exhibits120: Data Table on Middle East and Africa - Year-over-year growth 2024-2029 (%)
- Exhibits121: Chart on China - Market size and forecast 2024-2029 ($ million)
- Exhibits122: Data Table on China - Market size and forecast 2024-2029 ($ million)
- Exhibits123: Chart on China - Year-over-year growth 2024-2029 (%)
- Exhibits124: Data Table on China - Year-over-year growth 2024-2029 (%)
- Exhibits125: Chart on US - Market size and forecast 2024-2029 ($ million)
- Exhibits126: Data Table on US - Market size and forecast 2024-2029 ($ million)
- Exhibits127: Chart on US - Year-over-year growth 2024-2029 (%)
- Exhibits128: Data Table on US - Year-over-year growth 2024-2029 (%)
- Exhibits129: Chart on Japan - Market size and forecast 2024-2029 ($ million)
- Exhibits130: Data Table on Japan - Market size and forecast 2024-2029 ($ million)
- Exhibits131: Chart on Japan - Year-over-year growth 2024-2029 (%)
- Exhibits132: Data Table on Japan - Year-over-year growth 2024-2029 (%)
- Exhibits133: Chart on India - Market size and forecast 2024-2029 ($ million)
- Exhibits134: Data Table on India - Market size and forecast 2024-2029 ($ million)
- Exhibits135: Chart on India - Year-over-year growth 2024-2029 (%)
- Exhibits136: Data Table on India - Year-over-year growth 2024-2029 (%)
- Exhibits137: Chart on Australia - Market size and forecast 2024-2029 ($ million)
- Exhibits138: Data Table on Australia - Market size and forecast 2024-2029 ($ million)
- Exhibits139: Chart on Australia - Year-over-year growth 2024-2029 (%)
- Exhibits140: Data Table on Australia - Year-over-year growth 2024-2029 (%)
- Exhibits141: Chart on Germany - Market size and forecast 2024-2029 ($ million)
- Exhibits142: Data Table on Germany - Market size and forecast 2024-2029 ($ million)
- Exhibits143: Chart on Germany - Year-over-year growth 2024-2029 (%)
- Exhibits144: Data Table on Germany - Year-over-year growth 2024-2029 (%)
- Exhibits145: Chart on UK - Market size and forecast 2024-2029 ($ million)
- Exhibits146: Data Table on UK - Market size and forecast 2024-2029 ($ million)
- Exhibits147: Chart on UK - Year-over-year growth 2024-2029 (%)
- Exhibits148: Data Table on UK - Year-over-year growth 2024-2029 (%)
- Exhibits149: Chart on Brazil - Market size and forecast 2024-2029 ($ million)
- Exhibits150: Data Table on Brazil - Market size and forecast 2024-2029 ($ million)
- Exhibits151: Chart on Brazil - Year-over-year growth 2024-2029 (%)
- Exhibits152: Data Table on Brazil - Year-over-year growth 2024-2029 (%)
- Exhibits153: Chart on Canada - Market size and forecast 2024-2029 ($ million)
- Exhibits154: Data Table on Canada - Market size and forecast 2024-2029 ($ million)
- Exhibits155: Chart on Canada - Year-over-year growth 2024-2029 (%)
- Exhibits156: Data Table on Canada - Year-over-year growth 2024-2029 (%)
- Exhibits157: Chart on France - Market size and forecast 2024-2029 ($ million)
- Exhibits158: Data Table on France - Market size and forecast 2024-2029 ($ million)
- Exhibits159: Chart on France - Year-over-year growth 2024-2029 (%)
- Exhibits160: Data Table on France - Year-over-year growth 2024-2029 (%)
- Exhibits161: Market opportunity By Geographical Landscape ($ million)
- Exhibits162: Data Tables on Market opportunity By Geographical Landscape ($ million)
- Exhibits163: Impact of drivers and challenges in 2024 and 2029
- Exhibits164: Overview on criticality of inputs and factors of differentiation
- Exhibits165: Overview on factors of disruption
- Exhibits166: Impact of key risks on business
- Exhibits167: Companies covered
- Exhibits168: Company ranking index
- Exhibits169: Matrix on companies position and classification
- Exhibits170: ABHINANDAN KNITS PVT. LTD. - Overview
- Exhibits171: ABHINANDAN KNITS PVT. LTD. - Product / Service
- Exhibits172: ABHINANDAN KNITS PVT. LTD. - Key offerings
- Exhibits173: SWOT
- Exhibits174: Contempora Fabrics - Overview
- Exhibits175: Contempora Fabrics - Product / Service
- Exhibits176: Contempora Fabrics - Key offerings
- Exhibits177: SWOT
- Exhibits178: KPR Mill Ltd. - Overview
- Exhibits179: KPR Mill Ltd. - Product / Service
- Exhibits180: KPR Mill Ltd. - Key offerings
- Exhibits181: SWOT
- Exhibits182: Laguna Fabrics Inc. - Overview
- Exhibits183: Laguna Fabrics Inc. - Product / Service
- Exhibits184: Laguna Fabrics Inc. - Key offerings
- Exhibits185: SWOT
- Exhibits186: Lenzing AG - Overview
- Exhibits187: Lenzing AG - Business segments
- Exhibits188: Lenzing AG - Key offerings
- Exhibits189: Lenzing AG - Segment focus
- Exhibits190: SWOT
- Exhibits191: Loyal Textile Mills Ltd. - Overview
- Exhibits192: Loyal Textile Mills Ltd. - Business segments
- Exhibits193: Loyal Textile Mills Ltd. - Key offerings
- Exhibits194: Loyal Textile Mills Ltd. - Segment focus
- Exhibits195: SWOT
- Exhibits196: Pacific Textiles Holdings Ltd. - Overview
- Exhibits197: Pacific Textiles Holdings Ltd. - Product / Service
- Exhibits198: Pacific Textiles Holdings Ltd. - Key offerings
- Exhibits199: SWOT
- Exhibits200: Pine Crest Fabrics Inc. - Overview
- Exhibits201: Pine Crest Fabrics Inc. - Product / Service
- Exhibits202: Pine Crest Fabrics Inc. - Key offerings
- Exhibits203: SWOT
- Exhibits204: RSWM Ltd. - Overview
- Exhibits205: RSWM Ltd. - Business segments
- Exhibits206: RSWM Ltd. - Key offerings
- Exhibits207: RSWM Ltd. - Segment focus
- Exhibits208: SWOT
- Exhibits209: Sivaraj Spinning Mills Pvt Ltd. - Overview
- Exhibits210: Sivaraj Spinning Mills Pvt Ltd. - Product / Service
- Exhibits211: Sivaraj Spinning Mills Pvt Ltd. - Key offerings
- Exhibits212: SWOT
- Exhibits213: TEEJAY LANKA PLC - Overview
- Exhibits214: TEEJAY LANKA PLC - Business segments
- Exhibits215: TEEJAY LANKA PLC - Key offerings
- Exhibits216: TEEJAY LANKA PLC - Segment focus
- Exhibits217: SWOT
- Exhibits218: The LYCRA Co. LLC - Overview
- Exhibits219: The LYCRA Co. LLC - Product / Service
- Exhibits220: The LYCRA Co. LLC - Key offerings
- Exhibits221: SWOT
- Exhibits222: Tintex Textiles - Overview
- Exhibits223: Tintex Textiles - Product / Service
- Exhibits224: Tintex Textiles - Key offerings
- Exhibits225: SWOT
- Exhibits226: Toray Industries Inc. - Overview
- Exhibits227: Toray Industries Inc. - Business segments
- Exhibits228: Toray Industries Inc. - Key news
- Exhibits229: Toray Industries Inc. - Key offerings
- Exhibits230: Toray Industries Inc. - Segment focus
- Exhibits231: SWOT
- Exhibits232: W.Ball and Son Ltd. - Overview
- Exhibits233: W.Ball and Son Ltd. - Product / Service
- Exhibits234: W.Ball and Son Ltd. - Key offerings
- Exhibits235: SWOT
- Exhibits236: Inclusions checklist
- Exhibits237: Exclusions checklist
- Exhibits238: Currency conversion rates for US$
- Exhibits239: Research methodology
- Exhibits240: Information sources
- Exhibits241: Data validation
- Exhibits242: Validation techniques employed for market sizing
- Exhibits243: Data synthesis
- Exhibits244: 360 degree market analysis
- Exhibits245: List of abbreviations
The knitting and crochet market is forecasted to grow by USD 12,279.9 mn during 2024-2029, accelerating at a CAGR of 6.9% during the forecast period. The report on the knitting and crochet market provides a holistic analysis, market size and forecast, trends, growth drivers, and challenges, as well as vendor analysis covering around 25 vendors.
The report offers an up-to-date analysis regarding the current market scenario, the latest trends and drivers, and the overall market environment. The market is driven by initiatives for training and employment opportunities, health benefits of knitting and fiber crafts, and increasing sales of knitting and crochet products through social media.
| Market Scope | |
|---|---|
| Base Year | 2025 |
| End Year | 2029 |
| Series Year | 2025-2029 |
| Growth Momentum | Accelerate |
| YOY 2025 | 6.4% |
| CAGR | 6.9% |
| Incremental Value | $12,279.9 mn |
The study was conducted using an objective combination of primary and secondary information including inputs from key participants in the industry. The report contains a comprehensive market size data, segment with regional analysis and vendor landscape in addition to an analysis of the key companies. Reports have historic and forecast data.
Technavio's knitting and crochet market is segmented as below:
By Application
- Apparel
- Home textile
- Industrial
- Others
By Distribution Channel
- Online
- Offline
By Material
- Natural fibers
- Synthetic fibers
- Blended fibers
- Organic materials
By Geographical Landscape
- APAC
- North America
- Europe
- South America
- Middle East and Africa
This study identifies the innovations in knitting machines as one of the prime reasons driving the knitting and crochet market growth during the next few years. Also, creative approaches in cafes and new product launches will lead to sizable demand in the market.
The report on the knitting and crochet market covers the following areas:
- Knitting And Crochet Market sizing
- Knitting And Crochet Market forecast
- Knitting And Crochet Market industry analysis
The robust vendor analysis is designed to help clients improve their market position, and in line with this, this report provides a detailed analysis of several leading knitting and crochet market vendors that include Aarti International Ltd, ABHINANDAN KNITS PVT. LTD., Contempora Fabrics, KD Fabrics and Apparel, KPR Mill Ltd., Laguna Fabrics Inc., Lenzing AG, Loyal Textile Mills Ltd., Marvel Vinyls Ltd., Pacific Textiles Holdings Ltd., Pine Crest Fabrics Inc., Response Fabrics Pvt. Ltd., RSWM Ltd., Sahni Fabs, Sivaraj Spinning Mills Pvt Ltd., TEEJAY LANKA PLC, The LYCRA Co. LLC, Tintex Textiles, Toray Industries Inc., and W.Ball and Son Ltd.. Also, the knitting and crochet market analysis report includes information on upcoming trends and challenges that will influence market growth. This is to help companies strategize and leverage all forthcoming growth opportunities.
The publisher presents a detailed picture of the market by the way of study, synthesis, and summation of data from multiple sources by an analysis of key parameters such as profit, pricing, competition, and promotions. It presents various market facets by identifying the key industry influencers. The data presented is comprehensive, reliable, and a result of extensive primary and secondary research. The market research reports provide a complete competitive landscape and an in-depth vendor selection methodology and analysis using qualitative and quantitative research to forecast accurate market growth.
Table of Contents
1 Executive Summary
- 1.1 Market overview
- Executive Summary - Chart on Market Overview
- Executive Summary - Data Table on Market Overview
- Executive Summary - Chart on Global Market Characteristics
- Executive Summary - Chart on Market By Geographical Landscape
- Executive Summary - Chart on Market Segmentation by Application
- Executive Summary - Chart on Market Segmentation by Distribution Channel
- Executive Summary - Chart on Market Segmentation by Material
- Executive Summary - Chart on Incremental Growth
- Executive Summary - Data Table on Incremental Growth
- Executive Summary - Chart on Company Market Positioning
2 Technavio Analysis
- 2.1 Analysis of price sensitivity, lifecycle, customer purchase basket, adoption rates, and purchase criteria
- Analysis of price sensitivity, lifecycle, customer purchase basket, adoption rates, and purchase criteria
- 2.2 Criticality of inputs and Factors of differentiation
- Overview on criticality of inputs and factors of differentiation
- 2.3 Factors of disruption
- Overview on factors of disruption
- 2.4 Impact of drivers and challenges
- Impact of drivers and challenges in 2024 and 2029
3 Market Landscape
- 3.1 Market ecosystem
- Parent Market
- Data Table on - Parent Market
- 3.2 Market characteristics
- Market characteristics analysis
- 3.3 Value chain analysis
- Value chain analysis
4 Market Sizing
- 4.1 Market definition
- Offerings of companies included in the market definition
- 4.2 Market segment analysis
- Market segments
- 4.3 Market size 2024
- 4.4 Market outlook: Forecast for 2024-2029
- Chart on Global - Market size and forecast 2024-2029 ($ million)
- Data Table on Global - Market size and forecast 2024-2029 ($ million)
- Chart on Global Market: Year-over-year growth 2024-2029 (%)
- Data Table on Global Market: Year-over-year growth 2024-2029 (%)
5 Historic Market Size
- 5.1 Global Knitting And Crochet Market 2019 - 2023
- Historic Market Size - Data Table on Global Knitting And Crochet Market 2019 - 2023 ($ million)
- 5.2 Application segment analysis 2019 - 2023
- Historic Market Size - Application Segment 2019 - 2023 ($ million)
- 5.3 Distribution Channel segment analysis 2019 - 2023
- Historic Market Size - Distribution Channel Segment 2019 - 2023 ($ million)
- 5.4 Material segment analysis 2019 - 2023
- Historic Market Size - Material Segment 2019 - 2023 ($ million)
- 5.5 Geography segment analysis 2019 - 2023
- Historic Market Size - Geography Segment 2019 - 2023 ($ million)
- 5.6 Country segment analysis 2019 - 2023
- Historic Market Size - Country Segment 2019 - 2023 ($ million)
6 Qualitative Analysis
- 6.1 The AI impact on Global Knitting and Crochet Market
7 Five Forces Analysis
- 7.1 Five forces summary
- Five forces analysis - Comparison between 2024 and 2029
- 7.2 Bargaining power of buyers
- Bargaining power of buyers - Impact of key factors 2024 and 2029
- 7.3 Bargaining power of suppliers
- Bargaining power of suppliers - Impact of key factors in 2024 and 2029
- 7.4 Threat of new entrants
- Threat of new entrants - Impact of key factors in 2024 and 2029
- 7.5 Threat of substitutes
- Threat of substitutes - Impact of key factors in 2024 and 2029
- 7.6 Threat of rivalry
- Threat of rivalry - Impact of key factors in 2024 and 2029
- 7.7 Market condition
- Chart on Market condition - Five forces 2024 and 2029
8 Market Segmentation by Application
- 8.1 Market segments
- Chart on Application - Market share 2024-2029 (%)
- Data Table on Application - Market share 2024-2029 (%)
- 8.2 Comparison by Application
- Chart on Comparison by Application
- Data Table on Comparison by Application
- 8.3 Apparel - Market size and forecast 2024-2029
- Chart on Apparel - Market size and forecast 2024-2029 ($ million)
- Data Table on Apparel - Market size and forecast 2024-2029 ($ million)
- Chart on Apparel - Year-over-year growth 2024-2029 (%)
- Data Table on Apparel - Year-over-year growth 2024-2029 (%)
- 8.4 Home textile - Market size and forecast 2024-2029
- Chart on Home textile - Market size and forecast 2024-2029 ($ million)
- Data Table on Home textile - Market size and forecast 2024-2029 ($ million)
- Chart on Home textile - Year-over-year growth 2024-2029 (%)
- Data Table on Home textile - Year-over-year growth 2024-2029 (%)
- 8.5 Industrial - Market size and forecast 2024-2029
- Chart on Industrial - Market size and forecast 2024-2029 ($ million)
- Data Table on Industrial - Market size and forecast 2024-2029 ($ million)
- Chart on Industrial - Year-over-year growth 2024-2029 (%)
- Data Table on Industrial - Year-over-year growth 2024-2029 (%)
- 8.6 Others - Market size and forecast 2024-2029
- Chart on Others - Market size and forecast 2024-2029 ($ million)
- Data Table on Others - Market size and forecast 2024-2029 ($ million)
- Chart on Others - Year-over-year growth 2024-2029 (%)
- Data Table on Others - Year-over-year growth 2024-2029 (%)
- 8.7 Market opportunity by Application
- Market opportunity by Application ($ million)
- Data Table on Market opportunity by Application ($ million)
9 Market Segmentation by Distribution Channel
- 9.1 Market segments
- Chart on Distribution Channel - Market share 2024-2029 (%)
- Data Table on Distribution Channel - Market share 2024-2029 (%)
- 9.2 Comparison by Distribution Channel
- Chart on Comparison by Distribution Channel
- Data Table on Comparison by Distribution Channel
- 9.3 Online - Market size and forecast 2024-2029
- Chart on Online - Market size and forecast 2024-2029 ($ million)
- Data Table on Online - Market size and forecast 2024-2029 ($ million)
- Chart on Online - Year-over-year growth 2024-2029 (%)
- Data Table on Online - Year-over-year growth 2024-2029 (%)
- 9.4 Offline - Market size and forecast 2024-2029
- Chart on Offline - Market size and forecast 2024-2029 ($ million)
- Data Table on Offline - Market size and forecast 2024-2029 ($ million)
- Chart on Offline - Year-over-year growth 2024-2029 (%)
- Data Table on Offline - Year-over-year growth 2024-2029 (%)
- 9.5 Market opportunity by Distribution Channel
- Market opportunity by Distribution Channel ($ million)
- Data Table on Market opportunity by Distribution Channel ($ million)
10 Market Segmentation by Material
- 10.1 Market segments
- Chart on Material - Market share 2024-2029 (%)
- Data Table on Material - Market share 2024-2029 (%)
- 10.2 Comparison by Material
- Chart on Comparison by Material
- Data Table on Comparison by Material
- 10.3 Natural fibers - Market size and forecast 2024-2029
- Chart on Natural fibers - Market size and forecast 2024-2029 ($ million)
- Data Table on Natural fibers - Market size and forecast 2024-2029 ($ million)
- Chart on Natural fibers - Year-over-year growth 2024-2029 (%)
- Data Table on Natural fibers - Year-over-year growth 2024-2029 (%)
- 10.4 Synthetic fibers - Market size and forecast 2024-2029
- Chart on Synthetic fibers - Market size and forecast 2024-2029 ($ million)
- Data Table on Synthetic fibers - Market size and forecast 2024-2029 ($ million)
- Chart on Synthetic fibers - Year-over-year growth 2024-2029 (%)
- Data Table on Synthetic fibers - Year-over-year growth 2024-2029 (%)
- 10.5 Blended fibers - Market size and forecast 2024-2029
- Chart on Blended fibers - Market size and forecast 2024-2029 ($ million)
- Data Table on Blended fibers - Market size and forecast 2024-2029 ($ million)
- Chart on Blended fibers - Year-over-year growth 2024-2029 (%)
- Data Table on Blended fibers - Year-over-year growth 2024-2029 (%)
- 10.6 Organic materials - Market size and forecast 2024-2029
- Chart on Organic materials - Market size and forecast 2024-2029 ($ million)
- Data Table on Organic materials - Market size and forecast 2024-2029 ($ million)
- Chart on Organic materials - Year-over-year growth 2024-2029 (%)
- Data Table on Organic materials - Year-over-year growth 2024-2029 (%)
- 10.7 Market opportunity by Material
- Market opportunity by Material ($ million)
- Data Table on Market opportunity by Material ($ million)
11 Customer Landscape
- 11.1 Customer landscape overview
- Analysis of price sensitivity, lifecycle, customer purchase basket, adoption rates, and purchase criteria
12 Geographic Landscape
- 12.1 Geographic segmentation
- Chart on Market share By Geographical Landscape 2024-2029 (%)
- Data Table on Market share By Geographical Landscape 2024-2029 (%)
- 12.2 Geographic comparison
- Chart on Geographic comparison
- Data Table on Geographic comparison
- 12.3 APAC - Market size and forecast 2024-2029
- Chart on APAC - Market size and forecast 2024-2029 ($ million)
- Data Table on APAC - Market size and forecast 2024-2029 ($ million)
- Chart on APAC - Year-over-year growth 2024-2029 (%)
- Data Table on APAC - Year-over-year growth 2024-2029 (%)
- 12.4 North America - Market size and forecast 2024-2029
- Chart on North America - Market size and forecast 2024-2029 ($ million)
- Data Table on North America - Market size and forecast 2024-2029 ($ million)
- Chart on North America - Year-over-year growth 2024-2029 (%)
- Data Table on North America - Year-over-year growth 2024-2029 (%)
- 12.5 Europe - Market size and forecast 2024-2029
- Chart on Europe - Market size and forecast 2024-2029 ($ million)
- Data Table on Europe - Market size and forecast 2024-2029 ($ million)
- Chart on Europe - Year-over-year growth 2024-2029 (%)
- Data Table on Europe - Year-over-year growth 2024-2029 (%)
- 12.6 South America - Market size and forecast 2024-2029
- Chart on South America - Market size and forecast 2024-2029 ($ million)
- Data Table on South America - Market size and forecast 2024-2029 ($ million)
- Chart on South America - Year-over-year growth 2024-2029 (%)
- Data Table on South America - Year-over-year growth 2024-2029 (%)
- 12.7 Middle East and Africa - Market size and forecast 2024-2029
- Chart on Middle East and Africa - Market size and forecast 2024-2029 ($ million)
- Data Table on Middle East and Africa - Market size and forecast 2024-2029 ($ million)
- Chart on Middle East and Africa - Year-over-year growth 2024-2029 (%)
- Data Table on Middle East and Africa - Year-over-year growth 2024-2029 (%)
- 12.8 China - Market size and forecast 2024-2029
- Chart on China - Market size and forecast 2024-2029 ($ million)
- Data Table on China - Market size and forecast 2024-2029 ($ million)
- Chart on China - Year-over-year growth 2024-2029 (%)
- Data Table on China - Year-over-year growth 2024-2029 (%)
- 12.9 US - Market size and forecast 2024-2029
- Chart on US - Market size and forecast 2024-2029 ($ million)
- Data Table on US - Market size and forecast 2024-2029 ($ million)
- Chart on US - Year-over-year growth 2024-2029 (%)
- Data Table on US - Year-over-year growth 2024-2029 (%)
- 12.10 Japan - Market size and forecast 2024-2029
- Chart on Japan - Market size and forecast 2024-2029 ($ million)
- Data Table on Japan - Market size and forecast 2024-2029 ($ million)
- Chart on Japan - Year-over-year growth 2024-2029 (%)
- Data Table on Japan - Year-over-year growth 2024-2029 (%)
- 12.11 India - Market size and forecast 2024-2029
- Chart on India - Market size and forecast 2024-2029 ($ million)
- Data Table on India - Market size and forecast 2024-2029 ($ million)
- Chart on India - Year-over-year growth 2024-2029 (%)
- Data Table on India - Year-over-year growth 2024-2029 (%)
- 12.12 Australia - Market size and forecast 2024-2029
- Chart on Australia - Market size and forecast 2024-2029 ($ million)
- Data Table on Australia - Market size and forecast 2024-2029 ($ million)
- Chart on Australia - Year-over-year growth 2024-2029 (%)
- Data Table on Australia - Year-over-year growth 2024-2029 (%)
- 12.13 Germany - Market size and forecast 2024-2029
- Chart on Germany - Market size and forecast 2024-2029 ($ million)
- Data Table on Germany - Market size and forecast 2024-2029 ($ million)
- Chart on Germany - Year-over-year growth 2024-2029 (%)
- Data Table on Germany - Year-over-year growth 2024-2029 (%)
- 12.14 UK - Market size and forecast 2024-2029
- Chart on UK - Market size and forecast 2024-2029 ($ million)
- Data Table on UK - Market size and forecast 2024-2029 ($ million)
- Chart on UK - Year-over-year growth 2024-2029 (%)
- Data Table on UK - Year-over-year growth 2024-2029 (%)
- 12.15 Brazil - Market size and forecast 2024-2029
- Chart on Brazil - Market size and forecast 2024-2029 ($ million)
- Data Table on Brazil - Market size and forecast 2024-2029 ($ million)
- Chart on Brazil - Year-over-year growth 2024-2029 (%)
- Data Table on Brazil - Year-over-year growth 2024-2029 (%)
- 12.16 Canada - Market size and forecast 2024-2029
- Chart on Canada - Market size and forecast 2024-2029 ($ million)
- Data Table on Canada - Market size and forecast 2024-2029 ($ million)
- Chart on Canada - Year-over-year growth 2024-2029 (%)
- Data Table on Canada - Year-over-year growth 2024-2029 (%)
- 12.17 France - Market size and forecast 2024-2029
- Chart on France - Market size and forecast 2024-2029 ($ million)
- Data Table on France - Market size and forecast 2024-2029 ($ million)
- Chart on France - Year-over-year growth 2024-2029 (%)
- Data Table on France - Year-over-year growth 2024-2029 (%)
- 12.18 Market opportunity By Geographical Landscape
- Market opportunity By Geographical Landscape ($ million)
- Data Tables on Market opportunity By Geographical Landscape ($ million)
13 Drivers, Challenges, and Opportunity/Restraints
- 13.1 Market drivers
- 13.2 Market challenges
- 13.3 Impact of drivers and challenges
- Impact of drivers and challenges in 2024 and 2029
- 13.4 Market opportunities/restraints
14 Competitive Landscape
- 14.1 Overview
- 14.2 Competitive Landscape
- Overview on criticality of inputs and factors of differentiation
- 14.3 Landscape disruption
- Overview on factors of disruption
- 14.4 Industry risks
- Impact of key risks on business
15 Competitive Analysis
- 15.1 Companies profiled
- Companies covered
- 15.2 Company ranking index
- Company ranking index
- 15.3 Market positioning of companies
- Matrix on companies position and classification
- 15.4 ABHINANDAN KNITS PVT. LTD.
- ABHINANDAN KNITS PVT. LTD. - Overview
- ABHINANDAN KNITS PVT. LTD. - Product / Service
- ABHINANDAN KNITS PVT. LTD. - Key offerings
- SWOT
- 15.5 Contempora Fabrics
- Contempora Fabrics - Overview
- Contempora Fabrics - Product / Service
- Contempora Fabrics - Key offerings
- SWOT
- 15.6 KPR Mill Ltd.
- KPR Mill Ltd. - Overview
- KPR Mill Ltd. - Product / Service
- KPR Mill Ltd. - Key offerings
- SWOT
- 15.7 Laguna Fabrics Inc.
- Laguna Fabrics Inc. - Overview
- Laguna Fabrics Inc. - Product / Service
- Laguna Fabrics Inc. - Key offerings
- SWOT
- 15.8 Lenzing AG
- Lenzing AG - Overview
- Lenzing AG - Business segments
- Lenzing AG - Key offerings
- Lenzing AG - Segment focus
- SWOT
- 15.9 Loyal Textile Mills Ltd.
- Loyal Textile Mills Ltd. - Overview
- Loyal Textile Mills Ltd. - Business segments
- Loyal Textile Mills Ltd. - Key offerings
- Loyal Textile Mills Ltd. - Segment focus
- SWOT
- 15.10 Pacific Textiles Holdings Ltd.
- Pacific Textiles Holdings Ltd. - Overview
- Pacific Textiles Holdings Ltd. - Product / Service
- Pacific Textiles Holdings Ltd. - Key offerings
- SWOT
- 15.11 Pine Crest Fabrics Inc.
- Pine Crest Fabrics Inc. - Overview
- Pine Crest Fabrics Inc. - Product / Service
- Pine Crest Fabrics Inc. - Key offerings
- SWOT
- 15.12 RSWM Ltd.
- RSWM Ltd. - Overview
- RSWM Ltd. - Business segments
- RSWM Ltd. - Key offerings
- RSWM Ltd. - Segment focus
- SWOT
- 15.13 Sivaraj Spinning Mills Pvt Ltd.
- Sivaraj Spinning Mills Pvt Ltd. - Overview
- Sivaraj Spinning Mills Pvt Ltd. - Product / Service
- Sivaraj Spinning Mills Pvt Ltd. - Key offerings
- SWOT
- 15.14 TEEJAY LANKA PLC
- TEEJAY LANKA PLC - Overview
- TEEJAY LANKA PLC - Business segments
- TEEJAY LANKA PLC - Key offerings
- TEEJAY LANKA PLC - Segment focus
- SWOT
- 15.15 The LYCRA Co. LLC
- The LYCRA Co. LLC - Overview
- The LYCRA Co. LLC - Product / Service
- The LYCRA Co. LLC - Key offerings
- SWOT
- 15.16 Tintex Textiles
- Tintex Textiles - Overview
- Tintex Textiles - Product / Service
- Tintex Textiles - Key offerings
- SWOT
- 15.17 Toray Industries Inc.
- Toray Industries Inc. - Overview
- Toray Industries Inc. - Business segments
- Toray Industries Inc. - Key news
- Toray Industries Inc. - Key offerings
- Toray Industries Inc. - Segment focus
- SWOT
- 15.18 W.Ball and Son Ltd.
- W.Ball and Son Ltd. - Overview
- W.Ball and Son Ltd. - Product / Service
- W.Ball and Son Ltd. - Key offerings
- SWOT
16 Appendix
- 16.1 Scope of the report
- 16.2 Inclusions and exclusions checklist
- Inclusions checklist
- Exclusions checklist
- 16.3 Currency conversion rates for US$
- Currency conversion rates for US$
- 16.4 Research methodology
- Research methodology
- 16.5 Data procurement
- Information sources
- 16.6 Data validation
- Data validation
- 16.7 Validation techniques employed for market sizing
- Validation techniques employed for market sizing
- 16.8 Data synthesis
- Data synthesis
- 16.9 360 degree market analysis
- 360 degree market analysis
- 16.10 List of abbreviations
- List of abbreviations
