|
|
市場調査レポート
商品コード
1738130
二輪車用電子制御ユニット(ECU)の世界市場 2025-2029Global Two-wheeler Electronic Control Unit (ECU) Market 2025-2029 |
||||||

|
|||||||
カスタマイズ可能
|
|||||||


| 二輪車用電子制御ユニット(ECU)の世界市場 2025-2029 |
|
出版日: 2025年05月24日
発行: TechNavio
ページ情報: 英文 230 Pages
納期: 即納可能
|

全表示
- 概要
- 図表
- 目次
二輪車用電子制御ユニット(ECU)市場は2024-2029年に179億米ドル、予測期間中のCAGRは4.4%で成長すると予測されます。
当レポートでは、二輪車用電子制御ユニット(ECU)市場の全体的な分析、市場規模・予測、動向、成長促進要因、課題、約25のベンダーを網羅したベンダー分析などを掲載しています。
現在の市場シナリオ、最新動向と促進要因、市場環境全体に関する最新分析を提供しています。市場は、機械部品の電動化の進展、低燃費二輪車需要の増加、二輪車の安全性と安定性への注目の高まりによって牽引されています。
| 市場範囲 | |
|---|---|
| 基準年 | 2025 |
| 終了年 | 2029 |
| 予測期間 | 2025-2029 |
| 成長モメンタム | 加速 |
| 前年比 | 4.2% |
| CAGR | 4.4% |
| 増分額 | 179億米ドル |
本調査は、業界の主要参加者からのインプットを含め、一次情報と二次情報を客観的に組み合わせて実施しました。レポートには、主要企業の分析に加え、包括的な市場規模データ、地域別分析によるセグメント、ベンダー情勢が含まれています。レポートにはヒストリカルデータと予測データがあります。
本調査では、今後数年間の二輪車用電子制御ユニット(ECU)市場の成長を促進する主な理由の一つとして、二輪車診断のためのスマートフォン接続性を挙げています。また、手頃な価格のEMSが利用可能になり、接続された二輪車でEcusが使用されることで、市場の大きな需要が見込まれます。
目次
第1章 エグゼクティブサマリー
- 市場概要
第2章 Technavio分析
- 価格・ライフサイクル・顧客購入バスケット・採用率・購入基準の分析
- インプットの重要性と差別化の要因
- 混乱の要因
- 促進要因と課題の影響
第3章 市場情勢
- 市場エコシステム
- 市場の特徴
- バリューチェーン分析
第4章 市場規模
- 市場の定義
- 市場セグメント分析
- 市場規模 2024
- 市場の見通し 2024-2029
第5章 市場規模実績
- 二輪車用電子制御ユニット(ECU)の世界市場 2019-2023
- エンドユーザーセグメント分析 2019-2023
- 車両タイプセグメント分析 2019-2023
- 技術セグメント分析 2019-2023
- 地域別セグメント分析 2019-2023
- 国別セグメント分析 2019-2023
第6章 定性分析
- AIの影響:二輪車用電子制御ユニット(ECU)の世界市場
第7章 ファイブフォース分析
- ファイブフォースの要約
- 買い手の交渉力
- 供給企業の交渉力
- 新規参入業者の脅威
- 代替品の脅威
- 競争の脅威
- 市況
第8章 市場セグメンテーション:エンドユーザー別
- 市場セグメント
- 比較:エンドユーザー別
- 通勤者:市場規模と予測 2024-2029
- ミッドプレミアム:市場規模と予測 2024-2029
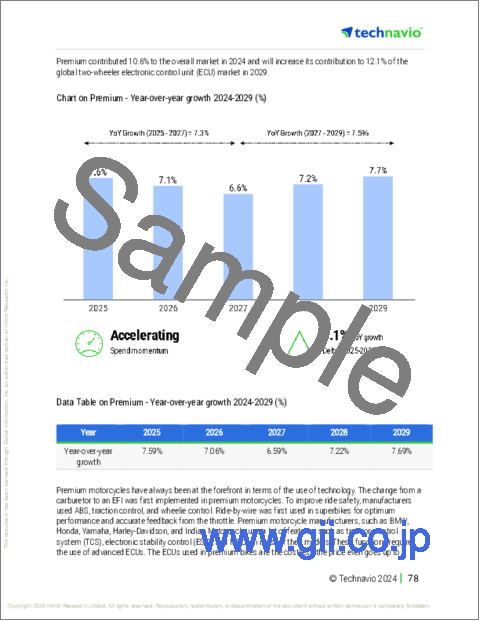
- プレミアム:市場規模と予測 2024-2029
- 市場機会:エンドユーザー別
第9章 市場セグメンテーション:車両タイプ別
- 市場セグメント
- 比較:車両タイプ別
- オートバイ:市場規模と予測 2024-2029
- 原付:市場規模と予測 2024-2029
- モペット:市場規模と予測 2024-2029
- 市場機会:車両タイプ別
第10章 市場セグメンテーション:技術別
- 市場セグメント
- 比較:技術別
- 従来のECU:市場規模と予測 2024-2029
- AIとMLベースのECU:市場規模と予測 2024-2029
- クラウド接続ECU:市場規模と予測 2024-2029
- 自動運転ECU:市場規模と予測 2024-2029
- 市場機会:技術別
第11章 顧客情勢
- 顧客情勢の概要
第12章 地域別情勢
- 地域別セグメンテーション
- 地域別比較
- アジア太平洋:市場規模と予測 2024-2029
- 南米:市場規模と予測 2024-2029
- 北米:市場規模と予測 2024-2029
- 欧州:市場規模と予測 2024-2029
- 中東・アフリカ:市場規模と予測 2024-2029
- 米国:市場規模と予測 2024-2029
- 中国:市場規模と予測 2024-2029
- ブラジル:市場規模と予測 2024-2029
- インド:市場規模と予測 2024-2029
- インドネシア:市場規模と予測 2024-2029
- アルゼンチン:市場規模と予測 2024-2029
- ベトナム:市場規模と予測 2024-2029
- カナダ:市場規模と予測 2024-2029
- ドイツ:市場規模と予測 2024-2029
- タイ:市場規模と予測 2024-2029
- 市場機会:地域情勢別
第13章 促進要因・課題・機会・抑制要因
- 市場促進要因
- 市場の課題
- 促進要因と課題の影響
- 市場の機会・抑制要因
第14章 競合情勢
- 概要
- 競合情勢
- 混乱の状況
- 業界のリスク
第15章 競合分析
- 企業プロファイル
- 企業ランキング指数
- 企業の市場ポジショニング
- Bajaj Auto Ltd.
- BorgWarner Inc.
- Continental AG
- DENSO Corp.
- Honda Motor Co. Ltd.
- Infineon Technologies AG
- Kawasaki Heavy Industries Ltd.
- Marelli Holdings Co. Ltd.
- Mitsubishi Electric Corp.
- NXP Semiconductors NV
- Robert Bosch GmbH
- SEDEMAC Mechatronics Pvt. Ltd.
- Suzuki Motor Corp.
- Volkswagen AG
- ZF Friedrichshafen AG
第16章 付録
Exhibits:
- Exhibits1: Executive Summary - Chart on Market Overview
- Exhibits2: Executive Summary - Data Table on Market Overview
- Exhibits3: Executive Summary - Chart on Global Market Characteristics
- Exhibits4: Executive Summary - Chart on Market By Geographical Landscape
- Exhibits5: Executive Summary - Chart on Market Segmentation by End-user
- Exhibits6: Executive Summary - Chart on Market Segmentation by Vehicle Type
- Exhibits7: Executive Summary - Chart on Market Segmentation by Technology
- Exhibits8: Executive Summary - Chart on Incremental Growth
- Exhibits9: Executive Summary - Data Table on Incremental Growth
- Exhibits10: Executive Summary - Chart on Company Market Positioning
- Exhibits11: Analysis of price sensitivity, lifecycle, customer purchase basket, adoption rates, and purchase criteria
- Exhibits12: Overview on criticality of inputs and factors of differentiation
- Exhibits13: Overview on factors of disruption
- Exhibits14: Impact of drivers and challenges in 2024 and 2029
- Exhibits15: Parent Market
- Exhibits16: Data Table on - Parent Market
- Exhibits17: Market characteristics analysis
- Exhibits18: Value chain analysis
- Exhibits19: Offerings of companies included in the market definition
- Exhibits20: Market segments
- Exhibits21: Chart on Global - Market size and forecast 2024-2029 ($ billion)
- Exhibits22: Data Table on Global - Market size and forecast 2024-2029 ($ billion)
- Exhibits23: Chart on Global Market: Year-over-year growth 2024-2029 (%)
- Exhibits24: Data Table on Global Market: Year-over-year growth 2024-2029 (%)
- Exhibits25: Historic Market Size - Data Table on Global Two-Wheeler Electronic Control Unit (ECU) Market 2019 - 2023 ($ billion)
- Exhibits26: Historic Market Size - End-user Segment 2019 - 2023 ($ billion)
- Exhibits27: Historic Market Size - Vehicle Type Segment 2019 - 2023 ($ billion)
- Exhibits28: Historic Market Size - Technology Segment 2019 - 2023 ($ billion)
- Exhibits29: Historic Market Size - Geography Segment 2019 - 2023 ($ billion)
- Exhibits30: Historic Market Size - Country Segment 2019 - 2023 ($ billion)
- Exhibits31: Five forces analysis - Comparison between 2024 and 2029
- Exhibits32: Bargaining power of buyers - Impact of key factors 2024 and 2029
- Exhibits33: Bargaining power of suppliers - Impact of key factors in 2024 and 2029
- Exhibits34: Threat of new entrants - Impact of key factors in 2024 and 2029
- Exhibits35: Threat of substitutes - Impact of key factors in 2024 and 2029
- Exhibits36: Threat of rivalry - Impact of key factors in 2024 and 2029
- Exhibits37: Chart on Market condition - Five forces 2024 and 2029
- Exhibits38: Chart on End-user - Market share 2024-2029 (%)
- Exhibits39: Data Table on End-user - Market share 2024-2029 (%)
- Exhibits40: Chart on Comparison by End-user
- Exhibits41: Data Table on Comparison by End-user
- Exhibits42: Chart on Commuter - Market size and forecast 2024-2029 ($ billion)
- Exhibits43: Data Table on Commuter - Market size and forecast 2024-2029 ($ billion)
- Exhibits44: Chart on Commuter - Year-over-year growth 2024-2029 (%)
- Exhibits45: Data Table on Commuter - Year-over-year growth 2024-2029 (%)
- Exhibits46: Chart on Mid-premium - Market size and forecast 2024-2029 ($ billion)
- Exhibits47: Data Table on Mid-premium - Market size and forecast 2024-2029 ($ billion)
- Exhibits48: Chart on Mid-premium - Year-over-year growth 2024-2029 (%)
- Exhibits49: Data Table on Mid-premium - Year-over-year growth 2024-2029 (%)
- Exhibits50: Chart on Premium - Market size and forecast 2024-2029 ($ billion)
- Exhibits51: Data Table on Premium - Market size and forecast 2024-2029 ($ billion)
- Exhibits52: Chart on Premium - Year-over-year growth 2024-2029 (%)
- Exhibits53: Data Table on Premium - Year-over-year growth 2024-2029 (%)
- Exhibits54: Market opportunity by End-user ($ billion)
- Exhibits55: Data Table on Market opportunity by End-user ($ billion)
- Exhibits56: Chart on Vehicle Type - Market share 2024-2029 (%)
- Exhibits57: Data Table on Vehicle Type - Market share 2024-2029 (%)
- Exhibits58: Chart on Comparison by Vehicle Type
- Exhibits59: Data Table on Comparison by Vehicle Type
- Exhibits60: Chart on Motorcycles - Market size and forecast 2024-2029 ($ billion)
- Exhibits61: Data Table on Motorcycles - Market size and forecast 2024-2029 ($ billion)
- Exhibits62: Chart on Motorcycles - Year-over-year growth 2024-2029 (%)
- Exhibits63: Data Table on Motorcycles - Year-over-year growth 2024-2029 (%)
- Exhibits64: Chart on Scooters - Market size and forecast 2024-2029 ($ billion)
- Exhibits65: Data Table on Scooters - Market size and forecast 2024-2029 ($ billion)
- Exhibits66: Chart on Scooters - Year-over-year growth 2024-2029 (%)
- Exhibits67: Data Table on Scooters - Year-over-year growth 2024-2029 (%)
- Exhibits68: Chart on Mopeds - Market size and forecast 2024-2029 ($ billion)
- Exhibits69: Data Table on Mopeds - Market size and forecast 2024-2029 ($ billion)
- Exhibits70: Chart on Mopeds - Year-over-year growth 2024-2029 (%)
- Exhibits71: Data Table on Mopeds - Year-over-year growth 2024-2029 (%)
- Exhibits72: Market opportunity by Vehicle Type ($ billion)
- Exhibits73: Data Table on Market opportunity by Vehicle Type ($ billion)
- Exhibits74: Chart on Technology - Market share 2024-2029 (%)
- Exhibits75: Data Table on Technology - Market share 2024-2029 (%)
- Exhibits76: Chart on Comparison by Technology
- Exhibits77: Data Table on Comparison by Technology
- Exhibits78: Chart on Conventional ECUs - Market size and forecast 2024-2029 ($ billion)
- Exhibits79: Data Table on Conventional ECUs - Market size and forecast 2024-2029 ($ billion)
- Exhibits80: Chart on Conventional ECUs - Year-over-year growth 2024-2029 (%)
- Exhibits81: Data Table on Conventional ECUs - Year-over-year growth 2024-2029 (%)
- Exhibits82: Chart on AI and ML-based ECUs - Market size and forecast 2024-2029 ($ billion)
- Exhibits83: Data Table on AI and ML-based ECUs - Market size and forecast 2024-2029 ($ billion)
- Exhibits84: Chart on AI and ML-based ECUs - Year-over-year growth 2024-2029 (%)
- Exhibits85: Data Table on AI and ML-based ECUs - Year-over-year growth 2024-2029 (%)
- Exhibits86: Chart on Cloud-connected ECUs - Market size and forecast 2024-2029 ($ billion)
- Exhibits87: Data Table on Cloud-connected ECUs - Market size and forecast 2024-2029 ($ billion)
- Exhibits88: Chart on Cloud-connected ECUs - Year-over-year growth 2024-2029 (%)
- Exhibits89: Data Table on Cloud-connected ECUs - Year-over-year growth 2024-2029 (%)
- Exhibits90: Chart on Autonomous ride ECUs - Market size and forecast 2024-2029 ($ billion)
- Exhibits91: Data Table on Autonomous ride ECUs - Market size and forecast 2024-2029 ($ billion)
- Exhibits92: Chart on Autonomous ride ECUs - Year-over-year growth 2024-2029 (%)
- Exhibits93: Data Table on Autonomous ride ECUs - Year-over-year growth 2024-2029 (%)
- Exhibits94: Market opportunity by Technology ($ billion)
- Exhibits95: Data Table on Market opportunity by Technology ($ billion)
- Exhibits96: Analysis of price sensitivity, lifecycle, customer purchase basket, adoption rates, and purchase criteria
- Exhibits97: Chart on Market share By Geographical Landscape 2024-2029 (%)
- Exhibits98: Data Table on Market share By Geographical Landscape 2024-2029 (%)
- Exhibits99: Chart on Geographic comparison
- Exhibits100: Data Table on Geographic comparison
- Exhibits101: Chart on APAC - Market size and forecast 2024-2029 ($ billion)
- Exhibits102: Data Table on APAC - Market size and forecast 2024-2029 ($ billion)
- Exhibits103: Chart on APAC - Year-over-year growth 2024-2029 (%)
- Exhibits104: Data Table on APAC - Year-over-year growth 2024-2029 (%)
- Exhibits105: Chart on South America - Market size and forecast 2024-2029 ($ billion)
- Exhibits106: Data Table on South America - Market size and forecast 2024-2029 ($ billion)
- Exhibits107: Chart on South America - Year-over-year growth 2024-2029 (%)
- Exhibits108: Data Table on South America - Year-over-year growth 2024-2029 (%)
- Exhibits109: Chart on North America - Market size and forecast 2024-2029 ($ billion)
- Exhibits110: Data Table on North America - Market size and forecast 2024-2029 ($ billion)
- Exhibits111: Chart on North America - Year-over-year growth 2024-2029 (%)
- Exhibits112: Data Table on North America - Year-over-year growth 2024-2029 (%)
- Exhibits113: Chart on Europe - Market size and forecast 2024-2029 ($ billion)
- Exhibits114: Data Table on Europe - Market size and forecast 2024-2029 ($ billion)
- Exhibits115: Chart on Europe - Year-over-year growth 2024-2029 (%)
- Exhibits116: Data Table on Europe - Year-over-year growth 2024-2029 (%)
- Exhibits117: Chart on Middle East and Africa - Market size and forecast 2024-2029 ($ billion)
- Exhibits118: Data Table on Middle East and Africa - Market size and forecast 2024-2029 ($ billion)
- Exhibits119: Chart on Middle East and Africa - Year-over-year growth 2024-2029 (%)
- Exhibits120: Data Table on Middle East and Africa - Year-over-year growth 2024-2029 (%)
- Exhibits121: Chart on US - Market size and forecast 2024-2029 ($ billion)
- Exhibits122: Data Table on US - Market size and forecast 2024-2029 ($ billion)
- Exhibits123: Chart on US - Year-over-year growth 2024-2029 (%)
- Exhibits124: Data Table on US - Year-over-year growth 2024-2029 (%)
- Exhibits125: Chart on China - Market size and forecast 2024-2029 ($ billion)
- Exhibits126: Data Table on China - Market size and forecast 2024-2029 ($ billion)
- Exhibits127: Chart on China - Year-over-year growth 2024-2029 (%)
- Exhibits128: Data Table on China - Year-over-year growth 2024-2029 (%)
- Exhibits129: Chart on Brazil - Market size and forecast 2024-2029 ($ billion)
- Exhibits130: Data Table on Brazil - Market size and forecast 2024-2029 ($ billion)
- Exhibits131: Chart on Brazil - Year-over-year growth 2024-2029 (%)
- Exhibits132: Data Table on Brazil - Year-over-year growth 2024-2029 (%)
- Exhibits133: Chart on India - Market size and forecast 2024-2029 ($ billion)
- Exhibits134: Data Table on India - Market size and forecast 2024-2029 ($ billion)
- Exhibits135: Chart on India - Year-over-year growth 2024-2029 (%)
- Exhibits136: Data Table on India - Year-over-year growth 2024-2029 (%)
- Exhibits137: Chart on Indonesia - Market size and forecast 2024-2029 ($ billion)
- Exhibits138: Data Table on Indonesia - Market size and forecast 2024-2029 ($ billion)
- Exhibits139: Chart on Indonesia - Year-over-year growth 2024-2029 (%)
- Exhibits140: Data Table on Indonesia - Year-over-year growth 2024-2029 (%)
- Exhibits141: Chart on Argentina - Market size and forecast 2024-2029 ($ billion)
- Exhibits142: Data Table on Argentina - Market size and forecast 2024-2029 ($ billion)
- Exhibits143: Chart on Argentina - Year-over-year growth 2024-2029 (%)
- Exhibits144: Data Table on Argentina - Year-over-year growth 2024-2029 (%)
- Exhibits145: Chart on Vietnam - Market size and forecast 2024-2029 ($ billion)
- Exhibits146: Data Table on Vietnam - Market size and forecast 2024-2029 ($ billion)
- Exhibits147: Chart on Vietnam - Year-over-year growth 2024-2029 (%)
- Exhibits148: Data Table on Vietnam - Year-over-year growth 2024-2029 (%)
- Exhibits149: Chart on Canada - Market size and forecast 2024-2029 ($ billion)
- Exhibits150: Data Table on Canada - Market size and forecast 2024-2029 ($ billion)
- Exhibits151: Chart on Canada - Year-over-year growth 2024-2029 (%)
- Exhibits152: Data Table on Canada - Year-over-year growth 2024-2029 (%)
- Exhibits153: Chart on Germany - Market size and forecast 2024-2029 ($ billion)
- Exhibits154: Data Table on Germany - Market size and forecast 2024-2029 ($ billion)
- Exhibits155: Chart on Germany - Year-over-year growth 2024-2029 (%)
- Exhibits156: Data Table on Germany - Year-over-year growth 2024-2029 (%)
- Exhibits157: Chart on Thailand - Market size and forecast 2024-2029 ($ billion)
- Exhibits158: Data Table on Thailand - Market size and forecast 2024-2029 ($ billion)
- Exhibits159: Chart on Thailand - Year-over-year growth 2024-2029 (%)
- Exhibits160: Data Table on Thailand - Year-over-year growth 2024-2029 (%)
- Exhibits161: Market opportunity By Geographical Landscape ($ billion)
- Exhibits162: Data Tables on Market opportunity By Geographical Landscape ($ billion)
- Exhibits163: Impact of drivers and challenges in 2024 and 2029
- Exhibits164: Overview on criticality of inputs and factors of differentiation
- Exhibits165: Overview on factors of disruption
- Exhibits166: Impact of key risks on business
- Exhibits167: Companies covered
- Exhibits168: Company ranking index
- Exhibits169: Matrix on companies position and classification
- Exhibits170: Bajaj Auto Ltd. - Overview
- Exhibits171: Bajaj Auto Ltd. - Business segments
- Exhibits172: Bajaj Auto Ltd. - Key offerings
- Exhibits173: Bajaj Auto Ltd. - Segment focus
- Exhibits174: SWOT
- Exhibits175: BorgWarner Inc. - Overview
- Exhibits176: BorgWarner Inc. - Business segments
- Exhibits177: BorgWarner Inc. - Key news
- Exhibits178: BorgWarner Inc. - Key offerings
- Exhibits179: BorgWarner Inc. - Segment focus
- Exhibits180: SWOT
- Exhibits181: Continental AG - Overview
- Exhibits182: Continental AG - Business segments
- Exhibits183: Continental AG - Key news
- Exhibits184: Continental AG - Key offerings
- Exhibits185: Continental AG - Segment focus
- Exhibits186: SWOT
- Exhibits187: DENSO Corp. - Overview
- Exhibits188: DENSO Corp. - Business segments
- Exhibits189: DENSO Corp. - Key news
- Exhibits190: DENSO Corp. - Key offerings
- Exhibits191: DENSO Corp. - Segment focus
- Exhibits192: SWOT
- Exhibits193: Honda Motor Co. Ltd. - Overview
- Exhibits194: Honda Motor Co. Ltd. - Business segments
- Exhibits195: Honda Motor Co. Ltd. - Key news
- Exhibits196: Honda Motor Co. Ltd. - Key offerings
- Exhibits197: Honda Motor Co. Ltd. - Segment focus
- Exhibits198: SWOT
- Exhibits199: Infineon Technologies AG - Overview
- Exhibits200: Infineon Technologies AG - Business segments
- Exhibits201: Infineon Technologies AG - Key news
- Exhibits202: Infineon Technologies AG - Key offerings
- Exhibits203: Infineon Technologies AG - Segment focus
- Exhibits204: SWOT
- Exhibits205: Kawasaki Heavy Industries Ltd. - Overview
- Exhibits206: Kawasaki Heavy Industries Ltd. - Business segments
- Exhibits207: Kawasaki Heavy Industries Ltd. - Key news
- Exhibits208: Kawasaki Heavy Industries Ltd. - Key offerings
- Exhibits209: Kawasaki Heavy Industries Ltd. - Segment focus
- Exhibits210: SWOT
- Exhibits211: Marelli Holdings Co. Ltd. - Overview
- Exhibits212: Marelli Holdings Co. Ltd. - Product / Service
- Exhibits213: Marelli Holdings Co. Ltd. - Key news
- Exhibits214: Marelli Holdings Co. Ltd. - Key offerings
- Exhibits215: SWOT
- Exhibits216: Mitsubishi Electric Corp. - Overview
- Exhibits217: Mitsubishi Electric Corp. - Business segments
- Exhibits218: Mitsubishi Electric Corp. - Key offerings
- Exhibits219: Mitsubishi Electric Corp. - Segment focus
- Exhibits220: SWOT
- Exhibits221: NXP Semiconductors NV - Overview
- Exhibits222: NXP Semiconductors NV - Product / Service
- Exhibits223: NXP Semiconductors NV - Key offerings
- Exhibits224: SWOT
- Exhibits225: Robert Bosch GmbH - Overview
- Exhibits226: Robert Bosch GmbH - Product / Service
- Exhibits227: Robert Bosch GmbH - Key news
- Exhibits228: Robert Bosch GmbH - Key offerings
- Exhibits229: SWOT
- Exhibits230: SEDEMAC Mechatronics Pvt. Ltd. - Overview
- Exhibits231: SEDEMAC Mechatronics Pvt. Ltd. - Product / Service
- Exhibits232: SEDEMAC Mechatronics Pvt. Ltd. - Key offerings
- Exhibits233: SWOT
- Exhibits234: Suzuki Motor Corp. - Overview
- Exhibits235: Suzuki Motor Corp. - Business segments
- Exhibits236: Suzuki Motor Corp. - Key offerings
- Exhibits237: Suzuki Motor Corp. - Segment focus
- Exhibits238: SWOT
- Exhibits239: Volkswagen AG - Overview
- Exhibits240: Volkswagen AG - Business segments
- Exhibits241: Volkswagen AG - Key news
- Exhibits242: Volkswagen AG - Key offerings
- Exhibits243: Volkswagen AG - Segment focus
- Exhibits244: SWOT
- Exhibits245: ZF Friedrichshafen AG - Overview
- Exhibits246: ZF Friedrichshafen AG - Business segments
- Exhibits247: ZF Friedrichshafen AG - Key news
- Exhibits248: ZF Friedrichshafen AG - Key offerings
- Exhibits249: ZF Friedrichshafen AG - Segment focus
- Exhibits250: SWOT
- Exhibits251: Inclusions checklist
- Exhibits252: Exclusions checklist
- Exhibits253: Currency conversion rates for US$
- Exhibits254: Research methodology
- Exhibits255: Information sources
- Exhibits256: Data validation
- Exhibits257: Validation techniques employed for market sizing
- Exhibits258: Data synthesis
- Exhibits259: 360 degree market analysis
- Exhibits260: List of abbreviations
The two-wheeler electronic control unit (ECU) market is forecasted to grow by USD 17.9 bn during 2024-2029, accelerating at a CAGR of 4.4% during the forecast period. The report on the two-wheeler electronic control unit (ECU) market provides a holistic analysis, market size and forecast, trends, growth drivers, and challenges, as well as vendor analysis covering around 25 vendors.
The report offers an up-to-date analysis regarding the current market scenario, the latest trends and drivers, and the overall market environment. The market is driven by increased electrification of mechanical components, increasing demand for fuel-efficient motorcycles, and growing focus on safety and stability in motorcycles.
| Market Scope | |
|---|---|
| Base Year | 2025 |
| End Year | 2029 |
| Series Year | 2025-2029 |
| Growth Momentum | Accelerate |
| YOY 2025 | 4.2% |
| CAGR | 4.4% |
| Incremental Value | $17.9 bn |
The study was conducted using an objective combination of primary and secondary information including inputs from key participants in the industry. The report contains a comprehensive market size data, segment with regional analysis and vendor landscape in addition to an analysis of the key companies. Reports have historic and forecast data.
Technavio's two-wheeler electronic control unit (ECU) market is segmented as below:
By End-user
- Commuter
- Mid-premium
- Premium
By Vehicle Type
- Motorcycles
- Scooters
- Mopeds
By Technology
- Conventional ECUs
- AI and ML-based ECUs
- Cloud-connected ECUs
- Autonomous ride ECUs
By Geographical Landscape
- APAC
- South America
- North America
- Europe
- Middle East and Africa
This study identifies the smartphone connectivity for two-wheeler diagnostics as one of the prime reasons driving the two-wheeler electronic control unit (ECU) market growth during the next few years. Also, availability of affordable ems and use of ecus in connected motorcycles will lead to sizable demand in the market.
The report on the two-wheeler electronic control unit (ECU) market covers the following areas:
- Two-Wheeler Electronic Control Unit (ECU) Market sizing
- Two-Wheeler Electronic Control Unit (ECU) Market forecast
- Two-Wheeler Electronic Control Unit (ECU) Market industry analysis
The robust vendor analysis is designed to help clients improve their market position, and in line with this, this report provides a detailed analysis of several leading two-wheeler electronic control unit (ECU) market vendors that include Bajaj Auto Ltd., BorgWarner Inc., Continental AG, DENSO Corp., dSPACE GmbH, Honda Motor Co. Ltd., Infineon Technologies AG, Kawasaki Heavy Industries Ltd., Marelli Holdings Co. Ltd., Mikuni Corp., Mitsubishi Electric Corp., Nikki Co. Ltd., NXP Semiconductors NV, Robert Bosch GmbH, S and S Cycle Inc., SEDEMAC Mechatronics Pvt. Ltd., Shindengen Electric Manufacturing Co. Ltd., Suzuki Motor Corp., Volkswagen AG, and ZF Friedrichshafen AG. Also, the two-wheeler electronic control unit (ECU) market analysis report includes information on upcoming trends and challenges that will influence market growth. This is to help companies strategize and leverage all forthcoming growth opportunities.
The publisher presents a detailed picture of the market by the way of study, synthesis, and summation of data from multiple sources by an analysis of key parameters such as profit, pricing, competition, and promotions. It presents various market facets by identifying the key industry influencers. The data presented is comprehensive, reliable, and a result of extensive primary and secondary research. The market research reports provide a complete competitive landscape and an in-depth vendor selection methodology and analysis using qualitative and quantitative research to forecast accurate market growth.
Table of Contents
1 Executive Summary
- 1.1 Market overview
- Executive Summary - Chart on Market Overview
- Executive Summary - Data Table on Market Overview
- Executive Summary - Chart on Global Market Characteristics
- Executive Summary - Chart on Market By Geographical Landscape
- Executive Summary - Chart on Market Segmentation by End-user
- Executive Summary - Chart on Market Segmentation by Vehicle Type
- Executive Summary - Chart on Market Segmentation by Technology
- Executive Summary - Chart on Incremental Growth
- Executive Summary - Data Table on Incremental Growth
- Executive Summary - Chart on Company Market Positioning
2 Technavio Analysis
- 2.1 Analysis of price sensitivity, lifecycle, customer purchase basket, adoption rates, and purchase criteria
- Analysis of price sensitivity, lifecycle, customer purchase basket, adoption rates, and purchase criteria
- 2.2 Criticality of inputs and Factors of differentiation
- Overview on criticality of inputs and factors of differentiation
- 2.3 Factors of disruption
- Overview on factors of disruption
- 2.4 Impact of drivers and challenges
- Impact of drivers and challenges in 2024 and 2029
3 Market Landscape
- 3.1 Market ecosystem
- Parent Market
- Data Table on - Parent Market
- 3.2 Market characteristics
- Market characteristics analysis
- 3.3 Value chain analysis
- Value chain analysis
4 Market Sizing
- 4.1 Market definition
- Offerings of companies included in the market definition
- 4.2 Market segment analysis
- Market segments
- 4.3 Market size 2024
- 4.4 Market outlook: Forecast for 2024-2029
- Chart on Global - Market size and forecast 2024-2029 ($ billion)
- Data Table on Global - Market size and forecast 2024-2029 ($ billion)
- Chart on Global Market: Year-over-year growth 2024-2029 (%)
- Data Table on Global Market: Year-over-year growth 2024-2029 (%)
5 Historic Market Size
- 5.1 Global Two-Wheeler Electronic Control Unit (ECU) Market 2019 - 2023
- Historic Market Size - Data Table on Global Two-Wheeler Electronic Control Unit (ECU) Market 2019 - 2023 ($ billion)
- 5.2 End-user segment analysis 2019 - 2023
- Historic Market Size - End-user Segment 2019 - 2023 ($ billion)
- 5.3 Vehicle Type segment analysis 2019 - 2023
- Historic Market Size - Vehicle Type Segment 2019 - 2023 ($ billion)
- 5.4 Technology segment analysis 2019 - 2023
- Historic Market Size - Technology Segment 2019 - 2023 ($ billion)
- 5.5 Geography segment analysis 2019 - 2023
- Historic Market Size - Geography Segment 2019 - 2023 ($ billion)
- 5.6 Country segment analysis 2019 - 2023
- Historic Market Size - Country Segment 2019 - 2023 ($ billion)
6 Qualitative Analysis
- 6.1 Impact of AI in global two-wheeler electronic control unit (ECU) market
7 Five Forces Analysis
- 7.1 Five forces summary
- Five forces analysis - Comparison between 2024 and 2029
- 7.2 Bargaining power of buyers
- Bargaining power of buyers - Impact of key factors 2024 and 2029
- 7.3 Bargaining power of suppliers
- Bargaining power of suppliers - Impact of key factors in 2024 and 2029
- 7.4 Threat of new entrants
- Threat of new entrants - Impact of key factors in 2024 and 2029
- 7.5 Threat of substitutes
- Threat of substitutes - Impact of key factors in 2024 and 2029
- 7.6 Threat of rivalry
- Threat of rivalry - Impact of key factors in 2024 and 2029
- 7.7 Market condition
- Chart on Market condition - Five forces 2024 and 2029
8 Market Segmentation by End-user
- 8.1 Market segments
- Chart on End-user - Market share 2024-2029 (%)
- Data Table on End-user - Market share 2024-2029 (%)
- 8.2 Comparison by End-user
- Chart on Comparison by End-user
- Data Table on Comparison by End-user
- 8.3 Commuter - Market size and forecast 2024-2029
- Chart on Commuter - Market size and forecast 2024-2029 ($ billion)
- Data Table on Commuter - Market size and forecast 2024-2029 ($ billion)
- Chart on Commuter - Year-over-year growth 2024-2029 (%)
- Data Table on Commuter - Year-over-year growth 2024-2029 (%)
- 8.4 Mid-premium - Market size and forecast 2024-2029
- Chart on Mid-premium - Market size and forecast 2024-2029 ($ billion)
- Data Table on Mid-premium - Market size and forecast 2024-2029 ($ billion)
- Chart on Mid-premium - Year-over-year growth 2024-2029 (%)
- Data Table on Mid-premium - Year-over-year growth 2024-2029 (%)
- 8.5 Premium - Market size and forecast 2024-2029
- Chart on Premium - Market size and forecast 2024-2029 ($ billion)
- Data Table on Premium - Market size and forecast 2024-2029 ($ billion)
- Chart on Premium - Year-over-year growth 2024-2029 (%)
- Data Table on Premium - Year-over-year growth 2024-2029 (%)
- 8.6 Market opportunity by End-user
- Market opportunity by End-user ($ billion)
- Data Table on Market opportunity by End-user ($ billion)
9 Market Segmentation by Vehicle Type
- 9.1 Market segments
- Chart on Vehicle Type - Market share 2024-2029 (%)
- Data Table on Vehicle Type - Market share 2024-2029 (%)
- 9.2 Comparison by Vehicle Type
- Chart on Comparison by Vehicle Type
- Data Table on Comparison by Vehicle Type
- 9.3 Motorcycles - Market size and forecast 2024-2029
- Chart on Motorcycles - Market size and forecast 2024-2029 ($ billion)
- Data Table on Motorcycles - Market size and forecast 2024-2029 ($ billion)
- Chart on Motorcycles - Year-over-year growth 2024-2029 (%)
- Data Table on Motorcycles - Year-over-year growth 2024-2029 (%)
- 9.4 Scooters - Market size and forecast 2024-2029
- Chart on Scooters - Market size and forecast 2024-2029 ($ billion)
- Data Table on Scooters - Market size and forecast 2024-2029 ($ billion)
- Chart on Scooters - Year-over-year growth 2024-2029 (%)
- Data Table on Scooters - Year-over-year growth 2024-2029 (%)
- 9.5 Mopeds - Market size and forecast 2024-2029
- Chart on Mopeds - Market size and forecast 2024-2029 ($ billion)
- Data Table on Mopeds - Market size and forecast 2024-2029 ($ billion)
- Chart on Mopeds - Year-over-year growth 2024-2029 (%)
- Data Table on Mopeds - Year-over-year growth 2024-2029 (%)
- 9.6 Market opportunity by Vehicle Type
- Market opportunity by Vehicle Type ($ billion)
- Data Table on Market opportunity by Vehicle Type ($ billion)
10 Market Segmentation by Technology
- 10.1 Market segments
- Chart on Technology - Market share 2024-2029 (%)
- Data Table on Technology - Market share 2024-2029 (%)
- 10.2 Comparison by Technology
- Chart on Comparison by Technology
- Data Table on Comparison by Technology
- 10.3 Conventional ECUs - Market size and forecast 2024-2029
- Chart on Conventional ECUs - Market size and forecast 2024-2029 ($ billion)
- Data Table on Conventional ECUs - Market size and forecast 2024-2029 ($ billion)
- Chart on Conventional ECUs - Year-over-year growth 2024-2029 (%)
- Data Table on Conventional ECUs - Year-over-year growth 2024-2029 (%)
- 10.4 AI and ML-based ECUs - Market size and forecast 2024-2029
- Chart on AI and ML-based ECUs - Market size and forecast 2024-2029 ($ billion)
- Data Table on AI and ML-based ECUs - Market size and forecast 2024-2029 ($ billion)
- Chart on AI and ML-based ECUs - Year-over-year growth 2024-2029 (%)
- Data Table on AI and ML-based ECUs - Year-over-year growth 2024-2029 (%)
- 10.5 Cloud-connected ECUs - Market size and forecast 2024-2029
- Chart on Cloud-connected ECUs - Market size and forecast 2024-2029 ($ billion)
- Data Table on Cloud-connected ECUs - Market size and forecast 2024-2029 ($ billion)
- Chart on Cloud-connected ECUs - Year-over-year growth 2024-2029 (%)
- Data Table on Cloud-connected ECUs - Year-over-year growth 2024-2029 (%)
- 10.6 Autonomous ride ECUs - Market size and forecast 2024-2029
- Chart on Autonomous ride ECUs - Market size and forecast 2024-2029 ($ billion)
- Data Table on Autonomous ride ECUs - Market size and forecast 2024-2029 ($ billion)
- Chart on Autonomous ride ECUs - Year-over-year growth 2024-2029 (%)
- Data Table on Autonomous ride ECUs - Year-over-year growth 2024-2029 (%)
- 10.7 Market opportunity by Technology
- Market opportunity by Technology ($ billion)
- Data Table on Market opportunity by Technology ($ billion)
11 Customer Landscape
- 11.1 Customer landscape overview
- Analysis of price sensitivity, lifecycle, customer purchase basket, adoption rates, and purchase criteria
12 Geographic Landscape
- 12.1 Geographic segmentation
- Chart on Market share By Geographical Landscape 2024-2029 (%)
- Data Table on Market share By Geographical Landscape 2024-2029 (%)
- 12.2 Geographic comparison
- Chart on Geographic comparison
- Data Table on Geographic comparison
- 12.3 APAC - Market size and forecast 2024-2029
- Chart on APAC - Market size and forecast 2024-2029 ($ billion)
- Data Table on APAC - Market size and forecast 2024-2029 ($ billion)
- Chart on APAC - Year-over-year growth 2024-2029 (%)
- Data Table on APAC - Year-over-year growth 2024-2029 (%)
- 12.4 South America - Market size and forecast 2024-2029
- Chart on South America - Market size and forecast 2024-2029 ($ billion)
- Data Table on South America - Market size and forecast 2024-2029 ($ billion)
- Chart on South America - Year-over-year growth 2024-2029 (%)
- Data Table on South America - Year-over-year growth 2024-2029 (%)
- 12.5 North America - Market size and forecast 2024-2029
- Chart on North America - Market size and forecast 2024-2029 ($ billion)
- Data Table on North America - Market size and forecast 2024-2029 ($ billion)
- Chart on North America - Year-over-year growth 2024-2029 (%)
- Data Table on North America - Year-over-year growth 2024-2029 (%)
- 12.6 Europe - Market size and forecast 2024-2029
- Chart on Europe - Market size and forecast 2024-2029 ($ billion)
- Data Table on Europe - Market size and forecast 2024-2029 ($ billion)
- Chart on Europe - Year-over-year growth 2024-2029 (%)
- Data Table on Europe - Year-over-year growth 2024-2029 (%)
- 12.7 Middle East and Africa - Market size and forecast 2024-2029
- Chart on Middle East and Africa - Market size and forecast 2024-2029 ($ billion)
- Data Table on Middle East and Africa - Market size and forecast 2024-2029 ($ billion)
- Chart on Middle East and Africa - Year-over-year growth 2024-2029 (%)
- Data Table on Middle East and Africa - Year-over-year growth 2024-2029 (%)
- 12.8 US - Market size and forecast 2024-2029
- Chart on US - Market size and forecast 2024-2029 ($ billion)
- Data Table on US - Market size and forecast 2024-2029 ($ billion)
- Chart on US - Year-over-year growth 2024-2029 (%)
- Data Table on US - Year-over-year growth 2024-2029 (%)
- 12.9 China - Market size and forecast 2024-2029
- Chart on China - Market size and forecast 2024-2029 ($ billion)
- Data Table on China - Market size and forecast 2024-2029 ($ billion)
- Chart on China - Year-over-year growth 2024-2029 (%)
- Data Table on China - Year-over-year growth 2024-2029 (%)
- 12.10 Brazil - Market size and forecast 2024-2029
- Chart on Brazil - Market size and forecast 2024-2029 ($ billion)
- Data Table on Brazil - Market size and forecast 2024-2029 ($ billion)
- Chart on Brazil - Year-over-year growth 2024-2029 (%)
- Data Table on Brazil - Year-over-year growth 2024-2029 (%)
- 12.11 India - Market size and forecast 2024-2029
- Chart on India - Market size and forecast 2024-2029 ($ billion)
- Data Table on India - Market size and forecast 2024-2029 ($ billion)
- Chart on India - Year-over-year growth 2024-2029 (%)
- Data Table on India - Year-over-year growth 2024-2029 (%)
- 12.12 Indonesia - Market size and forecast 2024-2029
- Chart on Indonesia - Market size and forecast 2024-2029 ($ billion)
- Data Table on Indonesia - Market size and forecast 2024-2029 ($ billion)
- Chart on Indonesia - Year-over-year growth 2024-2029 (%)
- Data Table on Indonesia - Year-over-year growth 2024-2029 (%)
- 12.13 Argentina - Market size and forecast 2024-2029
- Chart on Argentina - Market size and forecast 2024-2029 ($ billion)
- Data Table on Argentina - Market size and forecast 2024-2029 ($ billion)
- Chart on Argentina - Year-over-year growth 2024-2029 (%)
- Data Table on Argentina - Year-over-year growth 2024-2029 (%)
- 12.14 Vietnam - Market size and forecast 2024-2029
- Chart on Vietnam - Market size and forecast 2024-2029 ($ billion)
- Data Table on Vietnam - Market size and forecast 2024-2029 ($ billion)
- Chart on Vietnam - Year-over-year growth 2024-2029 (%)
- Data Table on Vietnam - Year-over-year growth 2024-2029 (%)
- 12.15 Canada - Market size and forecast 2024-2029
- Chart on Canada - Market size and forecast 2024-2029 ($ billion)
- Data Table on Canada - Market size and forecast 2024-2029 ($ billion)
- Chart on Canada - Year-over-year growth 2024-2029 (%)
- Data Table on Canada - Year-over-year growth 2024-2029 (%)
- 12.16 Germany - Market size and forecast 2024-2029
- Chart on Germany - Market size and forecast 2024-2029 ($ billion)
- Data Table on Germany - Market size and forecast 2024-2029 ($ billion)
- Chart on Germany - Year-over-year growth 2024-2029 (%)
- Data Table on Germany - Year-over-year growth 2024-2029 (%)
- 12.17 Thailand - Market size and forecast 2024-2029
- Chart on Thailand - Market size and forecast 2024-2029 ($ billion)
- Data Table on Thailand - Market size and forecast 2024-2029 ($ billion)
- Chart on Thailand - Year-over-year growth 2024-2029 (%)
- Data Table on Thailand - Year-over-year growth 2024-2029 (%)
- 12.18 Market opportunity By Geographical Landscape
- Market opportunity By Geographical Landscape ($ billion)
- Data Tables on Market opportunity By Geographical Landscape ($ billion)
13 Drivers, Challenges, and Opportunity/Restraints
- 13.1 Market drivers
- 13.2 Market challenges
- 13.3 Impact of drivers and challenges
- Impact of drivers and challenges in 2024 and 2029
- 13.4 Market opportunities/restraints
14 Competitive Landscape
- 14.1 Overview
- 14.2 Competitive Landscape
- Overview on criticality of inputs and factors of differentiation
- 14.3 Landscape disruption
- Overview on factors of disruption
- 14.4 Industry risks
- Impact of key risks on business
15 Competitive Analysis
- 15.1 Companies profiled
- Companies covered
- 15.2 Company ranking index
- Company ranking index
- 15.3 Market positioning of companies
- Matrix on companies position and classification
- 15.4 Bajaj Auto Ltd.
- Bajaj Auto Ltd. - Overview
- Bajaj Auto Ltd. - Business segments
- Bajaj Auto Ltd. - Key offerings
- Bajaj Auto Ltd. - Segment focus
- SWOT
- 15.5 BorgWarner Inc.
- BorgWarner Inc. - Overview
- BorgWarner Inc. - Business segments
- BorgWarner Inc. - Key news
- BorgWarner Inc. - Key offerings
- BorgWarner Inc. - Segment focus
- SWOT
- 15.6 Continental AG
- Continental AG - Overview
- Continental AG - Business segments
- Continental AG - Key news
- Continental AG - Key offerings
- Continental AG - Segment focus
- SWOT
- 15.7 DENSO Corp.
- DENSO Corp. - Overview
- DENSO Corp. - Business segments
- DENSO Corp. - Key news
- DENSO Corp. - Key offerings
- DENSO Corp. - Segment focus
- SWOT
- 15.8 Honda Motor Co. Ltd.
- Honda Motor Co. Ltd. - Overview
- Honda Motor Co. Ltd. - Business segments
- Honda Motor Co. Ltd. - Key news
- Honda Motor Co. Ltd. - Key offerings
- Honda Motor Co. Ltd. - Segment focus
- SWOT
- 15.9 Infineon Technologies AG
- Infineon Technologies AG - Overview
- Infineon Technologies AG - Business segments
- Infineon Technologies AG - Key news
- Infineon Technologies AG - Key offerings
- Infineon Technologies AG - Segment focus
- SWOT
- 15.10 Kawasaki Heavy Industries Ltd.
- Kawasaki Heavy Industries Ltd. - Overview
- Kawasaki Heavy Industries Ltd. - Business segments
- Kawasaki Heavy Industries Ltd. - Key news
- Kawasaki Heavy Industries Ltd. - Key offerings
- Kawasaki Heavy Industries Ltd. - Segment focus
- SWOT
- 15.11 Marelli Holdings Co. Ltd.
- Marelli Holdings Co. Ltd. - Overview
- Marelli Holdings Co. Ltd. - Product / Service
- Marelli Holdings Co. Ltd. - Key news
- Marelli Holdings Co. Ltd. - Key offerings
- SWOT
- 15.12 Mitsubishi Electric Corp.
- Mitsubishi Electric Corp. - Overview
- Mitsubishi Electric Corp. - Business segments
- Mitsubishi Electric Corp. - Key offerings
- Mitsubishi Electric Corp. - Segment focus
- SWOT
- 15.13 NXP Semiconductors NV
- NXP Semiconductors NV - Overview
- NXP Semiconductors NV - Product / Service
- NXP Semiconductors NV - Key offerings
- SWOT
- 15.14 Robert Bosch GmbH
- Robert Bosch GmbH - Overview
- Robert Bosch GmbH - Product / Service
- Robert Bosch GmbH - Key news
- Robert Bosch GmbH - Key offerings
- SWOT
- 15.15 SEDEMAC Mechatronics Pvt. Ltd.
- SEDEMAC Mechatronics Pvt. Ltd. - Overview
- SEDEMAC Mechatronics Pvt. Ltd. - Product / Service
- SEDEMAC Mechatronics Pvt. Ltd. - Key offerings
- SWOT
- 15.16 Suzuki Motor Corp.
- Suzuki Motor Corp. - Overview
- Suzuki Motor Corp. - Business segments
- Suzuki Motor Corp. - Key offerings
- Suzuki Motor Corp. - Segment focus
- SWOT
- 15.17 Volkswagen AG
- Volkswagen AG - Overview
- Volkswagen AG - Business segments
- Volkswagen AG - Key news
- Volkswagen AG - Key offerings
- Volkswagen AG - Segment focus
- SWOT
- 15.18 ZF Friedrichshafen AG
- ZF Friedrichshafen AG - Overview
- ZF Friedrichshafen AG - Business segments
- ZF Friedrichshafen AG - Key news
- ZF Friedrichshafen AG - Key offerings
- ZF Friedrichshafen AG - Segment focus
- SWOT
16 Appendix
- 16.1 Scope of the report
- 16.2 Inclusions and exclusions checklist
- Inclusions checklist
- Exclusions checklist
- 16.3 Currency conversion rates for US$
- Currency conversion rates for US$
- 16.4 Research methodology
- Research methodology
- 16.5 Data procurement
- Information sources
- 16.6 Data validation
- Data validation
- 16.7 Validation techniques employed for market sizing
- Validation techniques employed for market sizing
- 16.8 Data synthesis
- Data synthesis
- 16.9 360 degree market analysis
- 360 degree market analysis
- 16.10 List of abbreviations
- List of abbreviations

