|
|
市場調査レポート
商品コード
1732590
産業用ガースギアの世界市場 2025-2029Global Industrial Girth Gear Market 2025-2029 |
||||||

|
|||||||
カスタマイズ可能
|
|||||||


| 産業用ガースギアの世界市場 2025-2029 |
|
出版日: 2025年05月17日
発行: TechNavio
ページ情報: 英文 225 Pages
納期: 即納可能
|

全表示
- 概要
- 図表
- 目次
産業用ガースギア市場は2024-2029年に6,290万米ドル、予測期間中のCAGRは2.1%で成長すると予測されます。
当レポートでは、産業用ガースギア市場の全体的な分析、市場規模・予測、動向、成長促進要因、課題、約25のベンダーを網羅したベンダー分析などを掲載しています。
現在の市場シナリオ、最新動向と促進要因、市場環境全体に関する最新分析を提供しています。市場は、胴回りギア製造技術の向上、拡張活動や新しいセメント工場の設立、アジア太平洋地域における産業用胴回りギアの需要拡大によって牽引されています。
| 市場範囲 | |
|---|---|
| 基準年 | 2025 |
| 終了年 | 2029 |
| 予測期間 | 2025-2029 |
| 成長モメンタム | 加速 |
| 前年比 | 2.1% |
| CAGR | 2.1% |
| 増分額 | 6,290万米ドル |
本調査は、業界の主要参加者からのインプットを含め、一次情報と二次情報を客観的に組み合わせて実施しました。レポートには、主要企業の分析に加え、包括的な市場規模データ、地域分析によるセグメント、ベンダー情勢が含まれています。レポートには過去データと予測データがあります。
本調査では、今後数年間の産業用ガースギア市場の成長を促進する主な理由の一つとして、固形廃棄物管理への投資の増加を挙げています。また、胴回りギアのサービスとメンテナンスへの注目の高まりとセメント業界における統合は、市場の大きな需要につながるでしょう。
目次
第1章 エグゼクティブサマリー
- 市場概要
第2章 Technavio分析
- 価格・ライフサイクル・顧客購入バスケット・採用率・購入基準の分析
- インプットの重要性と差別化の要因
- 混乱の要因
- 促進要因と課題の影響
第3章 市場情勢
- 市場エコシステム
- 市場の特徴
- バリューチェーン分析
第4章 市場規模
- 市場の定義
- 市場セグメント分析
- 市場規模 2024
- 市場の見通し 2024-2029
第5章 市場規模実績
- 産業用ガースギアの世界市場 2019-2023
- タイプセグメント分析 2019-2023
- 用途別セグメント分析 2019-2023
- 材料セグメント分析 2019-2023
- 地域別セグメント分析 2019-2023
- 国別セグメント分析 2019-2023
第6章 定性分析
- AIの影響:産業用ガースギアの世界市場
第7章 ファイブフォース分析
- ファイブフォースの要約
- 買い手の交渉力
- 供給企業の交渉力
- 新規参入業者の脅威
- 代替品の脅威
- 競争の脅威
- 市況
第8章 市場セグメンテーション:タイプ別
- 市場セグメント
- 比較:タイプ別
- フランジマウントガースギア:市場規模と予測 2024-2029
- 接線スプリングマウントガースギア:市場規模と予測 2024-2029
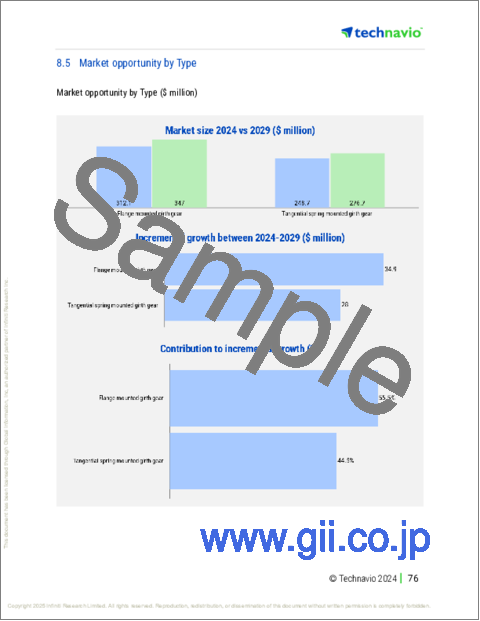
- 市場機会:タイプ別
第9章 市場セグメンテーション:用途別
- 市場セグメント
- 比較:用途別
- セメント:市場規模と予測 2024-2029
- 鉱業:市場規模と予測 2024-2029
- 化学および石油化学製品:市場規模と予測 2024-2029
- 金属加工:市場規模と予測 2024-2029
- その他:市場規模と予測 2024-2029
- 市場機会:用途別
第10章 市場セグメンテーション:素材別
- 市場セグメント
- 比較:素材別
- 合金鋼:市場規模と予測 2024-2029
- ダクタイル鋳鉄:市場規模と予測 2024-2029
- 鋳鋼:市場規模と予測 2024-2029
- その他:市場規模と予測 2024-2029
- 市場機会:素材別
第11章 顧客情勢
- 顧客情勢の概要
第12章 地域別情勢
- 地域別セグメンテーション
- 地域別比較
- アジア太平洋:市場規模と予測 2024-2029
- 欧州:市場規模と予測 2024-2029
- 北米:市場規模と予測 2024-2029
- 中東・アフリカ:市場規模と予測 2024-2029
- 南米:市場規模と予測 2024-2029
- 中国:市場規模と予測 2024-2029
- 米国:市場規模と予測 2024-2029
- インド:市場規模と予測 2024-2029
- ロシア:市場規模と予測 2024-2029
- 日本:市場規模と予測 2024-2029
- 英国:市場規模と予測 2024-2029
- 韓国:市場規模と予測 2024-2029
- ドイツ:市場規模と予測 2024-2029
- カナダ:市場規模と予測 2024-2029
- フランス:市場規模と予測 2024-2029
- 市場機会:地域情勢別
第13章 促進要因・課題・機会・抑制要因
- 市場促進要因
- 市場の課題
- 促進要因と課題の影響
- 市場の機会・抑制要因
第14章 競合情勢
- 概要
- 競合情勢
- 混乱の状況
- 業界のリスク
第15章 競合分析
- 企業プロファイル
- 企業ランキング指数
- 企業の市場ポジショニング
- ASHOKA MACHORD PVT. LTD.
- Chanderpur Group
- DB Santasalo Sarl
- FLSmidth and Co. AS
- Galbiati Costruzioni Meccaniche Srl
- Harcliff Mining Services Pty Ltd.
- Kohara Gear Industry Co. Ltd.
- Kumera Corp.
- Nippon Chuzo K.K.
- P. van der Wegen Gears
- SEW-EURODRIVE GmbH and Co KG
- Siemens AG
- SYMMEN
- The KCP Ltd.
- Xinxiang Great Wall Machinery Co. Ltd.
第16章 付録
Exhibits:
- Exhibits1: Executive Summary - Chart on Market Overview
- Exhibits2: Executive Summary - Data Table on Market Overview
- Exhibits3: Executive Summary - Chart on Global Market Characteristics
- Exhibits4: Executive Summary - Chart on Market By Geographical Landscape
- Exhibits5: Executive Summary - Chart on Market Segmentation by Type
- Exhibits6: Executive Summary - Chart on Market Segmentation by Application
- Exhibits7: Executive Summary - Chart on Market Segmentation by Material
- Exhibits8: Executive Summary - Chart on Incremental Growth
- Exhibits9: Executive Summary - Data Table on Incremental Growth
- Exhibits10: Executive Summary - Chart on Company Market Positioning
- Exhibits11: Analysis of price sensitivity, lifecycle, customer purchase basket, adoption rates, and purchase criteria
- Exhibits12: Overview on criticality of inputs and factors of differentiation
- Exhibits13: Overview on factors of disruption
- Exhibits14: Impact of drivers and challenges in 2024 and 2029
- Exhibits15: Parent Market
- Exhibits16: Data Table on - Parent Market
- Exhibits17: Market characteristics analysis
- Exhibits18: Value chain analysis
- Exhibits19: Offerings of companies included in the market definition
- Exhibits20: Market segments
- Exhibits21: Chart on Global - Market size and forecast 2024-2029 ($ million)
- Exhibits22: Data Table on Global - Market size and forecast 2024-2029 ($ million)
- Exhibits23: Chart on Global Market: Year-over-year growth 2024-2029 (%)
- Exhibits24: Data Table on Global Market: Year-over-year growth 2024-2029 (%)
- Exhibits25: Historic Market Size - Data Table on Global Industrial Girth Gear Market 2019 - 2023 ($ million)
- Exhibits26: Historic Market Size - Type Segment 2019 - 2023 ($ million)
- Exhibits27: Historic Market Size - Application Segment 2019 - 2023 ($ million)
- Exhibits28: Historic Market Size - Material Segment 2019 - 2023 ($ million)
- Exhibits29: Historic Market Size - Geography Segment 2019 - 2023 ($ million)
- Exhibits30: Historic Market Size - Country Segment 2019 - 2023 ($ million)
- Exhibits31: Five forces analysis - Comparison between 2024 and 2029
- Exhibits32: Bargaining power of buyers - Impact of key factors 2024 and 2029
- Exhibits33: Bargaining power of suppliers - Impact of key factors in 2024 and 2029
- Exhibits34: Threat of new entrants - Impact of key factors in 2024 and 2029
- Exhibits35: Threat of substitutes - Impact of key factors in 2024 and 2029
- Exhibits36: Threat of rivalry - Impact of key factors in 2024 and 2029
- Exhibits37: Chart on Market condition - Five forces 2024 and 2029
- Exhibits38: Chart on Type - Market share 2024-2029 (%)
- Exhibits39: Data Table on Type - Market share 2024-2029 (%)
- Exhibits40: Chart on Comparison by Type
- Exhibits41: Data Table on Comparison by Type
- Exhibits42: Chart on Flange mounted girth gear - Market size and forecast 2024-2029 ($ million)
- Exhibits43: Data Table on Flange mounted girth gear - Market size and forecast 2024-2029 ($ million)
- Exhibits44: Chart on Flange mounted girth gear - Year-over-year growth 2024-2029 (%)
- Exhibits45: Data Table on Flange mounted girth gear - Year-over-year growth 2024-2029 (%)
- Exhibits46: Chart on Tangential spring mounted girth gear - Market size and forecast 2024-2029 ($ million)
- Exhibits47: Data Table on Tangential spring mounted girth gear - Market size and forecast 2024-2029 ($ million)
- Exhibits48: Chart on Tangential spring mounted girth gear - Year-over-year growth 2024-2029 (%)
- Exhibits49: Data Table on Tangential spring mounted girth gear - Year-over-year growth 2024-2029 (%)
- Exhibits50: Market opportunity by Type ($ million)
- Exhibits51: Data Table on Market opportunity by Type ($ million)
- Exhibits52: Chart on Application - Market share 2024-2029 (%)
- Exhibits53: Data Table on Application - Market share 2024-2029 (%)
- Exhibits54: Chart on Comparison by Application
- Exhibits55: Data Table on Comparison by Application
- Exhibits56: Chart on Cement - Market size and forecast 2024-2029 ($ million)
- Exhibits57: Data Table on Cement - Market size and forecast 2024-2029 ($ million)
- Exhibits58: Chart on Cement - Year-over-year growth 2024-2029 (%)
- Exhibits59: Data Table on Cement - Year-over-year growth 2024-2029 (%)
- Exhibits60: Chart on Mining - Market size and forecast 2024-2029 ($ million)
- Exhibits61: Data Table on Mining - Market size and forecast 2024-2029 ($ million)
- Exhibits62: Chart on Mining - Year-over-year growth 2024-2029 (%)
- Exhibits63: Data Table on Mining - Year-over-year growth 2024-2029 (%)
- Exhibits64: Chart on Chemical and petrochemicals - Market size and forecast 2024-2029 ($ million)
- Exhibits65: Data Table on Chemical and petrochemicals - Market size and forecast 2024-2029 ($ million)
- Exhibits66: Chart on Chemical and petrochemicals - Year-over-year growth 2024-2029 (%)
- Exhibits67: Data Table on Chemical and petrochemicals - Year-over-year growth 2024-2029 (%)
- Exhibits68: Chart on Metal fabrication - Market size and forecast 2024-2029 ($ million)
- Exhibits69: Data Table on Metal fabrication - Market size and forecast 2024-2029 ($ million)
- Exhibits70: Chart on Metal fabrication - Year-over-year growth 2024-2029 (%)
- Exhibits71: Data Table on Metal fabrication - Year-over-year growth 2024-2029 (%)
- Exhibits72: Chart on Others - Market size and forecast 2024-2029 ($ million)
- Exhibits73: Data Table on Others - Market size and forecast 2024-2029 ($ million)
- Exhibits74: Chart on Others - Year-over-year growth 2024-2029 (%)
- Exhibits75: Data Table on Others - Year-over-year growth 2024-2029 (%)
- Exhibits76: Market opportunity by Application ($ million)
- Exhibits77: Data Table on Market opportunity by Application ($ million)
- Exhibits78: Chart on Material - Market share 2024-2029 (%)
- Exhibits79: Data Table on Material - Market share 2024-2029 (%)
- Exhibits80: Chart on Comparison by Material
- Exhibits81: Data Table on Comparison by Material
- Exhibits82: Chart on Alloy steel - Market size and forecast 2024-2029 ($ million)
- Exhibits83: Data Table on Alloy steel - Market size and forecast 2024-2029 ($ million)
- Exhibits84: Chart on Alloy steel - Year-over-year growth 2024-2029 (%)
- Exhibits85: Data Table on Alloy steel - Year-over-year growth 2024-2029 (%)
- Exhibits86: Chart on Ductile iron - Market size and forecast 2024-2029 ($ million)
- Exhibits87: Data Table on Ductile iron - Market size and forecast 2024-2029 ($ million)
- Exhibits88: Chart on Ductile iron - Year-over-year growth 2024-2029 (%)
- Exhibits89: Data Table on Ductile iron - Year-over-year growth 2024-2029 (%)
- Exhibits90: Chart on Cast steel - Market size and forecast 2024-2029 ($ million)
- Exhibits91: Data Table on Cast steel - Market size and forecast 2024-2029 ($ million)
- Exhibits92: Chart on Cast steel - Year-over-year growth 2024-2029 (%)
- Exhibits93: Data Table on Cast steel - Year-over-year growth 2024-2029 (%)
- Exhibits94: Chart on Others - Market size and forecast 2024-2029 ($ million)
- Exhibits95: Data Table on Others - Market size and forecast 2024-2029 ($ million)
- Exhibits96: Chart on Others - Year-over-year growth 2024-2029 (%)
- Exhibits97: Data Table on Others - Year-over-year growth 2024-2029 (%)
- Exhibits98: Market opportunity by Material ($ million)
- Exhibits99: Data Table on Market opportunity by Material ($ million)
- Exhibits100: Analysis of price sensitivity, lifecycle, customer purchase basket, adoption rates, and purchase criteria
- Exhibits101: Chart on Market share By Geographical Landscape 2024-2029 (%)
- Exhibits102: Data Table on Market share By Geographical Landscape 2024-2029 (%)
- Exhibits103: Chart on Geographic comparison
- Exhibits104: Data Table on Geographic comparison
- Exhibits105: Chart on APAC - Market size and forecast 2024-2029 ($ million)
- Exhibits106: Data Table on APAC - Market size and forecast 2024-2029 ($ million)
- Exhibits107: Chart on APAC - Year-over-year growth 2024-2029 (%)
- Exhibits108: Data Table on APAC - Year-over-year growth 2024-2029 (%)
- Exhibits109: Chart on Europe - Market size and forecast 2024-2029 ($ million)
- Exhibits110: Data Table on Europe - Market size and forecast 2024-2029 ($ million)
- Exhibits111: Chart on Europe - Year-over-year growth 2024-2029 (%)
- Exhibits112: Data Table on Europe - Year-over-year growth 2024-2029 (%)
- Exhibits113: Chart on North America - Market size and forecast 2024-2029 ($ million)
- Exhibits114: Data Table on North America - Market size and forecast 2024-2029 ($ million)
- Exhibits115: Chart on North America - Year-over-year growth 2024-2029 (%)
- Exhibits116: Data Table on North America - Year-over-year growth 2024-2029 (%)
- Exhibits117: Chart on Middle East and Africa - Market size and forecast 2024-2029 ($ million)
- Exhibits118: Data Table on Middle East and Africa - Market size and forecast 2024-2029 ($ million)
- Exhibits119: Chart on Middle East and Africa - Year-over-year growth 2024-2029 (%)
- Exhibits120: Data Table on Middle East and Africa - Year-over-year growth 2024-2029 (%)
- Exhibits121: Chart on South America - Market size and forecast 2024-2029 ($ million)
- Exhibits122: Data Table on South America - Market size and forecast 2024-2029 ($ million)
- Exhibits123: Chart on South America - Year-over-year growth 2024-2029 (%)
- Exhibits124: Data Table on South America - Year-over-year growth 2024-2029 (%)
- Exhibits125: Chart on China - Market size and forecast 2024-2029 ($ million)
- Exhibits126: Data Table on China - Market size and forecast 2024-2029 ($ million)
- Exhibits127: Chart on China - Year-over-year growth 2024-2029 (%)
- Exhibits128: Data Table on China - Year-over-year growth 2024-2029 (%)
- Exhibits129: Chart on US - Market size and forecast 2024-2029 ($ million)
- Exhibits130: Data Table on US - Market size and forecast 2024-2029 ($ million)
- Exhibits131: Chart on US - Year-over-year growth 2024-2029 (%)
- Exhibits132: Data Table on US - Year-over-year growth 2024-2029 (%)
- Exhibits133: Chart on India - Market size and forecast 2024-2029 ($ million)
- Exhibits134: Data Table on India - Market size and forecast 2024-2029 ($ million)
- Exhibits135: Chart on India - Year-over-year growth 2024-2029 (%)
- Exhibits136: Data Table on India - Year-over-year growth 2024-2029 (%)
- Exhibits137: Chart on Russia - Market size and forecast 2024-2029 ($ million)
- Exhibits138: Data Table on Russia - Market size and forecast 2024-2029 ($ million)
- Exhibits139: Chart on Russia - Year-over-year growth 2024-2029 (%)
- Exhibits140: Data Table on Russia - Year-over-year growth 2024-2029 (%)
- Exhibits141: Chart on Japan - Market size and forecast 2024-2029 ($ million)
- Exhibits142: Data Table on Japan - Market size and forecast 2024-2029 ($ million)
- Exhibits143: Chart on Japan - Year-over-year growth 2024-2029 (%)
- Exhibits144: Data Table on Japan - Year-over-year growth 2024-2029 (%)
- Exhibits145: Chart on UK - Market size and forecast 2024-2029 ($ million)
- Exhibits146: Data Table on UK - Market size and forecast 2024-2029 ($ million)
- Exhibits147: Chart on UK - Year-over-year growth 2024-2029 (%)
- Exhibits148: Data Table on UK - Year-over-year growth 2024-2029 (%)
- Exhibits149: Chart on South Korea - Market size and forecast 2024-2029 ($ million)
- Exhibits150: Data Table on South Korea - Market size and forecast 2024-2029 ($ million)
- Exhibits151: Chart on South Korea - Year-over-year growth 2024-2029 (%)
- Exhibits152: Data Table on South Korea - Year-over-year growth 2024-2029 (%)
- Exhibits153: Chart on Germany - Market size and forecast 2024-2029 ($ million)
- Exhibits154: Data Table on Germany - Market size and forecast 2024-2029 ($ million)
- Exhibits155: Chart on Germany - Year-over-year growth 2024-2029 (%)
- Exhibits156: Data Table on Germany - Year-over-year growth 2024-2029 (%)
- Exhibits157: Chart on Canada - Market size and forecast 2024-2029 ($ million)
- Exhibits158: Data Table on Canada - Market size and forecast 2024-2029 ($ million)
- Exhibits159: Chart on Canada - Year-over-year growth 2024-2029 (%)
- Exhibits160: Data Table on Canada - Year-over-year growth 2024-2029 (%)
- Exhibits161: Chart on France - Market size and forecast 2024-2029 ($ million)
- Exhibits162: Data Table on France - Market size and forecast 2024-2029 ($ million)
- Exhibits163: Chart on France - Year-over-year growth 2024-2029 (%)
- Exhibits164: Data Table on France - Year-over-year growth 2024-2029 (%)
- Exhibits165: Market opportunity By Geographical Landscape ($ million)
- Exhibits166: Data Tables on Market opportunity By Geographical Landscape ($ million)
- Exhibits167: Impact of drivers and challenges in 2024 and 2029
- Exhibits168: Overview on criticality of inputs and factors of differentiation
- Exhibits169: Overview on factors of disruption
- Exhibits170: Impact of key risks on business
- Exhibits171: Companies covered
- Exhibits172: Company ranking index
- Exhibits173: Matrix on companies position and classification
- Exhibits174: ASHOKA MACHORD PVT. LTD. - Overview
- Exhibits175: ASHOKA MACHORD PVT. LTD. - Product / Service
- Exhibits176: ASHOKA MACHORD PVT. LTD. - Key offerings
- Exhibits177: SWOT
- Exhibits178: Chanderpur Group - Overview
- Exhibits179: Chanderpur Group - Product / Service
- Exhibits180: Chanderpur Group - Key offerings
- Exhibits181: SWOT
- Exhibits182: DB Santasalo Sarl - Overview
- Exhibits183: DB Santasalo Sarl - Product / Service
- Exhibits184: DB Santasalo Sarl - Key offerings
- Exhibits185: SWOT
- Exhibits186: FLSmidth and Co. AS - Overview
- Exhibits187: FLSmidth and Co. AS - Business segments
- Exhibits188: FLSmidth and Co. AS - Key news
- Exhibits189: FLSmidth and Co. AS - Key offerings
- Exhibits190: FLSmidth and Co. AS - Segment focus
- Exhibits191: SWOT
- Exhibits192: Galbiati Costruzioni Meccaniche Srl - Overview
- Exhibits193: Galbiati Costruzioni Meccaniche Srl - Product / Service
- Exhibits194: Galbiati Costruzioni Meccaniche Srl - Key offerings
- Exhibits195: SWOT
- Exhibits196: Harcliff Mining Services Pty Ltd. - Overview
- Exhibits197: Harcliff Mining Services Pty Ltd. - Product / Service
- Exhibits198: Harcliff Mining Services Pty Ltd. - Key offerings
- Exhibits199: SWOT
- Exhibits200: Kohara Gear Industry Co. Ltd. - Overview
- Exhibits201: Kohara Gear Industry Co. Ltd. - Product / Service
- Exhibits202: Kohara Gear Industry Co. Ltd. - Key offerings
- Exhibits203: SWOT
- Exhibits204: Kumera Corp. - Overview
- Exhibits205: Kumera Corp. - Product / Service
- Exhibits206: Kumera Corp. - Key offerings
- Exhibits207: SWOT
- Exhibits208: Nippon Chuzo K.K. - Overview
- Exhibits209: Nippon Chuzo K.K. - Product / Service
- Exhibits210: Nippon Chuzo K.K. - Key offerings
- Exhibits211: SWOT
- Exhibits212: P. van der Wegen Gears - Overview
- Exhibits213: P. van der Wegen Gears - Product / Service
- Exhibits214: P. van der Wegen Gears - Key offerings
- Exhibits215: SWOT
- Exhibits216: SEW-EURODRIVE GmbH and Co KG - Overview
- Exhibits217: SEW-EURODRIVE GmbH and Co KG - Product / Service
- Exhibits218: SEW-EURODRIVE GmbH and Co KG - Key offerings
- Exhibits219: SWOT
- Exhibits220: Siemens AG - Overview
- Exhibits221: Siemens AG - Business segments
- Exhibits222: Siemens AG - Key news
- Exhibits223: Siemens AG - Key offerings
- Exhibits224: Siemens AG - Segment focus
- Exhibits225: SWOT
- Exhibits226: SYMMEN - Overview
- Exhibits227: SYMMEN - Product / Service
- Exhibits228: SYMMEN - Key offerings
- Exhibits229: SWOT
- Exhibits230: The KCP Ltd. - Overview
- Exhibits231: The KCP Ltd. - Product / Service
- Exhibits232: The KCP Ltd. - Key offerings
- Exhibits233: SWOT
- Exhibits234: Xinxiang Great Wall Machinery Co. Ltd. - Overview
- Exhibits235: Xinxiang Great Wall Machinery Co. Ltd. - Product / Service
- Exhibits236: Xinxiang Great Wall Machinery Co. Ltd. - Key offerings
- Exhibits237: SWOT
- Exhibits238: Inclusions checklist
- Exhibits239: Exclusions checklist
- Exhibits240: Currency conversion rates for US$
- Exhibits241: Research methodology
- Exhibits242: Information sources
- Exhibits243: Data validation
- Exhibits244: Validation techniques employed for market sizing
- Exhibits245: Data synthesis
- Exhibits246: 360 degree market analysis
- Exhibits247: List of abbreviations
The industrial girth gear market is forecasted to grow by USD 62.9 mn during 2024-2029, accelerating at a CAGR of 2.1% during the forecast period. The report on the industrial girth gear market provides a holistic analysis, market size and forecast, trends, growth drivers, and challenges, as well as vendor analysis covering around 25 vendors.
The report offers an up-to-date analysis regarding the current market scenario, the latest trends and drivers, and the overall market environment. The market is driven by improvement in girth gear manufacturing technologies, expansion activities and setting up of new cement plants, and augmented demand for industrial girth gears in apac.
| Market Scope | |
|---|---|
| Base Year | 2025 |
| End Year | 2029 |
| Series Year | 2025-2029 |
| Growth Momentum | Accelerate |
| YOY 2025 | 2.1% |
| CAGR | 2.1% |
| Incremental Value | $62.9 mn |
The study was conducted using an objective combination of primary and secondary information including inputs from key participants in the industry. The report contains a comprehensive market size data, segment with regional analysis and vendor landscape in addition to an analysis of the key companies. Reports have historic and forecast data.
Technavio's industrial girth gear market is segmented as below:
By Type
- Flange mounted girth gear
- Tangential spring mounted girth gear
By Application
- Cement
- Mining
- Chemical and petrochemicals
- Metal fabrication
- Others
By Material
- Alloy steel
- Ductile iron
- Cast steel
- Others
By Geographical Landscape
- APAC
- Europe
- North America
- Middle East and Africa
- South America
This study identifies the growing investments in solid waste management as one of the prime reasons driving the industrial girth gear market growth during the next few years. Also, increased focus on service and maintenance of girth gears and consolidation in cement industry will lead to sizable demand in the market.
The report on the industrial girth gear market covers the following areas:
- Industrial Girth Gear Market sizing
- Industrial Girth Gear Market forecast
- Industrial Girth Gear Market industry analysis
The robust vendor analysis is designed to help clients improve their market position, and in line with this, this report provides a detailed analysis of several leading industrial girth gear market vendors that include ASHOKA MACHORD PVT. LTD., Chanderpur Group, DB Santasalo Sarl, FLSmidth and Co. AS, Galbiati Costruzioni Meccaniche Srl, Harcliff Mining Services Pty Ltd., Hofmann Engineering Pty Ltd., Kohara Gear Industry Co. Ltd., Kumera Corp., Marshall Gears, Nippon Chuzo K.K., P. van der Wegen Gears, SEW-EURODRIVE GmbH and Co KG, Siemens AG, Stotz Gears Pvt. Ltd., SYMMEN, The KCP Ltd., Ueda Heavy Gear Works Ltd., VULCAN Industrial Engg. Co. Pvt. Ltd., and Xinxiang Great Wall Machinery Co. Ltd.. Also, the industrial girth gear market analysis report includes information on upcoming trends and challenges that will influence market growth. This is to help companies strategize and leverage all forthcoming growth opportunities.
The publisher presents a detailed picture of the market by the way of study, synthesis, and summation of data from multiple sources by an analysis of key parameters such as profit, pricing, competition, and promotions. It presents various market facets by identifying the key industry influencers. The data presented is comprehensive, reliable, and a result of extensive primary and secondary research. The market research reports provide a complete competitive landscape and an in-depth vendor selection methodology and analysis using qualitative and quantitative research to forecast accurate market growth.
Table of Contents
1 Executive Summary
- 1.1 Market overview
- Executive Summary - Chart on Market Overview
- Executive Summary - Data Table on Market Overview
- Executive Summary - Chart on Global Market Characteristics
- Executive Summary - Chart on Market By Geographical Landscape
- Executive Summary - Chart on Market Segmentation by Type
- Executive Summary - Chart on Market Segmentation by Application
- Executive Summary - Chart on Market Segmentation by Material
- Executive Summary - Chart on Incremental Growth
- Executive Summary - Data Table on Incremental Growth
- Executive Summary - Chart on Company Market Positioning
2 Technavio Analysis
- 2.1 Analysis of price sensitivity, lifecycle, customer purchase basket, adoption rates, and purchase criteria
- Analysis of price sensitivity, lifecycle, customer purchase basket, adoption rates, and purchase criteria
- 2.2 Criticality of inputs and Factors of differentiation
- Overview on criticality of inputs and factors of differentiation
- 2.3 Factors of disruption
- Overview on factors of disruption
- 2.4 Impact of drivers and challenges
- Impact of drivers and challenges in 2024 and 2029
3 Market Landscape
- 3.1 Market ecosystem
- Parent Market
- Data Table on - Parent Market
- 3.2 Market characteristics
- Market characteristics analysis
- 3.3 Value chain analysis
- Value chain analysis
4 Market Sizing
- 4.1 Market definition
- Offerings of companies included in the market definition
- 4.2 Market segment analysis
- Market segments
- 4.3 Market size 2024
- 4.4 Market outlook: Forecast for 2024-2029
- Chart on Global - Market size and forecast 2024-2029 ($ million)
- Data Table on Global - Market size and forecast 2024-2029 ($ million)
- Chart on Global Market: Year-over-year growth 2024-2029 (%)
- Data Table on Global Market: Year-over-year growth 2024-2029 (%)
5 Historic Market Size
- 5.1 Global Industrial Girth Gear Market 2019 - 2023
- Historic Market Size - Data Table on Global Industrial Girth Gear Market 2019 - 2023 ($ million)
- 5.2 Type segment analysis 2019 - 2023
- Historic Market Size - Type Segment 2019 - 2023 ($ million)
- 5.3 Application segment analysis 2019 - 2023
- Historic Market Size - Application Segment 2019 - 2023 ($ million)
- 5.4 Material segment analysis 2019 - 2023
- Historic Market Size - Material Segment 2019 - 2023 ($ million)
- 5.5 Geography segment analysis 2019 - 2023
- Historic Market Size - Geography Segment 2019 - 2023 ($ million)
- 5.6 Country segment analysis 2019 - 2023
- Historic Market Size - Country Segment 2019 - 2023 ($ million)
6 Qualitative Analysis
- 6.1 The AI impact on global industrial girth gear market
7 Five Forces Analysis
- 7.1 Five forces summary
- Five forces analysis - Comparison between 2024 and 2029
- 7.2 Bargaining power of buyers
- Bargaining power of buyers - Impact of key factors 2024 and 2029
- 7.3 Bargaining power of suppliers
- Bargaining power of suppliers - Impact of key factors in 2024 and 2029
- 7.4 Threat of new entrants
- Threat of new entrants - Impact of key factors in 2024 and 2029
- 7.5 Threat of substitutes
- Threat of substitutes - Impact of key factors in 2024 and 2029
- 7.6 Threat of rivalry
- Threat of rivalry - Impact of key factors in 2024 and 2029
- 7.7 Market condition
- Chart on Market condition - Five forces 2024 and 2029
8 Market Segmentation by Type
- 8.1 Market segments
- Chart on Type - Market share 2024-2029 (%)
- Data Table on Type - Market share 2024-2029 (%)
- 8.2 Comparison by Type
- Chart on Comparison by Type
- Data Table on Comparison by Type
- 8.3 Flange mounted girth gear - Market size and forecast 2024-2029
- Chart on Flange mounted girth gear - Market size and forecast 2024-2029 ($ million)
- Data Table on Flange mounted girth gear - Market size and forecast 2024-2029 ($ million)
- Chart on Flange mounted girth gear - Year-over-year growth 2024-2029 (%)
- Data Table on Flange mounted girth gear - Year-over-year growth 2024-2029 (%)
- 8.4 Tangential spring mounted girth gear - Market size and forecast 2024-2029
- Chart on Tangential spring mounted girth gear - Market size and forecast 2024-2029 ($ million)
- Data Table on Tangential spring mounted girth gear - Market size and forecast 2024-2029 ($ million)
- Chart on Tangential spring mounted girth gear - Year-over-year growth 2024-2029 (%)
- Data Table on Tangential spring mounted girth gear - Year-over-year growth 2024-2029 (%)
- 8.5 Market opportunity by Type
- Market opportunity by Type ($ million)
- Data Table on Market opportunity by Type ($ million)
9 Market Segmentation by Application
- 9.1 Market segments
- Chart on Application - Market share 2024-2029 (%)
- Data Table on Application - Market share 2024-2029 (%)
- 9.2 Comparison by Application
- Chart on Comparison by Application
- Data Table on Comparison by Application
- 9.3 Cement - Market size and forecast 2024-2029
- Chart on Cement - Market size and forecast 2024-2029 ($ million)
- Data Table on Cement - Market size and forecast 2024-2029 ($ million)
- Chart on Cement - Year-over-year growth 2024-2029 (%)
- Data Table on Cement - Year-over-year growth 2024-2029 (%)
- 9.4 Mining - Market size and forecast 2024-2029
- Chart on Mining - Market size and forecast 2024-2029 ($ million)
- Data Table on Mining - Market size and forecast 2024-2029 ($ million)
- Chart on Mining - Year-over-year growth 2024-2029 (%)
- Data Table on Mining - Year-over-year growth 2024-2029 (%)
- 9.5 Chemical and petrochemicals - Market size and forecast 2024-2029
- Chart on Chemical and petrochemicals - Market size and forecast 2024-2029 ($ million)
- Data Table on Chemical and petrochemicals - Market size and forecast 2024-2029 ($ million)
- Chart on Chemical and petrochemicals - Year-over-year growth 2024-2029 (%)
- Data Table on Chemical and petrochemicals - Year-over-year growth 2024-2029 (%)
- 9.6 Metal fabrication - Market size and forecast 2024-2029
- Chart on Metal fabrication - Market size and forecast 2024-2029 ($ million)
- Data Table on Metal fabrication - Market size and forecast 2024-2029 ($ million)
- Chart on Metal fabrication - Year-over-year growth 2024-2029 (%)
- Data Table on Metal fabrication - Year-over-year growth 2024-2029 (%)
- 9.7 Others - Market size and forecast 2024-2029
- Chart on Others - Market size and forecast 2024-2029 ($ million)
- Data Table on Others - Market size and forecast 2024-2029 ($ million)
- Chart on Others - Year-over-year growth 2024-2029 (%)
- Data Table on Others - Year-over-year growth 2024-2029 (%)
- 9.8 Market opportunity by Application
- Market opportunity by Application ($ million)
- Data Table on Market opportunity by Application ($ million)
10 Market Segmentation by Material
- 10.1 Market segments
- Chart on Material - Market share 2024-2029 (%)
- Data Table on Material - Market share 2024-2029 (%)
- 10.2 Comparison by Material
- Chart on Comparison by Material
- Data Table on Comparison by Material
- 10.3 Alloy steel - Market size and forecast 2024-2029
- Chart on Alloy steel - Market size and forecast 2024-2029 ($ million)
- Data Table on Alloy steel - Market size and forecast 2024-2029 ($ million)
- Chart on Alloy steel - Year-over-year growth 2024-2029 (%)
- Data Table on Alloy steel - Year-over-year growth 2024-2029 (%)
- 10.4 Ductile iron - Market size and forecast 2024-2029
- Chart on Ductile iron - Market size and forecast 2024-2029 ($ million)
- Data Table on Ductile iron - Market size and forecast 2024-2029 ($ million)
- Chart on Ductile iron - Year-over-year growth 2024-2029 (%)
- Data Table on Ductile iron - Year-over-year growth 2024-2029 (%)
- 10.5 Cast steel - Market size and forecast 2024-2029
- Chart on Cast steel - Market size and forecast 2024-2029 ($ million)
- Data Table on Cast steel - Market size and forecast 2024-2029 ($ million)
- Chart on Cast steel - Year-over-year growth 2024-2029 (%)
- Data Table on Cast steel - Year-over-year growth 2024-2029 (%)
- 10.6 Others - Market size and forecast 2024-2029
- Chart on Others - Market size and forecast 2024-2029 ($ million)
- Data Table on Others - Market size and forecast 2024-2029 ($ million)
- Chart on Others - Year-over-year growth 2024-2029 (%)
- Data Table on Others - Year-over-year growth 2024-2029 (%)
- 10.7 Market opportunity by Material
- Market opportunity by Material ($ million)
- Data Table on Market opportunity by Material ($ million)
11 Customer Landscape
- 11.1 Customer landscape overview
- Analysis of price sensitivity, lifecycle, customer purchase basket, adoption rates, and purchase criteria
12 Geographic Landscape
- 12.1 Geographic segmentation
- Chart on Market share By Geographical Landscape 2024-2029 (%)
- Data Table on Market share By Geographical Landscape 2024-2029 (%)
- 12.2 Geographic comparison
- Chart on Geographic comparison
- Data Table on Geographic comparison
- 12.3 APAC - Market size and forecast 2024-2029
- Chart on APAC - Market size and forecast 2024-2029 ($ million)
- Data Table on APAC - Market size and forecast 2024-2029 ($ million)
- Chart on APAC - Year-over-year growth 2024-2029 (%)
- Data Table on APAC - Year-over-year growth 2024-2029 (%)
- 12.4 Europe - Market size and forecast 2024-2029
- Chart on Europe - Market size and forecast 2024-2029 ($ million)
- Data Table on Europe - Market size and forecast 2024-2029 ($ million)
- Chart on Europe - Year-over-year growth 2024-2029 (%)
- Data Table on Europe - Year-over-year growth 2024-2029 (%)
- 12.5 North America - Market size and forecast 2024-2029
- Chart on North America - Market size and forecast 2024-2029 ($ million)
- Data Table on North America - Market size and forecast 2024-2029 ($ million)
- Chart on North America - Year-over-year growth 2024-2029 (%)
- Data Table on North America - Year-over-year growth 2024-2029 (%)
- 12.6 Middle East and Africa - Market size and forecast 2024-2029
- Chart on Middle East and Africa - Market size and forecast 2024-2029 ($ million)
- Data Table on Middle East and Africa - Market size and forecast 2024-2029 ($ million)
- Chart on Middle East and Africa - Year-over-year growth 2024-2029 (%)
- Data Table on Middle East and Africa - Year-over-year growth 2024-2029 (%)
- 12.7 South America - Market size and forecast 2024-2029
- Chart on South America - Market size and forecast 2024-2029 ($ million)
- Data Table on South America - Market size and forecast 2024-2029 ($ million)
- Chart on South America - Year-over-year growth 2024-2029 (%)
- Data Table on South America - Year-over-year growth 2024-2029 (%)
- 12.8 China - Market size and forecast 2024-2029
- Chart on China - Market size and forecast 2024-2029 ($ million)
- Data Table on China - Market size and forecast 2024-2029 ($ million)
- Chart on China - Year-over-year growth 2024-2029 (%)
- Data Table on China - Year-over-year growth 2024-2029 (%)
- 12.9 US - Market size and forecast 2024-2029
- Chart on US - Market size and forecast 2024-2029 ($ million)
- Data Table on US - Market size and forecast 2024-2029 ($ million)
- Chart on US - Year-over-year growth 2024-2029 (%)
- Data Table on US - Year-over-year growth 2024-2029 (%)
- 12.10 India - Market size and forecast 2024-2029
- Chart on India - Market size and forecast 2024-2029 ($ million)
- Data Table on India - Market size and forecast 2024-2029 ($ million)
- Chart on India - Year-over-year growth 2024-2029 (%)
- Data Table on India - Year-over-year growth 2024-2029 (%)
- 12.11 Russia - Market size and forecast 2024-2029
- Chart on Russia - Market size and forecast 2024-2029 ($ million)
- Data Table on Russia - Market size and forecast 2024-2029 ($ million)
- Chart on Russia - Year-over-year growth 2024-2029 (%)
- Data Table on Russia - Year-over-year growth 2024-2029 (%)
- 12.12 Japan - Market size and forecast 2024-2029
- Chart on Japan - Market size and forecast 2024-2029 ($ million)
- Data Table on Japan - Market size and forecast 2024-2029 ($ million)
- Chart on Japan - Year-over-year growth 2024-2029 (%)
- Data Table on Japan - Year-over-year growth 2024-2029 (%)
- 12.13 UK - Market size and forecast 2024-2029
- Chart on UK - Market size and forecast 2024-2029 ($ million)
- Data Table on UK - Market size and forecast 2024-2029 ($ million)
- Chart on UK - Year-over-year growth 2024-2029 (%)
- Data Table on UK - Year-over-year growth 2024-2029 (%)
- 12.14 South Korea - Market size and forecast 2024-2029
- Chart on South Korea - Market size and forecast 2024-2029 ($ million)
- Data Table on South Korea - Market size and forecast 2024-2029 ($ million)
- Chart on South Korea - Year-over-year growth 2024-2029 (%)
- Data Table on South Korea - Year-over-year growth 2024-2029 (%)
- 12.15 Germany - Market size and forecast 2024-2029
- Chart on Germany - Market size and forecast 2024-2029 ($ million)
- Data Table on Germany - Market size and forecast 2024-2029 ($ million)
- Chart on Germany - Year-over-year growth 2024-2029 (%)
- Data Table on Germany - Year-over-year growth 2024-2029 (%)
- 12.16 Canada - Market size and forecast 2024-2029
- Chart on Canada - Market size and forecast 2024-2029 ($ million)
- Data Table on Canada - Market size and forecast 2024-2029 ($ million)
- Chart on Canada - Year-over-year growth 2024-2029 (%)
- Data Table on Canada - Year-over-year growth 2024-2029 (%)
- 12.17 France - Market size and forecast 2024-2029
- Chart on France - Market size and forecast 2024-2029 ($ million)
- Data Table on France - Market size and forecast 2024-2029 ($ million)
- Chart on France - Year-over-year growth 2024-2029 (%)
- Data Table on France - Year-over-year growth 2024-2029 (%)
- 12.18 Market opportunity By Geographical Landscape
- Market opportunity By Geographical Landscape ($ million)
- Data Tables on Market opportunity By Geographical Landscape ($ million)
13 Drivers, Challenges, and Opportunity/Restraints
- 13.1 Market drivers
- 13.2 Market challenges
- 13.3 Impact of drivers and challenges
- Impact of drivers and challenges in 2024 and 2029
- 13.4 Market opportunities/restraints
14 Competitive Landscape
- 14.1 Overview
- 14.2 Competitive Landscape
- Overview on criticality of inputs and factors of differentiation
- 14.3 Landscape disruption
- Overview on factors of disruption
- 14.4 Industry risks
- Impact of key risks on business
15 Competitive Analysis
- 15.1 Companies profiled
- Companies covered
- 15.2 Company ranking index
- Company ranking index
- 15.3 Market positioning of companies
- Matrix on companies position and classification
- 15.4 ASHOKA MACHORD PVT. LTD.
- ASHOKA MACHORD PVT. LTD. - Overview
- ASHOKA MACHORD PVT. LTD. - Product / Service
- ASHOKA MACHORD PVT. LTD. - Key offerings
- SWOT
- 15.5 Chanderpur Group
- Chanderpur Group - Overview
- Chanderpur Group - Product / Service
- Chanderpur Group - Key offerings
- SWOT
- 15.6 DB Santasalo Sarl
- DB Santasalo Sarl - Overview
- DB Santasalo Sarl - Product / Service
- DB Santasalo Sarl - Key offerings
- SWOT
- 15.7 FLSmidth and Co. AS
- FLSmidth and Co. AS - Overview
- FLSmidth and Co. AS - Business segments
- FLSmidth and Co. AS - Key news
- FLSmidth and Co. AS - Key offerings
- FLSmidth and Co. AS - Segment focus
- SWOT
- 15.8 Galbiati Costruzioni Meccaniche Srl
- Galbiati Costruzioni Meccaniche Srl - Overview
- Galbiati Costruzioni Meccaniche Srl - Product / Service
- Galbiati Costruzioni Meccaniche Srl - Key offerings
- SWOT
- 15.9 Harcliff Mining Services Pty Ltd.
- Harcliff Mining Services Pty Ltd. - Overview
- Harcliff Mining Services Pty Ltd. - Product / Service
- Harcliff Mining Services Pty Ltd. - Key offerings
- SWOT
- 15.10 Kohara Gear Industry Co. Ltd.
- Kohara Gear Industry Co. Ltd. - Overview
- Kohara Gear Industry Co. Ltd. - Product / Service
- Kohara Gear Industry Co. Ltd. - Key offerings
- SWOT
- 15.11 Kumera Corp.
- Kumera Corp. - Overview
- Kumera Corp. - Product / Service
- Kumera Corp. - Key offerings
- SWOT
- 15.12 Nippon Chuzo K.K.
- Nippon Chuzo K.K. - Overview
- Nippon Chuzo K.K. - Product / Service
- Nippon Chuzo K.K. - Key offerings
- SWOT
- 15.13 P. van der Wegen Gears
- P. van der Wegen Gears - Overview
- P. van der Wegen Gears - Product / Service
- P. van der Wegen Gears - Key offerings
- SWOT
- 15.14 SEW-EURODRIVE GmbH and Co KG
- SEW-EURODRIVE GmbH and Co KG - Overview
- SEW-EURODRIVE GmbH and Co KG - Product / Service
- SEW-EURODRIVE GmbH and Co KG - Key offerings
- SWOT
- 15.15 Siemens AG
- Siemens AG - Overview
- Siemens AG - Business segments
- Siemens AG - Key news
- Siemens AG - Key offerings
- Siemens AG - Segment focus
- SWOT
- 15.16 SYMMEN
- SYMMEN - Overview
- SYMMEN - Product / Service
- SYMMEN - Key offerings
- SWOT
- 15.17 The KCP Ltd.
- The KCP Ltd. - Overview
- The KCP Ltd. - Product / Service
- The KCP Ltd. - Key offerings
- SWOT
- 15.18 Xinxiang Great Wall Machinery Co. Ltd.
- Xinxiang Great Wall Machinery Co. Ltd. - Overview
- Xinxiang Great Wall Machinery Co. Ltd. - Product / Service
- Xinxiang Great Wall Machinery Co. Ltd. - Key offerings
- SWOT
16 Appendix
- 16.1 Scope of the report
- 16.2 Inclusions and exclusions checklist
- Inclusions checklist
- Exclusions checklist
- 16.3 Currency conversion rates for US$
- Currency conversion rates for US$
- 16.4 Research methodology
- Research methodology
- 16.5 Data procurement
- Information sources
- 16.6 Data validation
- Data validation
- 16.7 Validation techniques employed for market sizing
- Validation techniques employed for market sizing
- 16.8 Data synthesis
- Data synthesis
- 16.9 360 degree market analysis
- 360 degree market analysis
- 16.10 List of abbreviations
- List of abbreviations

