|
|
市場調査レポート
商品コード
1719504
高純度亜鉛の世界市場 2025-2029Global High Purity Zinc Market 2025-2029 |
||||||

|
|||||||
カスタマイズ可能
|
|||||||

| 高純度亜鉛の世界市場 2025-2029 |
|
出版日: 2025年04月24日
発行: TechNavio
ページ情報: 英文 0 Pages
納期: 即納可能
|

全表示
- 概要
- 図表
- 目次
高純度亜鉛市場は2024-2029年に1億1,030万米ドル、予測期間中のCAGRは5.2%で成長すると予測されます。
当レポートでは、高純度亜鉛市場の全体的な分析、市場規模・予測、動向、成長促進要因、課題、約25のベンダーを網羅したベンダー分析などを掲載しています。
現在の市場シナリオ、最新動向と促進要因、市場環境全体に関する最新分析を提供しています。市場は、エレクトロニクスと半導体の需要拡大、電気自動車生産の増加、新興国における急速な工業化によって牽引されています。
| 市場範囲 | |
|---|---|
| 基準年 | 2025 |
| 終了年 | 2029 |
| 予測期間 | 2025-2029 |
| 成長モメンタム | 加速 |
| 前年比2025年 | 4.8% |
| CAGR | 5.2% |
| 増分額 | 1億1,030万米ドル |
本調査は、業界の主要参加者からのインプットを含め、一次情報と二次情報を客観的に組み合わせて実施しました。レポートには、主要企業の分析に加え、包括的な市場規模データ、地域別分析によるセグメント、ベンダー情勢が含まれています。レポートには過去データと予測データがあります。
本調査では、新製品の導入が今後数年間の高純度亜鉛市場の成長を促進する主要因の1つであると特定しています。また、生産能力の拡大や再生可能エネルギー分野の拡大に注力することで、同市場における大きな需要が見込まれます。
目次
第1章 エグゼクティブサマリー
- 市場概要
第2章 Technavio分析
- 価格・ライフサイクル・顧客購入バスケット・採用率・購入基準の分析
- インプットの重要性と差別化の要因
- 混乱の要因
- 促進要因と課題の影響
第3章 市場情勢
- 市場エコシステム
- 市場の特徴
- バリューチェーン分析
第4章 市場規模
- 市場の定義
- 市場セグメント分析
- 市場規模 2024
- 市場の見通し 2024-2029
第5章 市場規模実績
- 高純度亜鉛の世界市場 2019-2023
- 学年タイプセグメント分析 2019-2023
- 用途別セグメント分析 2019-2023
- 地域別セグメント分析 2019-2023
- 国別セグメント分析 2019-2023
第6章 定性分析
- 米国関税の影響分析高純度亜鉛の世界市場
第7章 ファイブフォース分析
- ファイブフォースの要約
- 買い手の交渉力
- 供給企業の交渉力
- 新規参入業者の脅威
- 代替品の脅威
- 競争の脅威
- 市況
第8章 市場セグメンテーション:グレードタイプ別
- 市場セグメント
- 比較:グレードタイプ別
- 特級品:市場規模と予測 2024-2029
- 超特級高級:市場規模と予測 2024-2029
- 市場機会:グレードタイプ別
第9章 市場セグメンテーション:用途別
- 市場セグメント
- 比較:用途別
- 電子機器および半導体:市場規模と予測 2024-2029
- 合金および特殊材料:市場規模と予測 2024-2029
- 電池:市場規模と予測 2024-2029
- 医薬品および化粧品:市場規模と予測 2024-2029
- 研究室:市場規模と予測 2024-2029
- 市場機会:用途別
第10章 顧客情勢
- 顧客情勢の概要
第11章 地域別情勢
- 地域別セグメンテーション
- 地域別比較
- アジア太平洋:市場規模と予測 2024-2029
- 北米:市場規模と予測 2024-2029
- 欧州:市場規模と予測 2024-2029
- 南米:市場規模と予測 2024-2029
- 中東・アフリカ:市場規模と予測 2024-2029
- 米国:市場規模と予測 2024-2029
- 中国:市場規模と予測 2024-2029
- 日本:市場規模と予測 2024-2029
- インド:市場規模と予測 2024-2029
- ドイツ:市場規模と予測 2024-2029
- 英国:市場規模と予測 2024-2029
- 韓国:市場規模と予測 2024-2029
- カナダ:市場規模と予測 2024-2029
- フランス:市場規模と予測 2024-2029
- スペイン:市場規模と予測 2024-2029
- 市場機会:地域情勢別
第12章 促進要因・課題・機会・抑制要因
- 市場促進要因
- 市場の課題
- 促進要因と課題の影響
- 市場の機会・抑制要因
第13章 競合情勢
- 概要
- 競合情勢
- 混乱の状況
- 業界のリスク
第14章 競合分析
- 企業プロファイル
- 企業ランキング指数
- 企業の市場ポジショニング
- Boliden Group
- China Minmetals Corp.
- Dowa Holdings Co. Ltd.
- Glencore Plc
- Henan Yuguang Zinc Industry Co. Ltd
- Hindustan Zinc Ltd.
- Jiangxi Copper Corp
- Korea Zinc Co. Ltd
- MITSUI MINING and SMELTING CO. LTD.
- Nexa Resources SA
- Nyrstar
- Roy Gostar Jam Co
- Shijiazhuang Zhongli zinc Co. Ltd.
- Teck Resources Ltd.
- Yunnan Chihong Zinc and Germanium Co. Ltd
第15章 付録
Exhibits:
- Exhibits1: Executive Summary - Chart on Market Overview
- Exhibits2: Executive Summary - Data Table on Market Overview
- Exhibits3: Executive Summary - Chart on Global Market Characteristics
- Exhibits4: Executive Summary - Chart on Market By Geographical Landscape
- Exhibits5: Executive Summary - Chart on Market Segmentation by Grade Type
- Exhibits6: Executive Summary - Chart on Market Segmentation by Application
- Exhibits7: Executive Summary - Chart on Incremental Growth
- Exhibits8: Executive Summary - Data Table on Incremental Growth
- Exhibits9: Executive Summary - Chart on Company Market Positioning
- Exhibits10: Analysis of price sensitivity, lifecycle, customer purchase basket, adoption rates, and purchase criteria
- Exhibits11: Overview on criticality of inputs and factors of differentiation
- Exhibits12: Overview on factors of disruption
- Exhibits13: Impact of drivers and challenges in 2024 and 2029
- Exhibits14: Parent Market
- Exhibits15: Data Table on - Parent Market
- Exhibits16: Market characteristics analysis
- Exhibits17: Value chain analysis
- Exhibits18: Offerings of companies included in the market definition
- Exhibits19: Market segments
- Exhibits20: Chart on Global - Market size and forecast 2024-2029 ($ million)
- Exhibits21: Data Table on Global - Market size and forecast 2024-2029 ($ million)
- Exhibits22: Chart on Global Market: Year-over-year growth 2024-2029 (%)
- Exhibits23: Data Table on Global Market: Year-over-year growth 2024-2029 (%)
- Exhibits24: Historic Market Size - Data Table on Global High Purity Zinc Market 2019 - 2023 ($ million)
- Exhibits25: Historic Market Size - Grade Type Segment 2019 - 2023 ($ million)
- Exhibits26: Historic Market Size - Application Segment 2019 - 2023 ($ million)
- Exhibits27: Historic Market Size - Geography Segment 2019 - 2023 ($ million)
- Exhibits28: Historic Market Size - Country Segment 2019 - 2023 ($ million)
- Exhibits29: Five forces analysis - Comparison between 2024 and 2029
- Exhibits30: Bargaining power of buyers - Impact of key factors 2024 and 2029
- Exhibits31: Bargaining power of suppliers - Impact of key factors in 2024 and 2029
- Exhibits32: Threat of new entrants - Impact of key factors in 2024 and 2029
- Exhibits33: Threat of substitutes - Impact of key factors in 2024 and 2029
- Exhibits34: Threat of rivalry - Impact of key factors in 2024 and 2029
- Exhibits35: Chart on Market condition - Five forces 2024 and 2029
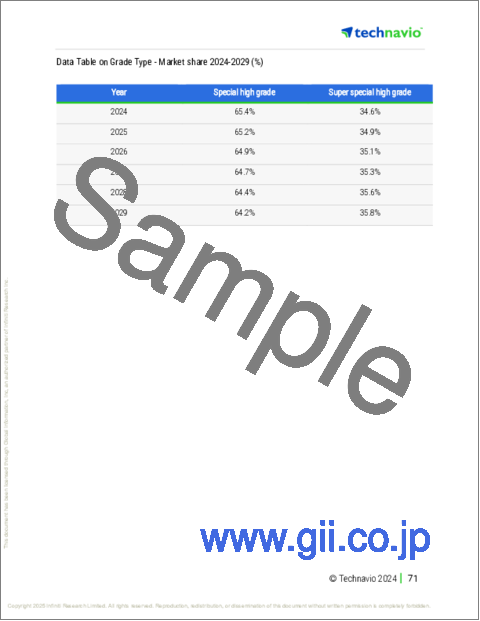
- Exhibits36: Chart on Grade Type - Market share 2024-2029 (%)
- Exhibits37: Data Table on Grade Type - Market share 2024-2029 (%)
- Exhibits38: Chart on Comparison by Grade Type
- Exhibits39: Data Table on Comparison by Grade Type
- Exhibits40: Chart on Special high grade - Market size and forecast 2024-2029 ($ million)
- Exhibits41: Data Table on Special high grade - Market size and forecast 2024-2029 ($ million)
- Exhibits42: Chart on Special high grade - Year-over-year growth 2024-2029 (%)
- Exhibits43: Data Table on Special high grade - Year-over-year growth 2024-2029 (%)
- Exhibits44: Chart on Super special high grade - Market size and forecast 2024-2029 ($ million)
- Exhibits45: Data Table on Super special high grade - Market size and forecast 2024-2029 ($ million)
- Exhibits46: Chart on Super special high grade - Year-over-year growth 2024-2029 (%)
- Exhibits47: Data Table on Super special high grade - Year-over-year growth 2024-2029 (%)
- Exhibits48: Market opportunity by Grade Type ($ million)
- Exhibits49: Data Table on Market opportunity by Grade Type ($ million)
- Exhibits50: Chart on Application - Market share 2024-2029 (%)
- Exhibits51: Data Table on Application - Market share 2024-2029 (%)
- Exhibits52: Chart on Comparison by Application
- Exhibits53: Data Table on Comparison by Application
- Exhibits54: Chart on Electronics and semiconductors - Market size and forecast 2024-2029 ($ million)
- Exhibits55: Data Table on Electronics and semiconductors - Market size and forecast 2024-2029 ($ million)
- Exhibits56: Chart on Electronics and semiconductors - Year-over-year growth 2024-2029 (%)
- Exhibits57: Data Table on Electronics and semiconductors - Year-over-year growth 2024-2029 (%)
- Exhibits58: Chart on Alloys and specialty materials - Market size and forecast 2024-2029 ($ million)
- Exhibits59: Data Table on Alloys and specialty materials - Market size and forecast 2024-2029 ($ million)
- Exhibits60: Chart on Alloys and specialty materials - Year-over-year growth 2024-2029 (%)
- Exhibits61: Data Table on Alloys and specialty materials - Year-over-year growth 2024-2029 (%)
- Exhibits62: Chart on Batteries - Market size and forecast 2024-2029 ($ million)
- Exhibits63: Data Table on Batteries - Market size and forecast 2024-2029 ($ million)
- Exhibits64: Chart on Batteries - Year-over-year growth 2024-2029 (%)
- Exhibits65: Data Table on Batteries - Year-over-year growth 2024-2029 (%)
- Exhibits66: Chart on Pharmaceuticals and cosmetics - Market size and forecast 2024-2029 ($ million)
- Exhibits67: Data Table on Pharmaceuticals and cosmetics - Market size and forecast 2024-2029 ($ million)
- Exhibits68: Chart on Pharmaceuticals and cosmetics - Year-over-year growth 2024-2029 (%)
- Exhibits69: Data Table on Pharmaceuticals and cosmetics - Year-over-year growth 2024-2029 (%)
- Exhibits70: Chart on Laboratory - Market size and forecast 2024-2029 ($ million)
- Exhibits71: Data Table on Laboratory - Market size and forecast 2024-2029 ($ million)
- Exhibits72: Chart on Laboratory - Year-over-year growth 2024-2029 (%)
- Exhibits73: Data Table on Laboratory - Year-over-year growth 2024-2029 (%)
- Exhibits74: Market opportunity by Application ($ million)
- Exhibits75: Data Table on Market opportunity by Application ($ million)
- Exhibits76: Analysis of price sensitivity, lifecycle, customer purchase basket, adoption rates, and purchase criteria
- Exhibits77: Chart on Market share By Geographical Landscape 2024-2029 (%)
- Exhibits78: Data Table on Market share By Geographical Landscape 2024-2029 (%)
- Exhibits79: Chart on Geographic comparison
- Exhibits80: Data Table on Geographic comparison
- Exhibits81: Chart on APAC - Market size and forecast 2024-2029 ($ million)
- Exhibits82: Data Table on APAC - Market size and forecast 2024-2029 ($ million)
- Exhibits83: Chart on APAC - Year-over-year growth 2024-2029 (%)
- Exhibits84: Data Table on APAC - Year-over-year growth 2024-2029 (%)
- Exhibits85: Chart on North America - Market size and forecast 2024-2029 ($ million)
- Exhibits86: Data Table on North America - Market size and forecast 2024-2029 ($ million)
- Exhibits87: Chart on North America - Year-over-year growth 2024-2029 (%)
- Exhibits88: Data Table on North America - Year-over-year growth 2024-2029 (%)
- Exhibits89: Chart on Europe - Market size and forecast 2024-2029 ($ million)
- Exhibits90: Data Table on Europe - Market size and forecast 2024-2029 ($ million)
- Exhibits91: Chart on Europe - Year-over-year growth 2024-2029 (%)
- Exhibits92: Data Table on Europe - Year-over-year growth 2024-2029 (%)
- Exhibits93: Chart on South America - Market size and forecast 2024-2029 ($ million)
- Exhibits94: Data Table on South America - Market size and forecast 2024-2029 ($ million)
- Exhibits95: Chart on South America - Year-over-year growth 2024-2029 (%)
- Exhibits96: Data Table on South America - Year-over-year growth 2024-2029 (%)
- Exhibits97: Chart on Middle East and Africa - Market size and forecast 2024-2029 ($ million)
- Exhibits98: Data Table on Middle East and Africa - Market size and forecast 2024-2029 ($ million)
- Exhibits99: Chart on Middle East and Africa - Year-over-year growth 2024-2029 (%)
- Exhibits100: Data Table on Middle East and Africa - Year-over-year growth 2024-2029 (%)
- Exhibits101: Chart on US - Market size and forecast 2024-2029 ($ million)
- Exhibits102: Data Table on US - Market size and forecast 2024-2029 ($ million)
- Exhibits103: Chart on US - Year-over-year growth 2024-2029 (%)
- Exhibits104: Data Table on US - Year-over-year growth 2024-2029 (%)
- Exhibits105: Chart on China - Market size and forecast 2024-2029 ($ million)
- Exhibits106: Data Table on China - Market size and forecast 2024-2029 ($ million)
- Exhibits107: Chart on China - Year-over-year growth 2024-2029 (%)
- Exhibits108: Data Table on China - Year-over-year growth 2024-2029 (%)
- Exhibits109: Chart on Japan - Market size and forecast 2024-2029 ($ million)
- Exhibits110: Data Table on Japan - Market size and forecast 2024-2029 ($ million)
- Exhibits111: Chart on Japan - Year-over-year growth 2024-2029 (%)
- Exhibits112: Data Table on Japan - Year-over-year growth 2024-2029 (%)
- Exhibits113: Chart on India - Market size and forecast 2024-2029 ($ million)
- Exhibits114: Data Table on India - Market size and forecast 2024-2029 ($ million)
- Exhibits115: Chart on India - Year-over-year growth 2024-2029 (%)
- Exhibits116: Data Table on India - Year-over-year growth 2024-2029 (%)
- Exhibits117: Chart on Germany - Market size and forecast 2024-2029 ($ million)
- Exhibits118: Data Table on Germany - Market size and forecast 2024-2029 ($ million)
- Exhibits119: Chart on Germany - Year-over-year growth 2024-2029 (%)
- Exhibits120: Data Table on Germany - Year-over-year growth 2024-2029 (%)
- Exhibits121: Chart on UK - Market size and forecast 2024-2029 ($ million)
- Exhibits122: Data Table on UK - Market size and forecast 2024-2029 ($ million)
- Exhibits123: Chart on UK - Year-over-year growth 2024-2029 (%)
- Exhibits124: Data Table on UK - Year-over-year growth 2024-2029 (%)
- Exhibits125: Chart on South Korea - Market size and forecast 2024-2029 ($ million)
- Exhibits126: Data Table on South Korea - Market size and forecast 2024-2029 ($ million)
- Exhibits127: Chart on South Korea - Year-over-year growth 2024-2029 (%)
- Exhibits128: Data Table on South Korea - Year-over-year growth 2024-2029 (%)
- Exhibits129: Chart on Canada - Market size and forecast 2024-2029 ($ million)
- Exhibits130: Data Table on Canada - Market size and forecast 2024-2029 ($ million)
- Exhibits131: Chart on Canada - Year-over-year growth 2024-2029 (%)
- Exhibits132: Data Table on Canada - Year-over-year growth 2024-2029 (%)
- Exhibits133: Chart on France - Market size and forecast 2024-2029 ($ million)
- Exhibits134: Data Table on France - Market size and forecast 2024-2029 ($ million)
- Exhibits135: Chart on France - Year-over-year growth 2024-2029 (%)
- Exhibits136: Data Table on France - Year-over-year growth 2024-2029 (%)
- Exhibits137: Chart on Spain - Market size and forecast 2024-2029 ($ million)
- Exhibits138: Data Table on Spain - Market size and forecast 2024-2029 ($ million)
- Exhibits139: Chart on Spain - Year-over-year growth 2024-2029 (%)
- Exhibits140: Data Table on Spain - Year-over-year growth 2024-2029 (%)
- Exhibits141: Market opportunity By Geographical Landscape ($ million)
- Exhibits142: Data Tables on Market opportunity By Geographical Landscape ($ million)
- Exhibits143: Impact of drivers and challenges in 2024 and 2029
- Exhibits144: Overview on criticality of inputs and factors of differentiation
- Exhibits145: Overview on factors of disruption
- Exhibits146: Impact of key risks on business
- Exhibits147: Companies covered
- Exhibits148: Company ranking index
- Exhibits149: Matrix on companies position and classification
- Exhibits150: Boliden Group - Overview
- Exhibits151: Boliden Group - Product / Service
- Exhibits152: Boliden Group - Key offerings
- Exhibits153: SWOT
- Exhibits154: China Minmetals Corp. - Overview
- Exhibits155: China Minmetals Corp. - Product / Service
- Exhibits156: China Minmetals Corp. - Key offerings
- Exhibits157: SWOT
- Exhibits158: Dowa Holdings Co. Ltd. - Overview
- Exhibits159: Dowa Holdings Co. Ltd. - Product / Service
- Exhibits160: Dowa Holdings Co. Ltd. - Key offerings
- Exhibits161: SWOT
- Exhibits162: Glencore Plc - Overview
- Exhibits163: Glencore Plc - Business segments
- Exhibits164: Glencore Plc - Key news
- Exhibits165: Glencore Plc - Key offerings
- Exhibits166: Glencore Plc - Segment focus
- Exhibits167: SWOT
- Exhibits168: Henan Yuguang Zinc Industry Co. Ltd - Overview
- Exhibits169: Henan Yuguang Zinc Industry Co. Ltd - Product / Service
- Exhibits170: Henan Yuguang Zinc Industry Co. Ltd - Key offerings
- Exhibits171: SWOT
- Exhibits172: Hindustan Zinc Ltd. - Overview
- Exhibits173: Hindustan Zinc Ltd. - Business segments
- Exhibits174: Hindustan Zinc Ltd. - Key offerings
- Exhibits175: Hindustan Zinc Ltd. - Segment focus
- Exhibits176: SWOT
- Exhibits177: Jiangxi Copper Corp - Overview
- Exhibits178: Jiangxi Copper Corp - Business segments
- Exhibits179: Jiangxi Copper Corp - Key offerings
- Exhibits180: Jiangxi Copper Corp - Segment focus
- Exhibits181: SWOT
- Exhibits182: Korea Zinc Co. Ltd - Overview
- Exhibits183: Korea Zinc Co. Ltd - Product / Service
- Exhibits184: Korea Zinc Co. Ltd - Key offerings
- Exhibits185: SWOT
- Exhibits186: MITSUI MINING and SMELTING CO. LTD. - Overview
- Exhibits187: MITSUI MINING and SMELTING CO. LTD. - Product / Service
- Exhibits188: MITSUI MINING and SMELTING CO. LTD. - Key offerings
- Exhibits189: SWOT
- Exhibits190: Nexa Resources SA - Overview
- Exhibits191: Nexa Resources SA - Product / Service
- Exhibits192: Nexa Resources SA - Key offerings
- Exhibits193: SWOT
- Exhibits194: Nyrstar - Overview
- Exhibits195: Nyrstar - Product / Service
- Exhibits196: Nyrstar - Key offerings
- Exhibits197: SWOT
- Exhibits198: Roy Gostar Jam Co - Overview
- Exhibits199: Roy Gostar Jam Co - Product / Service
- Exhibits200: Roy Gostar Jam Co - Key offerings
- Exhibits201: SWOT
- Exhibits202: Shijiazhuang Zhongli zinc Co. Ltd. - Overview
- Exhibits203: Shijiazhuang Zhongli zinc Co. Ltd. - Product / Service
- Exhibits204: Shijiazhuang Zhongli zinc Co. Ltd. - Key offerings
- Exhibits205: SWOT
- Exhibits206: Teck Resources Ltd. - Overview
- Exhibits207: Teck Resources Ltd. - Business segments
- Exhibits208: Teck Resources Ltd. - Key offerings
- Exhibits209: Teck Resources Ltd. - Segment focus
- Exhibits210: SWOT
- Exhibits211: Yunnan Chihong Zinc and Germanium Co. Ltd - Overview
- Exhibits212: Yunnan Chihong Zinc and Germanium Co. Ltd - Product / Service
- Exhibits213: Yunnan Chihong Zinc and Germanium Co. Ltd - Key offerings
- Exhibits214: SWOT
- Exhibits215: Inclusions checklist
- Exhibits216: Exclusions checklist
- Exhibits217: Currency conversion rates for US$
- Exhibits218: Research methodology
- Exhibits219: Information sources
- Exhibits220: Data validation
- Exhibits221: Validation techniques employed for market sizing
- Exhibits222: Data synthesis
- Exhibits223: 360 degree market analysis
- Exhibits224: List of abbreviations
The high purity zinc market is forecasted to grow by USD 110.3 mn during 2024-2029, accelerating at a CAGR of 5.2% during the forecast period. The report on the high purity zinc market provides a holistic analysis, market size and forecast, trends, growth drivers, and challenges, as well as vendor analysis covering around 25 vendors.
The report offers an up-to-date analysis regarding the current market scenario, the latest trends and drivers, and the overall market environment. The market is driven by growing demand in electronics and semiconductors, rise in electric vehicle production, and rapid industrialization in emerging economies.
| Market Scope | |
|---|---|
| Base Year | 2025 |
| End Year | 2029 |
| Series Year | 2025-2029 |
| Growth Momentum | Accelerate |
| YOY 2025 | 4.8% |
| CAGR | 5.2% |
| Incremental Value | $110.3 mn |
The study was conducted using an objective combination of primary and secondary information including inputs from key participants in the industry. The report contains a comprehensive market size data, segment with regional analysis and vendor landscape in addition to an analysis of the key companies. Reports have historic and forecast data.
Technavio's high purity zinc market is segmented as below:
By Grade Type
- Special high grade
- Super special high grade
By Application
- Electronics and semiconductors
- Alloys and specialty materials
- Batteries
- Pharmaceuticals and cosmetics
- Laboratory
By Geographical Landscape
- APAC
- North America
- Europe
- South America
- Middle East and Africa
This study identifies the introduction of new products as one of the prime reasons driving the high purity zinc market growth during the next few years. Also, focus on production capacity expansion and expansion of renewable energy sector will lead to sizable demand in the market.
The report on the high purity zinc market covers the following areas:
- High Purity Zinc Market sizing
- High Purity Zinc Market forecast
- High Purity Zinc Market industry analysis
The robust vendor analysis is designed to help clients improve their market position, and in line with this, this report provides a detailed analysis of several leading high purity zinc market vendors that include Boliden Group, China Minmetals Corp., Dowa Holdings Co. Ltd., Glencore Plc, Henan Yuguang Zinc Industry Co. Ltd, Hindustan Zinc Ltd., Jiangxi Copper Corp, Korea Zinc Co. Ltd, MITSUI MINING and SMELTING CO. LTD., Nexa Resources SA, Nyrstar, Roy Gostar Jam Co, Shijiazhuang Zhongli zinc Co. Ltd., Teck Resources Ltd., and Yunnan Chihong Zinc and Germanium Co. Ltd. Also, the high purity zinc market analysis report includes information on upcoming trends and challenges that will influence market growth. This is to help companies strategize and leverage all forthcoming growth opportunities.
The publisher presents a detailed picture of the market by the way of study, synthesis, and summation of data from multiple sources by an analysis of key parameters such as profit, pricing, competition, and promotions. It presents various market facets by identifying the key industry influencers. The data presented is comprehensive, reliable, and a result of extensive primary and secondary research. The market research reports provide a complete competitive landscape and an in-depth vendor selection methodology and analysis using qualitative and quantitative research to forecast accurate market growth.
Table of Contents
1 Executive Summary
- 1.1 Market overview
- Executive Summary - Chart on Market Overview
- Executive Summary - Data Table on Market Overview
- Executive Summary - Chart on Global Market Characteristics
- Executive Summary - Chart on Market By Geographical Landscape
- Executive Summary - Chart on Market Segmentation by Grade Type
- Executive Summary - Chart on Market Segmentation by Application
- Executive Summary - Chart on Incremental Growth
- Executive Summary - Data Table on Incremental Growth
- Executive Summary - Chart on Company Market Positioning
2 Technavio Analysis
- 2.1 Analysis of price sensitivity, lifecycle, customer purchase basket, adoption rates, and purchase criteria
- Analysis of price sensitivity, lifecycle, customer purchase basket, adoption rates, and purchase criteria
- 2.2 Criticality of inputs and Factors of differentiation
- Overview on criticality of inputs and factors of differentiation
- 2.3 Factors of disruption
- Overview on factors of disruption
- 2.4 Impact of drivers and challenges
- Impact of drivers and challenges in 2024 and 2029
3 Market Landscape
- 3.1 Market ecosystem
- Parent Market
- Data Table on - Parent Market
- 3.2 Market characteristics
- Market characteristics analysis
- 3.3 Value chain analysis
- Value chain analysis
4 Market Sizing
- 4.1 Market definition
- Offerings of companies included in the market definition
- 4.2 Market segment analysis
- Market segments
- 4.3 Market size 2024
- 4.4 Market outlook: Forecast for 2024-2029
- Chart on Global - Market size and forecast 2024-2029 ($ million)
- Data Table on Global - Market size and forecast 2024-2029 ($ million)
- Chart on Global Market: Year-over-year growth 2024-2029 (%)
- Data Table on Global Market: Year-over-year growth 2024-2029 (%)
5 Historic Market Size
- 5.1 Global High Purity Zinc Market 2019 - 2023
- Historic Market Size - Data Table on Global High Purity Zinc Market 2019 - 2023 ($ million)
- 5.2 Grade Type segment analysis 2019 - 2023
- Historic Market Size - Grade Type Segment 2019 - 2023 ($ million)
- 5.3 Application segment analysis 2019 - 2023
- Historic Market Size - Application Segment 2019 - 2023 ($ million)
- 5.4 Geography segment analysis 2019 - 2023
- Historic Market Size - Geography Segment 2019 - 2023 ($ million)
- 5.5 Country segment analysis 2019 - 2023
- Historic Market Size - Country Segment 2019 - 2023 ($ million)
6 Qualitative Analysis
- 6.1 Impact Analysis of U.S. Tariffs on Global High Purity Zinc Market
7 Five Forces Analysis
- 7.1 Five forces summary
- Five forces analysis - Comparison between 2024 and 2029
- 7.2 Bargaining power of buyers
- Bargaining power of buyers - Impact of key factors 2024 and 2029
- 7.3 Bargaining power of suppliers
- Bargaining power of suppliers - Impact of key factors in 2024 and 2029
- 7.4 Threat of new entrants
- Threat of new entrants - Impact of key factors in 2024 and 2029
- 7.5 Threat of substitutes
- Threat of substitutes - Impact of key factors in 2024 and 2029
- 7.6 Threat of rivalry
- Threat of rivalry - Impact of key factors in 2024 and 2029
- 7.7 Market condition
- Chart on Market condition - Five forces 2024 and 2029
8 Market Segmentation by Grade Type
- 8.1 Market segments
- Chart on Grade Type - Market share 2024-2029 (%)
- Data Table on Grade Type - Market share 2024-2029 (%)
- 8.2 Comparison by Grade Type
- Chart on Comparison by Grade Type
- Data Table on Comparison by Grade Type
- 8.3 Special high grade - Market size and forecast 2024-2029
- Chart on Special high grade - Market size and forecast 2024-2029 ($ million)
- Data Table on Special high grade - Market size and forecast 2024-2029 ($ million)
- Chart on Special high grade - Year-over-year growth 2024-2029 (%)
- Data Table on Special high grade - Year-over-year growth 2024-2029 (%)
- 8.4 Super special high grade - Market size and forecast 2024-2029
- Chart on Super special high grade - Market size and forecast 2024-2029 ($ million)
- Data Table on Super special high grade - Market size and forecast 2024-2029 ($ million)
- Chart on Super special high grade - Year-over-year growth 2024-2029 (%)
- Data Table on Super special high grade - Year-over-year growth 2024-2029 (%)
- 8.5 Market opportunity by Grade Type
- Market opportunity by Grade Type ($ million)
- Data Table on Market opportunity by Grade Type ($ million)
9 Market Segmentation by Application
- 9.1 Market segments
- Chart on Application - Market share 2024-2029 (%)
- Data Table on Application - Market share 2024-2029 (%)
- 9.2 Comparison by Application
- Chart on Comparison by Application
- Data Table on Comparison by Application
- 9.3 Electronics and semiconductors - Market size and forecast 2024-2029
- Chart on Electronics and semiconductors - Market size and forecast 2024-2029 ($ million)
- Data Table on Electronics and semiconductors - Market size and forecast 2024-2029 ($ million)
- Chart on Electronics and semiconductors - Year-over-year growth 2024-2029 (%)
- Data Table on Electronics and semiconductors - Year-over-year growth 2024-2029 (%)
- 9.4 Alloys and specialty materials - Market size and forecast 2024-2029
- Chart on Alloys and specialty materials - Market size and forecast 2024-2029 ($ million)
- Data Table on Alloys and specialty materials - Market size and forecast 2024-2029 ($ million)
- Chart on Alloys and specialty materials - Year-over-year growth 2024-2029 (%)
- Data Table on Alloys and specialty materials - Year-over-year growth 2024-2029 (%)
- 9.5 Batteries - Market size and forecast 2024-2029
- Chart on Batteries - Market size and forecast 2024-2029 ($ million)
- Data Table on Batteries - Market size and forecast 2024-2029 ($ million)
- Chart on Batteries - Year-over-year growth 2024-2029 (%)
- Data Table on Batteries - Year-over-year growth 2024-2029 (%)
- 9.6 Pharmaceuticals and cosmetics - Market size and forecast 2024-2029
- Chart on Pharmaceuticals and cosmetics - Market size and forecast 2024-2029 ($ million)
- Data Table on Pharmaceuticals and cosmetics - Market size and forecast 2024-2029 ($ million)
- Chart on Pharmaceuticals and cosmetics - Year-over-year growth 2024-2029 (%)
- Data Table on Pharmaceuticals and cosmetics - Year-over-year growth 2024-2029 (%)
- 9.7 Laboratory - Market size and forecast 2024-2029
- Chart on Laboratory - Market size and forecast 2024-2029 ($ million)
- Data Table on Laboratory - Market size and forecast 2024-2029 ($ million)
- Chart on Laboratory - Year-over-year growth 2024-2029 (%)
- Data Table on Laboratory - Year-over-year growth 2024-2029 (%)
- 9.8 Market opportunity by Application
- Market opportunity by Application ($ million)
- Data Table on Market opportunity by Application ($ million)
10 Customer Landscape
- 10.1 Customer landscape overview
- Analysis of price sensitivity, lifecycle, customer purchase basket, adoption rates, and purchase criteria
11 Geographic Landscape
- 11.1 Geographic segmentation
- Chart on Market share By Geographical Landscape 2024-2029 (%)
- Data Table on Market share By Geographical Landscape 2024-2029 (%)
- 11.2 Geographic comparison
- Chart on Geographic comparison
- Data Table on Geographic comparison
- 11.3 APAC - Market size and forecast 2024-2029
- Chart on APAC - Market size and forecast 2024-2029 ($ million)
- Data Table on APAC - Market size and forecast 2024-2029 ($ million)
- Chart on APAC - Year-over-year growth 2024-2029 (%)
- Data Table on APAC - Year-over-year growth 2024-2029 (%)
- 11.4 North America - Market size and forecast 2024-2029
- Chart on North America - Market size and forecast 2024-2029 ($ million)
- Data Table on North America - Market size and forecast 2024-2029 ($ million)
- Chart on North America - Year-over-year growth 2024-2029 (%)
- Data Table on North America - Year-over-year growth 2024-2029 (%)
- 11.5 Europe - Market size and forecast 2024-2029
- Chart on Europe - Market size and forecast 2024-2029 ($ million)
- Data Table on Europe - Market size and forecast 2024-2029 ($ million)
- Chart on Europe - Year-over-year growth 2024-2029 (%)
- Data Table on Europe - Year-over-year growth 2024-2029 (%)
- 11.6 South America - Market size and forecast 2024-2029
- Chart on South America - Market size and forecast 2024-2029 ($ million)
- Data Table on South America - Market size and forecast 2024-2029 ($ million)
- Chart on South America - Year-over-year growth 2024-2029 (%)
- Data Table on South America - Year-over-year growth 2024-2029 (%)
- 11.7 Middle East and Africa - Market size and forecast 2024-2029
- Chart on Middle East and Africa - Market size and forecast 2024-2029 ($ million)
- Data Table on Middle East and Africa - Market size and forecast 2024-2029 ($ million)
- Chart on Middle East and Africa - Year-over-year growth 2024-2029 (%)
- Data Table on Middle East and Africa - Year-over-year growth 2024-2029 (%)
- 11.8 US - Market size and forecast 2024-2029
- Chart on US - Market size and forecast 2024-2029 ($ million)
- Data Table on US - Market size and forecast 2024-2029 ($ million)
- Chart on US - Year-over-year growth 2024-2029 (%)
- Data Table on US - Year-over-year growth 2024-2029 (%)
- 11.9 China - Market size and forecast 2024-2029
- Chart on China - Market size and forecast 2024-2029 ($ million)
- Data Table on China - Market size and forecast 2024-2029 ($ million)
- Chart on China - Year-over-year growth 2024-2029 (%)
- Data Table on China - Year-over-year growth 2024-2029 (%)
- 11.10 Japan - Market size and forecast 2024-2029
- Chart on Japan - Market size and forecast 2024-2029 ($ million)
- Data Table on Japan - Market size and forecast 2024-2029 ($ million)
- Chart on Japan - Year-over-year growth 2024-2029 (%)
- Data Table on Japan - Year-over-year growth 2024-2029 (%)
- 11.11 India - Market size and forecast 2024-2029
- Chart on India - Market size and forecast 2024-2029 ($ million)
- Data Table on India - Market size and forecast 2024-2029 ($ million)
- Chart on India - Year-over-year growth 2024-2029 (%)
- Data Table on India - Year-over-year growth 2024-2029 (%)
- 11.12 Germany - Market size and forecast 2024-2029
- Chart on Germany - Market size and forecast 2024-2029 ($ million)
- Data Table on Germany - Market size and forecast 2024-2029 ($ million)
- Chart on Germany - Year-over-year growth 2024-2029 (%)
- Data Table on Germany - Year-over-year growth 2024-2029 (%)
- 11.13 UK - Market size and forecast 2024-2029
- Chart on UK - Market size and forecast 2024-2029 ($ million)
- Data Table on UK - Market size and forecast 2024-2029 ($ million)
- Chart on UK - Year-over-year growth 2024-2029 (%)
- Data Table on UK - Year-over-year growth 2024-2029 (%)
- 11.14 South Korea - Market size and forecast 2024-2029
- Chart on South Korea - Market size and forecast 2024-2029 ($ million)
- Data Table on South Korea - Market size and forecast 2024-2029 ($ million)
- Chart on South Korea - Year-over-year growth 2024-2029 (%)
- Data Table on South Korea - Year-over-year growth 2024-2029 (%)
- 11.15 Canada - Market size and forecast 2024-2029
- Chart on Canada - Market size and forecast 2024-2029 ($ million)
- Data Table on Canada - Market size and forecast 2024-2029 ($ million)
- Chart on Canada - Year-over-year growth 2024-2029 (%)
- Data Table on Canada - Year-over-year growth 2024-2029 (%)
- 11.16 France - Market size and forecast 2024-2029
- Chart on France - Market size and forecast 2024-2029 ($ million)
- Data Table on France - Market size and forecast 2024-2029 ($ million)
- Chart on France - Year-over-year growth 2024-2029 (%)
- Data Table on France - Year-over-year growth 2024-2029 (%)
- 11.17 Spain - Market size and forecast 2024-2029
- Chart on Spain - Market size and forecast 2024-2029 ($ million)
- Data Table on Spain - Market size and forecast 2024-2029 ($ million)
- Chart on Spain - Year-over-year growth 2024-2029 (%)
- Data Table on Spain - Year-over-year growth 2024-2029 (%)
- 11.18 Market opportunity By Geographical Landscape
- Market opportunity By Geographical Landscape ($ million)
- Data Tables on Market opportunity By Geographical Landscape ($ million)
12 Drivers, Challenges, and Opportunity/Restraints
- 12.1 Market drivers
- 12.2 Market challenges
- 12.3 Impact of drivers and challenges
- Impact of drivers and challenges in 2024 and 2029
- 12.4 Market opportunities/restraints
13 Competitive Landscape
- 13.1 Overview
- 13.2 Competitive Landscape
- Overview on criticality of inputs and factors of differentiation
- 13.3 Landscape disruption
- Overview on factors of disruption
- 13.4 Industry risks
- Impact of key risks on business
14 Competitive Analysis
- 14.1 Companies profiled
- Companies covered
- 14.2 Company ranking index
- Company ranking index
- 14.3 Market positioning of companies
- Matrix on companies position and classification
- 14.4 Boliden Group
- Boliden Group - Overview
- Boliden Group - Product / Service
- Boliden Group - Key offerings
- SWOT
- 14.5 China Minmetals Corp.
- China Minmetals Corp. - Overview
- China Minmetals Corp. - Product / Service
- China Minmetals Corp. - Key offerings
- SWOT
- 14.6 Dowa Holdings Co. Ltd.
- Dowa Holdings Co. Ltd. - Overview
- Dowa Holdings Co. Ltd. - Product / Service
- Dowa Holdings Co. Ltd. - Key offerings
- SWOT
- 14.7 Glencore Plc
- Glencore Plc - Overview
- Glencore Plc - Business segments
- Glencore Plc - Key news
- Glencore Plc - Key offerings
- Glencore Plc - Segment focus
- SWOT
- 14.8 Henan Yuguang Zinc Industry Co. Ltd
- Henan Yuguang Zinc Industry Co. Ltd - Overview
- Henan Yuguang Zinc Industry Co. Ltd - Product / Service
- Henan Yuguang Zinc Industry Co. Ltd - Key offerings
- SWOT
- 14.9 Hindustan Zinc Ltd.
- Hindustan Zinc Ltd. - Overview
- Hindustan Zinc Ltd. - Business segments
- Hindustan Zinc Ltd. - Key offerings
- Hindustan Zinc Ltd. - Segment focus
- SWOT
- 14.10 Jiangxi Copper Corp
- Jiangxi Copper Corp - Overview
- Jiangxi Copper Corp - Business segments
- Jiangxi Copper Corp - Key offerings
- Jiangxi Copper Corp - Segment focus
- SWOT
- 14.11 Korea Zinc Co. Ltd
- Korea Zinc Co. Ltd - Overview
- Korea Zinc Co. Ltd - Product / Service
- Korea Zinc Co. Ltd - Key offerings
- SWOT
- 14.12 MITSUI MINING and SMELTING CO. LTD.
- MITSUI MINING and SMELTING CO. LTD. - Overview
- MITSUI MINING and SMELTING CO. LTD. - Product / Service
- MITSUI MINING and SMELTING CO. LTD. - Key offerings
- SWOT
- 14.13 Nexa Resources SA
- Nexa Resources SA - Overview
- Nexa Resources SA - Product / Service
- Nexa Resources SA - Key offerings
- SWOT
- 14.14 Nyrstar
- Nyrstar - Overview
- Nyrstar - Product / Service
- Nyrstar - Key offerings
- SWOT
- 14.15 Roy Gostar Jam Co
- Roy Gostar Jam Co - Overview
- Roy Gostar Jam Co - Product / Service
- Roy Gostar Jam Co - Key offerings
- SWOT
- 14.16 Shijiazhuang Zhongli zinc Co. Ltd.
- Shijiazhuang Zhongli zinc Co. Ltd. - Overview
- Shijiazhuang Zhongli zinc Co. Ltd. - Product / Service
- Shijiazhuang Zhongli zinc Co. Ltd. - Key offerings
- SWOT
- 14.17 Teck Resources Ltd.
- Teck Resources Ltd. - Overview
- Teck Resources Ltd. - Business segments
- Teck Resources Ltd. - Key offerings
- Teck Resources Ltd. - Segment focus
- SWOT
- 14.18 Yunnan Chihong Zinc and Germanium Co. Ltd
- Yunnan Chihong Zinc and Germanium Co. Ltd - Overview
- Yunnan Chihong Zinc and Germanium Co. Ltd - Product / Service
- Yunnan Chihong Zinc and Germanium Co. Ltd - Key offerings
- SWOT
15 Appendix
- 15.1 Scope of the report
- 15.2 Inclusions and exclusions checklist
- Inclusions checklist
- Exclusions checklist
- 15.3 Currency conversion rates for US$
- Currency conversion rates for US$
- 15.4 Research methodology
- Research methodology
- 15.5 Data procurement
- Information sources
- 15.6 Data validation
- Data validation
- 15.7 Validation techniques employed for market sizing
- Validation techniques employed for market sizing
- 15.8 Data synthesis
- Data synthesis
- 15.9 360 degree market analysis
- 360 degree market analysis
- 15.10 List of abbreviations
- List of abbreviations
- o Strong focus on sustainability and environmental responsibility
- o Expansion into renewable energy sectors

