|
|
市場調査レポート
商品コード
1705215
麻薬探知機の世界市場 2025~2029年Global Narcotics Detectors Market 2025-2029 |
||||||

|
|||||||
カスタマイズ可能
|
|||||||

| 麻薬探知機の世界市場 2025~2029年 |
|
出版日: 2025年04月05日
発行: TechNavio
ページ情報: 英文 218 Pages
納期: 即納可能
|

全表示
- 概要
- 図表
- 目次
麻薬探知機市場は2024-2029年に14億3,370万米ドル、予測期間中のCAGRは5.9%で成長すると予測されます。
当レポートでは、麻薬探知機市場の全体的な分析、市場規模・予測、動向、成長促進要因、課題、約25のベンダーを網羅したベンダー分析などを掲載しています。
現在の市場シナリオ、最新動向と促進要因、市場環境全体に関する最新分析を提供しています。市場は、薬物密売・密輸活動の増加、政府の厳しい規制と薬物対策政策、意識の高まりと国際的な協力関係によって牽引されています。
| 市場範囲 | |
|---|---|
| 基準年 | 2025 |
| 終了年 | 2029 |
| 予測期間 | 2025-2029 |
| 成長モメンタム | 加速 |
| 前年比2025年 | 5.8% |
| CAGR | 5.9% |
| 増分額 | 14億3,370万米ドル |
本調査は、業界の主要参加者からのインプットを含め、一次情報と二次情報を客観的に組み合わせて実施しました。レポートには、主要企業の分析に加え、包括的な市場規模データ、地域分析によるセグメント、ベンダー情勢が含まれています。レポートにはヒストリカルデータと予測データがあります。
本調査では、今後数年間の麻薬探知機市場の成長を促進する主な要因の1つとして、検知システムにおけるAIとMLの採用を挙げています。また、ハンドヘルドやポータブル検出器の成長、非侵襲的・非接触的検出方法の使用増加が市場の大きな需要につながります。
目次
第1章 エグゼクティブサマリー
- 市場概要
第2章 Technavio分析
- 価格・ライフサイクル・顧客購入バスケット・採用率・購入基準の分析
- インプットの重要性と差別化の要因
- 混乱の要因
- 促進要因と課題の影響
第3章 市場情勢
- 市場エコシステム
- 市場の特徴
- バリューチェーン分析
第4章 市場規模
- 市場の定義
- 市場セグメント分析
- 市場規模 2024
- 市場の見通し 2024-2029
第5章 市場規模実績
- 麻薬探知機の世界市場 2019-2023
- 技術別セグメント分析 2019-2023
- エンドユーザー別セグメント分析 2019-2023
- 地域別セグメント分析 2019-2023
- 国別セグメント分析 2019-2023
第6章 定性分析
- AIの影響:麻薬探知機の世界市場
第7章 ファイブフォース分析
- ファイブフォースの要約
- 買い手の交渉力
- 供給企業の交渉力
- 新規参入業者の脅威
- 代替品の脅威
- 競争の脅威
- 市況
第8章 市場セグメンテーション:技術別
- 市場セグメント
- 比較:技術別
- イオン移動度分光法:市場規模と予測 2024-2029
- ラマン分光法:市場規模と予測 2024-2029
- 赤外分光法:市場規模と予測 2024-2029
- その他:市場規模と予測 2024-2029
- 市場機会:技術別
第9章 市場セグメンテーション:エンドユーザー別
- 市場セグメント
- 比較:エンドユーザー別
- 空港セキュリティと航空業界:市場規模と予測 2024-2029
- 法執行機関:市場規模と予測 2024-2029
- 税関と国境警備:市場規模と予測 2024-2029
- 軍事と防衛:市場規模と予測 2024-2029
- その他:市場規模と予測 2024-2029
- 市場機会:エンドユーザー別
第10章 顧客情勢
- 顧客情勢の概要
第11章 地域別情勢
- 地域別セグメンテーション
- 地域別比較
- 北米:市場規模と予測 2024-2029
- 欧州:市場規模と予測 2024-2029
- アジア太平洋:市場規模と予測 2024-2029
- 中東・アフリカ:市場規模と予測 2024-2029
- 南米:市場規模と予測 2024-2029
- 米国:市場規模と予測 2024-2029
- 中国:市場規模と予測 2024-2029
- ドイツ:市場規模と予測 2024-2029
- カナダ:市場規模と予測 2024-2029
- 英国:市場規模と予測 2024-2029
- インド:市場規模と予測 2024-2029
- 日本:市場規模と予測 2024-2029
- フランス:市場規模と予測 2024-2029
- ブラジル:市場規模と予測 2024-2029
- イタリア:市場規模と予測 2024-2029
- 市場機会:地域情勢別
第12章 促進要因・課題・機会・抑制要因
- 市場促進要因
- 市場の課題
- 促進要因と課題の影響
- 市場の機会・抑制要因
第13章 競合情勢
- 概要
- 競合情勢
- 混乱の状況
- 業界のリスク
第14章 競合分析
- 企業プロファイル
- 企業ランキング指数
- 企業の市場ポジショニング
- Agilent Technologies Inc.
- Bruker Corp.
- Chemring Group Plc
- DetectaChem Inc.
- Hitachi Ltd.
- Leidos Holdings Inc.
- Nuctech Co. Ltd.
- Rapiscan Systems Inc.
- Safran SA
- Scanna MSC Inc.
- Smiths Detection Group Ltd.
- Teledyne FLIR LLC
- Thermo Fisher Scientific Inc.
- Viken Detection Corp.
第15章 付録
Exhibits:
- Exhibits1: Executive Summary - Chart on Market Overview
- Exhibits2: Executive Summary - Data Table on Market Overview
- Exhibits3: Executive Summary - Chart on Global Market Characteristics
- Exhibits4: Executive Summary - Chart on Market By Geographical Landscape
- Exhibits5: Executive Summary - Chart on Market Segmentation by Technology
- Exhibits6: Executive Summary - Chart on Market Segmentation by End-user
- Exhibits7: Executive Summary - Chart on Incremental Growth
- Exhibits8: Executive Summary - Data Table on Incremental Growth
- Exhibits9: Executive Summary - Chart on Company Market Positioning
- Exhibits10: Analysis of price sensitivity, lifecycle, customer purchase basket, adoption rates, and purchase criteria
- Exhibits11: Overview on criticality of inputs and factors of differentiation
- Exhibits12: Overview on factors of disruption
- Exhibits13: Impact of drivers and challenges in 2024 and 2029
- Exhibits14: Parent Market
- Exhibits15: Data Table on - Parent Market
- Exhibits16: Market characteristics analysis
- Exhibits17: Value chain analysis
- Exhibits18: Offerings of companies included in the market definition
- Exhibits19: Market segments
- Exhibits20: Chart on Global - Market size and forecast 2024-2029 ($ million)
- Exhibits21: Data Table on Global - Market size and forecast 2024-2029 ($ million)
- Exhibits22: Chart on Global Market: Year-over-year growth 2024-2029 (%)
- Exhibits23: Data Table on Global Market: Year-over-year growth 2024-2029 (%)
- Exhibits24: Historic Market Size - Data Table on Global Narcotics Detectors Market 2019 - 2023 ($ million)
- Exhibits25: Historic Market Size - Technology Segment 2019 - 2023 ($ million)
- Exhibits26: Historic Market Size - End-user Segment 2019 - 2023 ($ million)
- Exhibits27: Historic Market Size - Geography Segment 2019 - 2023 ($ million)
- Exhibits28: Historic Market Size - Country Segment 2019 - 2023 ($ million)
- Exhibits29: Five forces analysis - Comparison between 2024 and 2029
- Exhibits30: Bargaining power of buyers - Impact of key factors 2024 and 2029
- Exhibits31: Bargaining power of suppliers - Impact of key factors in 2024 and 2029
- Exhibits32: Threat of new entrants - Impact of key factors in 2024 and 2029
- Exhibits33: Threat of substitutes - Impact of key factors in 2024 and 2029
- Exhibits34: Threat of rivalry - Impact of key factors in 2024 and 2029
- Exhibits35: Chart on Market condition - Five forces 2024 and 2029
- Exhibits36: Chart on Technology - Market share 2024-2029 (%)
- Exhibits37: Data Table on Technology - Market share 2024-2029 (%)
- Exhibits38: Chart on Comparison by Technology
- Exhibits39: Data Table on Comparison by Technology
- Exhibits40: Chart on Ion mobility spectrometry - Market size and forecast 2024-2029 ($ million)
- Exhibits41: Data Table on Ion mobility spectrometry - Market size and forecast 2024-2029 ($ million)
- Exhibits42: Chart on Ion mobility spectrometry - Year-over-year growth 2024-2029 (%)
- Exhibits43: Data Table on Ion mobility spectrometry - Year-over-year growth 2024-2029 (%)
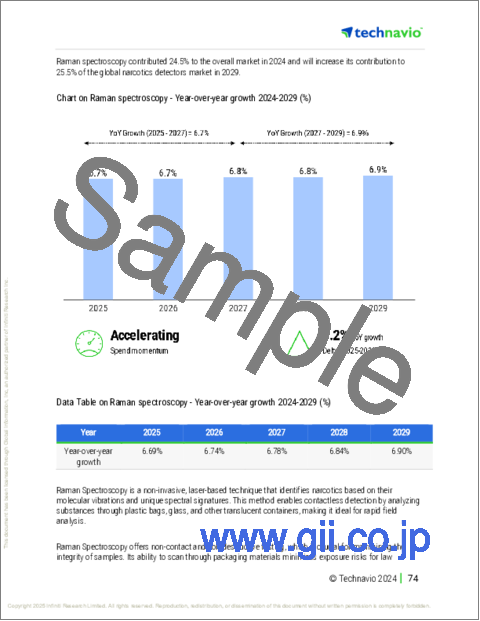
- Exhibits44: Chart on Raman spectroscopy - Market size and forecast 2024-2029 ($ million)
- Exhibits45: Data Table on Raman spectroscopy - Market size and forecast 2024-2029 ($ million)
- Exhibits46: Chart on Raman spectroscopy - Year-over-year growth 2024-2029 (%)
- Exhibits47: Data Table on Raman spectroscopy - Year-over-year growth 2024-2029 (%)
- Exhibits48: Chart on Infrared spectroscopy - Market size and forecast 2024-2029 ($ million)
- Exhibits49: Data Table on Infrared spectroscopy - Market size and forecast 2024-2029 ($ million)
- Exhibits50: Chart on Infrared spectroscopy - Year-over-year growth 2024-2029 (%)
- Exhibits51: Data Table on Infrared spectroscopy - Year-over-year growth 2024-2029 (%)
- Exhibits52: Chart on Others - Market size and forecast 2024-2029 ($ million)
- Exhibits53: Data Table on Others - Market size and forecast 2024-2029 ($ million)
- Exhibits54: Chart on Others - Year-over-year growth 2024-2029 (%)
- Exhibits55: Data Table on Others - Year-over-year growth 2024-2029 (%)
- Exhibits56: Market opportunity by Technology ($ million)
- Exhibits57: Data Table on Market opportunity by Technology ($ million)
- Exhibits58: Chart on End-user - Market share 2024-2029 (%)
- Exhibits59: Data Table on End-user - Market share 2024-2029 (%)
- Exhibits60: Chart on Comparison by End-user
- Exhibits61: Data Table on Comparison by End-user
- Exhibits62: Chart on Airport security and aviation industry - Market size and forecast 2024-2029 ($ million)
- Exhibits63: Data Table on Airport security and aviation industry - Market size and forecast 2024-2029 ($ million)
- Exhibits64: Chart on Airport security and aviation industry - Year-over-year growth 2024-2029 (%)
- Exhibits65: Data Table on Airport security and aviation industry - Year-over-year growth 2024-2029 (%)
- Exhibits66: Chart on Law enforcement agencies - Market size and forecast 2024-2029 ($ million)
- Exhibits67: Data Table on Law enforcement agencies - Market size and forecast 2024-2029 ($ million)
- Exhibits68: Chart on Law enforcement agencies - Year-over-year growth 2024-2029 (%)
- Exhibits69: Data Table on Law enforcement agencies - Year-over-year growth 2024-2029 (%)
- Exhibits70: Chart on Customs and border protection - Market size and forecast 2024-2029 ($ million)
- Exhibits71: Data Table on Customs and border protection - Market size and forecast 2024-2029 ($ million)
- Exhibits72: Chart on Customs and border protection - Year-over-year growth 2024-2029 (%)
- Exhibits73: Data Table on Customs and border protection - Year-over-year growth 2024-2029 (%)
- Exhibits74: Chart on Military and defense - Market size and forecast 2024-2029 ($ million)
- Exhibits75: Data Table on Military and defense - Market size and forecast 2024-2029 ($ million)
- Exhibits76: Chart on Military and defense - Year-over-year growth 2024-2029 (%)
- Exhibits77: Data Table on Military and defense - Year-over-year growth 2024-2029 (%)
- Exhibits78: Chart on Others - Market size and forecast 2024-2029 ($ million)
- Exhibits79: Data Table on Others - Market size and forecast 2024-2029 ($ million)
- Exhibits80: Chart on Others - Year-over-year growth 2024-2029 (%)
- Exhibits81: Data Table on Others - Year-over-year growth 2024-2029 (%)
- Exhibits82: Market opportunity by End-user ($ million)
- Exhibits83: Data Table on Market opportunity by End-user ($ million)
- Exhibits84: Analysis of price sensitivity, lifecycle, customer purchase basket, adoption rates, and purchase criteria
- Exhibits85: Chart on Market share By Geographical Landscape 2024-2029 (%)
- Exhibits86: Data Table on Market share By Geographical Landscape 2024-2029 (%)
- Exhibits87: Chart on Geographic comparison
- Exhibits88: Data Table on Geographic comparison
- Exhibits89: Chart on North America - Market size and forecast 2024-2029 ($ million)
- Exhibits90: Data Table on North America - Market size and forecast 2024-2029 ($ million)
- Exhibits91: Chart on North America - Year-over-year growth 2024-2029 (%)
- Exhibits92: Data Table on North America - Year-over-year growth 2024-2029 (%)
- Exhibits93: Chart on Europe - Market size and forecast 2024-2029 ($ million)
- Exhibits94: Data Table on Europe - Market size and forecast 2024-2029 ($ million)
- Exhibits95: Chart on Europe - Year-over-year growth 2024-2029 (%)
- Exhibits96: Data Table on Europe - Year-over-year growth 2024-2029 (%)
- Exhibits97: Chart on APAC - Market size and forecast 2024-2029 ($ million)
- Exhibits98: Data Table on APAC - Market size and forecast 2024-2029 ($ million)
- Exhibits99: Chart on APAC - Year-over-year growth 2024-2029 (%)
- Exhibits100: Data Table on APAC - Year-over-year growth 2024-2029 (%)
- Exhibits101: Chart on Middle East and Africa - Market size and forecast 2024-2029 ($ million)
- Exhibits102: Data Table on Middle East and Africa - Market size and forecast 2024-2029 ($ million)
- Exhibits103: Chart on Middle East and Africa - Year-over-year growth 2024-2029 (%)
- Exhibits104: Data Table on Middle East and Africa - Year-over-year growth 2024-2029 (%)
- Exhibits105: Chart on South America - Market size and forecast 2024-2029 ($ million)
- Exhibits106: Data Table on South America - Market size and forecast 2024-2029 ($ million)
- Exhibits107: Chart on South America - Year-over-year growth 2024-2029 (%)
- Exhibits108: Data Table on South America - Year-over-year growth 2024-2029 (%)
- Exhibits109: Chart on US - Market size and forecast 2024-2029 ($ million)
- Exhibits110: Data Table on US - Market size and forecast 2024-2029 ($ million)
- Exhibits111: Chart on US - Year-over-year growth 2024-2029 (%)
- Exhibits112: Data Table on US - Year-over-year growth 2024-2029 (%)
- Exhibits113: Chart on China - Market size and forecast 2024-2029 ($ million)
- Exhibits114: Data Table on China - Market size and forecast 2024-2029 ($ million)
- Exhibits115: Chart on China - Year-over-year growth 2024-2029 (%)
- Exhibits116: Data Table on China - Year-over-year growth 2024-2029 (%)
- Exhibits117: Chart on Germany - Market size and forecast 2024-2029 ($ million)
- Exhibits118: Data Table on Germany - Market size and forecast 2024-2029 ($ million)
- Exhibits119: Chart on Germany - Year-over-year growth 2024-2029 (%)
- Exhibits120: Data Table on Germany - Year-over-year growth 2024-2029 (%)
- Exhibits121: Chart on Canada - Market size and forecast 2024-2029 ($ million)
- Exhibits122: Data Table on Canada - Market size and forecast 2024-2029 ($ million)
- Exhibits123: Chart on Canada - Year-over-year growth 2024-2029 (%)
- Exhibits124: Data Table on Canada - Year-over-year growth 2024-2029 (%)
- Exhibits125: Chart on UK - Market size and forecast 2024-2029 ($ million)
- Exhibits126: Data Table on UK - Market size and forecast 2024-2029 ($ million)
- Exhibits127: Chart on UK - Year-over-year growth 2024-2029 (%)
- Exhibits128: Data Table on UK - Year-over-year growth 2024-2029 (%)
- Exhibits129: Chart on India - Market size and forecast 2024-2029 ($ million)
- Exhibits130: Data Table on India - Market size and forecast 2024-2029 ($ million)
- Exhibits131: Chart on India - Year-over-year growth 2024-2029 (%)
- Exhibits132: Data Table on India - Year-over-year growth 2024-2029 (%)
- Exhibits133: Chart on Japan - Market size and forecast 2024-2029 ($ million)
- Exhibits134: Data Table on Japan - Market size and forecast 2024-2029 ($ million)
- Exhibits135: Chart on Japan - Year-over-year growth 2024-2029 (%)
- Exhibits136: Data Table on Japan - Year-over-year growth 2024-2029 (%)
- Exhibits137: Chart on France - Market size and forecast 2024-2029 ($ million)
- Exhibits138: Data Table on France - Market size and forecast 2024-2029 ($ million)
- Exhibits139: Chart on France - Year-over-year growth 2024-2029 (%)
- Exhibits140: Data Table on France - Year-over-year growth 2024-2029 (%)
- Exhibits141: Chart on Brazil - Market size and forecast 2024-2029 ($ million)
- Exhibits142: Data Table on Brazil - Market size and forecast 2024-2029 ($ million)
- Exhibits143: Chart on Brazil - Year-over-year growth 2024-2029 (%)
- Exhibits144: Data Table on Brazil - Year-over-year growth 2024-2029 (%)
- Exhibits145: Chart on Italy - Market size and forecast 2024-2029 ($ million)
- Exhibits146: Data Table on Italy - Market size and forecast 2024-2029 ($ million)
- Exhibits147: Chart on Italy - Year-over-year growth 2024-2029 (%)
- Exhibits148: Data Table on Italy - Year-over-year growth 2024-2029 (%)
- Exhibits149: Market opportunity By Geographical Landscape ($ million)
- Exhibits150: Data Tables on Market opportunity By Geographical Landscape ($ million)
- Exhibits151: Impact of drivers and challenges in 2024 and 2029
- Exhibits152: Overview on criticality of inputs and factors of differentiation
- Exhibits153: Overview on factors of disruption
- Exhibits154: Impact of key risks on business
- Exhibits155: Companies covered
- Exhibits156: Company ranking index
- Exhibits157: Matrix on companies position and classification
- Exhibits158: 908 Devices Inc. - Overview
- Exhibits159: 908 Devices Inc. - Product / Service
- Exhibits160: 908 Devices Inc. - Key offerings
- Exhibits161: SWOT
- Exhibits162: Agilent Technologies Inc. - Overview
- Exhibits163: Agilent Technologies Inc. - Business segments
- Exhibits164: Agilent Technologies Inc. - Key news
- Exhibits165: Agilent Technologies Inc. - Key offerings
- Exhibits166: Agilent Technologies Inc. - Segment focus
- Exhibits167: SWOT
- Exhibits168: Bruker Corp. - Overview
- Exhibits169: Bruker Corp. - Business segments
- Exhibits170: Bruker Corp. - Key news
- Exhibits171: Bruker Corp. - Key offerings
- Exhibits172: Bruker Corp. - Segment focus
- Exhibits173: SWOT
- Exhibits174: Chemring Group Plc - Overview
- Exhibits175: Chemring Group Plc - Business segments
- Exhibits176: Chemring Group Plc - Key offerings
- Exhibits177: Chemring Group Plc - Segment focus
- Exhibits178: SWOT
- Exhibits179: DetectaChem Inc. - Overview
- Exhibits180: DetectaChem Inc. - Product / Service
- Exhibits181: DetectaChem Inc. - Key offerings
- Exhibits182: SWOT
- Exhibits183: Hitachi Ltd. - Overview
- Exhibits184: Hitachi Ltd. - Business segments
- Exhibits185: Hitachi Ltd. - Key news
- Exhibits186: Hitachi Ltd. - Key offerings
- Exhibits187: Hitachi Ltd. - Segment focus
- Exhibits188: SWOT
- Exhibits189: Leidos Holdings Inc. - Overview
- Exhibits190: Leidos Holdings Inc. - Business segments
- Exhibits191: Leidos Holdings Inc. - Key offerings
- Exhibits192: Leidos Holdings Inc. - Segment focus
- Exhibits193: SWOT
- Exhibits194: Nuctech Co. Ltd. - Overview
- Exhibits195: Nuctech Co. Ltd. - Product / Service
- Exhibits196: Nuctech Co. Ltd. - Key offerings
- Exhibits197: SWOT
- Exhibits198: Rapiscan Systems Inc. - Overview
- Exhibits199: Rapiscan Systems Inc. - Product / Service
- Exhibits200: Rapiscan Systems Inc. - Key offerings
- Exhibits201: SWOT
- Exhibits202: Safran SA - Overview
- Exhibits203: Safran SA - Business segments
- Exhibits204: Safran SA - Key news
- Exhibits205: Safran SA - Key offerings
- Exhibits206: Safran SA - Segment focus
- Exhibits207: SWOT
- Exhibits208: Scanna MSC Inc. - Overview
- Exhibits209: Scanna MSC Inc. - Product / Service
- Exhibits210: Scanna MSC Inc. - Key offerings
- Exhibits211: SWOT
- Exhibits212: Smiths Detection Group Ltd. - Overview
- Exhibits213: Smiths Detection Group Ltd. - Product / Service
- Exhibits214: Smiths Detection Group Ltd. - Key offerings
- Exhibits215: SWOT
- Exhibits216: Teledyne FLIR LLC - Overview
- Exhibits217: Teledyne FLIR LLC - Product / Service
- Exhibits218: Teledyne FLIR LLC - Key offerings
- Exhibits219: SWOT
- Exhibits220: Thermo Fisher Scientific Inc. - Overview
- Exhibits221: Thermo Fisher Scientific Inc. - Business segments
- Exhibits222: Thermo Fisher Scientific Inc. - Key news
- Exhibits223: Thermo Fisher Scientific Inc. - Key offerings
- Exhibits224: Thermo Fisher Scientific Inc. - Segment focus
- Exhibits225: SWOT
- Exhibits226: Viken Detection Corp. - Overview
- Exhibits227: Viken Detection Corp. - Product / Service
- Exhibits228: Viken Detection Corp. - Key offerings
- Exhibits229: SWOT
- Exhibits230: Inclusions checklist
- Exhibits231: Exclusions checklist
- Exhibits232: Currency conversion rates for US$
- Exhibits233: Research methodology
- Exhibits234: Information sources
- Exhibits235: Data validation
- Exhibits236: Validation techniques employed for market sizing
- Exhibits237: Data synthesis
- Exhibits238: 360 degree market analysis
- Exhibits239: List of abbreviations
The narcotics detectors market is forecasted to grow by USD 1433.7 mn during 2024-2029, accelerating at a CAGR of 5.9% during the forecast period. The report on the narcotics detectors market provides a holistic analysis, market size and forecast, trends, growth drivers, and challenges, as well as vendor analysis covering around 25 vendors.
The report offers an up-to-date analysis regarding the current market scenario, the latest trends and drivers, and the overall market environment. The market is driven by rising drug trafficking and smuggling activities, stringent government regulations and anti-drug policies, and growing awareness and international collaboration.
| Market Scope | |
|---|---|
| Base Year | 2025 |
| End Year | 2029 |
| Series Year | 2025-2029 |
| Growth Momentum | Accelerate |
| YOY 2025 | 5.8% |
| CAGR | 5.9% |
| Incremental Value | $1433.7 mn |
The study was conducted using an objective combination of primary and secondary information including inputs from key participants in the industry. The report contains a comprehensive market size data, segment with regional analysis and vendor landscape in addition to an analysis of the key companies. Reports have historic and forecast data.
Technavio's narcotics detectors market is segmented as below:
By Technology
- Ion mobility spectrometry
- Raman spectroscopy
- Infrared spectroscopy
- Others
By End-user
- Airport security and aviation industry
- Law enforcement agencies
- Customs and border protection
- Military and defense
- Others
By Geographical Landscape
- North America
- Europe
- APAC
- Middle East and Africa
- South America
This study identifies the adoption of ai and ml in detection systems as one of the prime reasons driving the narcotics detectors market growth during the next few years. Also, growth in handheld and portable detectors and increasing use of non-invasive and contactless detection methods will lead to sizable demand in the market.
The report on the narcotics detectors market covers the following areas:
- Narcotics Detectors Market sizing
- Narcotics Detectors Market forecast
- Narcotics Detectors Market industry analysis
The robust vendor analysis is designed to help clients improve their market position, and in line with this, this report provides a detailed analysis of several leading narcotics detectors market vendors that include 908 Devices Inc., Agilent Technologies Inc., Bruker Corp., Chemring Group Plc, DetectaChem Inc., Hitachi Ltd., Leidos Holdings Inc., Nuctech Co. Ltd., Rapiscan Systems Inc., Safran SA, Scanna MSC Inc., Smiths Detection Group Ltd., Teledyne FLIR LLC, Thermo Fisher Scientific Inc., and Viken Detection Corp.. Also, the narcotics detectors market analysis report includes information on upcoming trends and challenges that will influence market growth. This is to help companies strategize and leverage all forthcoming growth opportunities.
The publisher presents a detailed picture of the market by the way of study, synthesis, and summation of data from multiple sources by an analysis of key parameters such as profit, pricing, competition, and promotions. It presents various market facets by identifying the key industry influencers. The data presented is comprehensive, reliable, and a result of extensive primary and secondary research. The market research reports provide a complete competitive landscape and an in-depth vendor selection methodology and analysis using qualitative and quantitative research to forecast accurate market growth.
Table of Contents
1 Executive Summary
- 1.1 Market overview
- Executive Summary - Chart on Market Overview
- Executive Summary - Data Table on Market Overview
- Executive Summary - Chart on Global Market Characteristics
- Executive Summary - Chart on Market By Geographical Landscape
- Executive Summary - Chart on Market Segmentation by Technology
- Executive Summary - Chart on Market Segmentation by End-user
- Executive Summary - Chart on Incremental Growth
- Executive Summary - Data Table on Incremental Growth
- Executive Summary - Chart on Company Market Positioning
2 Technavio Analysis
- 2.1 Analysis of price sensitivity, lifecycle, customer purchase basket, adoption rates, and purchase criteria
- Analysis of price sensitivity, lifecycle, customer purchase basket, adoption rates, and purchase criteria
- 2.2 Criticality of inputs and Factors of differentiation
- Overview on criticality of inputs and factors of differentiation
- 2.3 Factors of disruption
- Overview on factors of disruption
- 2.4 Impact of drivers and challenges
- Impact of drivers and challenges in 2024 and 2029
3 Market Landscape
- 3.1 Market ecosystem
- Parent Market
- Data Table on - Parent Market
- 3.2 Market characteristics
- Market characteristics analysis
- 3.3 Value chain analysis
- Value chain analysis
4 Market Sizing
- 4.1 Market definition
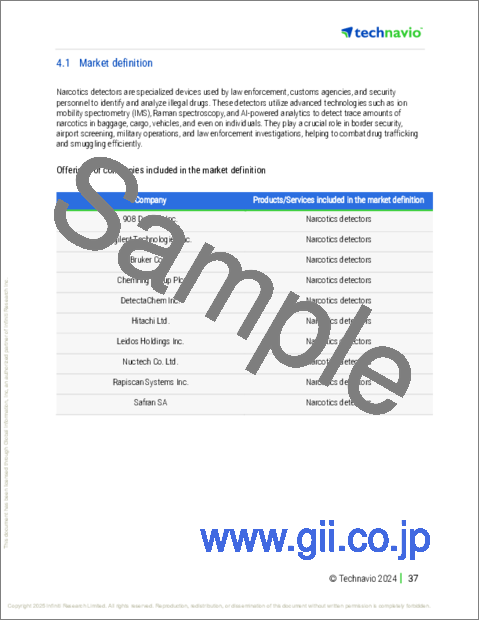
- Offerings of companies included in the market definition
- 4.2 Market segment analysis
- Market segments
- 4.3 Market size 2024
- 4.4 Market outlook: Forecast for 2024-2029
- Chart on Global - Market size and forecast 2024-2029 ($ million)
- Data Table on Global - Market size and forecast 2024-2029 ($ million)
- Chart on Global Market: Year-over-year growth 2024-2029 (%)
- Data Table on Global Market: Year-over-year growth 2024-2029 (%)
5 Historic Market Size
- 5.1 Global Narcotics Detectors Market 2019 - 2023
- Historic Market Size - Data Table on Global Narcotics Detectors Market 2019 - 2023 ($ million)
- 5.2 Technology segment analysis 2019 - 2023
- Historic Market Size - Technology Segment 2019 - 2023 ($ million)
- 5.3 End-user segment analysis 2019 - 2023
- Historic Market Size - End-user Segment 2019 - 2023 ($ million)
- 5.4 Geography segment analysis 2019 - 2023
- Historic Market Size - Geography Segment 2019 - 2023 ($ million)
- 5.5 Country segment analysis 2019 - 2023
- Historic Market Size - Country Segment 2019 - 2023 ($ million)
6 Qualitative Analysis
- 6.1 Ai Impact on Global Narcotics Detectors Market
7 Five Forces Analysis
- 7.1 Five forces summary
- Five forces analysis - Comparison between 2024 and 2029
- 7.2 Bargaining power of buyers
- Bargaining power of buyers - Impact of key factors 2024 and 2029
- 7.3 Bargaining power of suppliers
- Bargaining power of suppliers - Impact of key factors in 2024 and 2029
- 7.4 Threat of new entrants
- Threat of new entrants - Impact of key factors in 2024 and 2029
- 7.5 Threat of substitutes
- Threat of substitutes - Impact of key factors in 2024 and 2029
- 7.6 Threat of rivalry
- Threat of rivalry - Impact of key factors in 2024 and 2029
- 7.7 Market condition
- Chart on Market condition - Five forces 2024 and 2029
8 Market Segmentation by Technology
- 8.1 Market segments
- Chart on Technology - Market share 2024-2029 (%)
- Data Table on Technology - Market share 2024-2029 (%)
- 8.2 Comparison by Technology
- Chart on Comparison by Technology
- Data Table on Comparison by Technology
- 8.3 Ion mobility spectrometry - Market size and forecast 2024-2029
- Chart on Ion mobility spectrometry - Market size and forecast 2024-2029 ($ million)
- Data Table on Ion mobility spectrometry - Market size and forecast 2024-2029 ($ million)
- Chart on Ion mobility spectrometry - Year-over-year growth 2024-2029 (%)
- Data Table on Ion mobility spectrometry - Year-over-year growth 2024-2029 (%)
- 8.4 Raman spectroscopy - Market size and forecast 2024-2029
- Chart on Raman spectroscopy - Market size and forecast 2024-2029 ($ million)
- Data Table on Raman spectroscopy - Market size and forecast 2024-2029 ($ million)
- Chart on Raman spectroscopy - Year-over-year growth 2024-2029 (%)
- Data Table on Raman spectroscopy - Year-over-year growth 2024-2029 (%)
- 8.5 Infrared spectroscopy - Market size and forecast 2024-2029
- Chart on Infrared spectroscopy - Market size and forecast 2024-2029 ($ million)
- Data Table on Infrared spectroscopy - Market size and forecast 2024-2029 ($ million)
- Chart on Infrared spectroscopy - Year-over-year growth 2024-2029 (%)
- Data Table on Infrared spectroscopy - Year-over-year growth 2024-2029 (%)
- 8.6 Others - Market size and forecast 2024-2029
- Chart on Others - Market size and forecast 2024-2029 ($ million)
- Data Table on Others - Market size and forecast 2024-2029 ($ million)
- Chart on Others - Year-over-year growth 2024-2029 (%)
- Data Table on Others - Year-over-year growth 2024-2029 (%)
- 8.7 Market opportunity by Technology
- Market opportunity by Technology ($ million)
- Data Table on Market opportunity by Technology ($ million)
9 Market Segmentation by End-user
- 9.1 Market segments
- Chart on End-user - Market share 2024-2029 (%)
- Data Table on End-user - Market share 2024-2029 (%)
- 9.2 Comparison by End-user
- Chart on Comparison by End-user
- Data Table on Comparison by End-user
- 9.3 Airport security and aviation industry - Market size and forecast 2024-2029
- Chart on Airport security and aviation industry - Market size and forecast 2024-2029 ($ million)
- Data Table on Airport security and aviation industry - Market size and forecast 2024-2029 ($ million)
- Chart on Airport security and aviation industry - Year-over-year growth 2024-2029 (%)
- Data Table on Airport security and aviation industry - Year-over-year growth 2024-2029 (%)
- 9.4 Law enforcement agencies - Market size and forecast 2024-2029
- Chart on Law enforcement agencies - Market size and forecast 2024-2029 ($ million)
- Data Table on Law enforcement agencies - Market size and forecast 2024-2029 ($ million)
- Chart on Law enforcement agencies - Year-over-year growth 2024-2029 (%)
- Data Table on Law enforcement agencies - Year-over-year growth 2024-2029 (%)
- 9.5 Customs and border protection - Market size and forecast 2024-2029
- Chart on Customs and border protection - Market size and forecast 2024-2029 ($ million)
- Data Table on Customs and border protection - Market size and forecast 2024-2029 ($ million)
- Chart on Customs and border protection - Year-over-year growth 2024-2029 (%)
- Data Table on Customs and border protection - Year-over-year growth 2024-2029 (%)
- 9.6 Military and defense - Market size and forecast 2024-2029
- Chart on Military and defense - Market size and forecast 2024-2029 ($ million)
- Data Table on Military and defense - Market size and forecast 2024-2029 ($ million)
- Chart on Military and defense - Year-over-year growth 2024-2029 (%)
- Data Table on Military and defense - Year-over-year growth 2024-2029 (%)
- 9.7 Others - Market size and forecast 2024-2029
- Chart on Others - Market size and forecast 2024-2029 ($ million)
- Data Table on Others - Market size and forecast 2024-2029 ($ million)
- Chart on Others - Year-over-year growth 2024-2029 (%)
- Data Table on Others - Year-over-year growth 2024-2029 (%)
- 9.8 Market opportunity by End-user
- Market opportunity by End-user ($ million)
- Data Table on Market opportunity by End-user ($ million)
10 Customer Landscape
- 10.1 Customer landscape overview
- Analysis of price sensitivity, lifecycle, customer purchase basket, adoption rates, and purchase criteria
11 Geographic Landscape
- 11.1 Geographic segmentation
- Chart on Market share By Geographical Landscape 2024-2029 (%)
- Data Table on Market share By Geographical Landscape 2024-2029 (%)
- 11.2 Geographic comparison
- Chart on Geographic comparison
- Data Table on Geographic comparison
- 11.3 North America - Market size and forecast 2024-2029
- Chart on North America - Market size and forecast 2024-2029 ($ million)
- Data Table on North America - Market size and forecast 2024-2029 ($ million)
- Chart on North America - Year-over-year growth 2024-2029 (%)
- Data Table on North America - Year-over-year growth 2024-2029 (%)
- 11.4 Europe - Market size and forecast 2024-2029
- Chart on Europe - Market size and forecast 2024-2029 ($ million)
- Data Table on Europe - Market size and forecast 2024-2029 ($ million)
- Chart on Europe - Year-over-year growth 2024-2029 (%)
- Data Table on Europe - Year-over-year growth 2024-2029 (%)
- 11.5 APAC - Market size and forecast 2024-2029
- Chart on APAC - Market size and forecast 2024-2029 ($ million)
- Data Table on APAC - Market size and forecast 2024-2029 ($ million)
- Chart on APAC - Year-over-year growth 2024-2029 (%)
- Data Table on APAC - Year-over-year growth 2024-2029 (%)
- 11.6 Middle East and Africa - Market size and forecast 2024-2029
- Chart on Middle East and Africa - Market size and forecast 2024-2029 ($ million)
- Data Table on Middle East and Africa - Market size and forecast 2024-2029 ($ million)
- Chart on Middle East and Africa - Year-over-year growth 2024-2029 (%)
- Data Table on Middle East and Africa - Year-over-year growth 2024-2029 (%)
- 11.7 South America - Market size and forecast 2024-2029
- Chart on South America - Market size and forecast 2024-2029 ($ million)
- Data Table on South America - Market size and forecast 2024-2029 ($ million)
- Chart on South America - Year-over-year growth 2024-2029 (%)
- Data Table on South America - Year-over-year growth 2024-2029 (%)
- 11.8 US - Market size and forecast 2024-2029
- Chart on US - Market size and forecast 2024-2029 ($ million)
- Data Table on US - Market size and forecast 2024-2029 ($ million)
- Chart on US - Year-over-year growth 2024-2029 (%)
- Data Table on US - Year-over-year growth 2024-2029 (%)
- 11.9 China - Market size and forecast 2024-2029
- Chart on China - Market size and forecast 2024-2029 ($ million)
- Data Table on China - Market size and forecast 2024-2029 ($ million)
- Chart on China - Year-over-year growth 2024-2029 (%)
- Data Table on China - Year-over-year growth 2024-2029 (%)
- 11.10 Germany - Market size and forecast 2024-2029
- Chart on Germany - Market size and forecast 2024-2029 ($ million)
- Data Table on Germany - Market size and forecast 2024-2029 ($ million)
- Chart on Germany - Year-over-year growth 2024-2029 (%)
- Data Table on Germany - Year-over-year growth 2024-2029 (%)
- 11.11 Canada - Market size and forecast 2024-2029
- Chart on Canada - Market size and forecast 2024-2029 ($ million)
- Data Table on Canada - Market size and forecast 2024-2029 ($ million)
- Chart on Canada - Year-over-year growth 2024-2029 (%)
- Data Table on Canada - Year-over-year growth 2024-2029 (%)
- 11.12 UK - Market size and forecast 2024-2029
- Chart on UK - Market size and forecast 2024-2029 ($ million)
- Data Table on UK - Market size and forecast 2024-2029 ($ million)
- Chart on UK - Year-over-year growth 2024-2029 (%)
- Data Table on UK - Year-over-year growth 2024-2029 (%)
- 11.13 India - Market size and forecast 2024-2029
- Chart on India - Market size and forecast 2024-2029 ($ million)
- Data Table on India - Market size and forecast 2024-2029 ($ million)
- Chart on India - Year-over-year growth 2024-2029 (%)
- Data Table on India - Year-over-year growth 2024-2029 (%)
- 11.14 Japan - Market size and forecast 2024-2029
- Chart on Japan - Market size and forecast 2024-2029 ($ million)
- Data Table on Japan - Market size and forecast 2024-2029 ($ million)
- Chart on Japan - Year-over-year growth 2024-2029 (%)
- Data Table on Japan - Year-over-year growth 2024-2029 (%)
- 11.15 France - Market size and forecast 2024-2029
- Chart on France - Market size and forecast 2024-2029 ($ million)
- Data Table on France - Market size and forecast 2024-2029 ($ million)
- Chart on France - Year-over-year growth 2024-2029 (%)
- Data Table on France - Year-over-year growth 2024-2029 (%)
- 11.16 Brazil - Market size and forecast 2024-2029
- Chart on Brazil - Market size and forecast 2024-2029 ($ million)
- Data Table on Brazil - Market size and forecast 2024-2029 ($ million)
- Chart on Brazil - Year-over-year growth 2024-2029 (%)
- Data Table on Brazil - Year-over-year growth 2024-2029 (%)
- 11.17 Italy - Market size and forecast 2024-2029
- Chart on Italy - Market size and forecast 2024-2029 ($ million)
- Data Table on Italy - Market size and forecast 2024-2029 ($ million)
- Chart on Italy - Year-over-year growth 2024-2029 (%)
- Data Table on Italy - Year-over-year growth 2024-2029 (%)
- 11.18 Market opportunity By Geographical Landscape
- Market opportunity By Geographical Landscape ($ million)
- Data Tables on Market opportunity By Geographical Landscape ($ million)
12 Drivers, Challenges, and Opportunity/Restraints
- 12.1 Market drivers
- 12.2 Market challenges
- 12.3 Impact of drivers and challenges
- Impact of drivers and challenges in 2024 and 2029
- 12.4 Market opportunities/restraints
13 Competitive Landscape
- 13.1 Overview
- 13.2 Competitive Landscape
- Overview on criticality of inputs and factors of differentiation
- 13.3 Landscape disruption
- Overview on factors of disruption
- 13.4 Industry risks
- Impact of key risks on business
14 Competitive Analysis
- 14.1 Companies profiled
- Companies covered
- 14.2 Company ranking index
- Company ranking index
- 14.3 Market positioning of companies
- Matrix on companies position and classification
- 908 Devices Inc.
- 908 Devices Inc. - Overview
- 908 Devices Inc. - Product / Service
- 908 Devices Inc. - Key offerings
- SWOT
- 14.5 Agilent Technologies Inc.
- Agilent Technologies Inc. - Overview
- Agilent Technologies Inc. - Business segments
- Agilent Technologies Inc. - Key news
- Agilent Technologies Inc. - Key offerings
- Agilent Technologies Inc. - Segment focus
- SWOT
- 14.6 Bruker Corp.
- Bruker Corp. - Overview
- Bruker Corp. - Business segments
- Bruker Corp. - Key news
- Bruker Corp. - Key offerings
- Bruker Corp. - Segment focus
- SWOT
- 14.7 Chemring Group Plc
- Chemring Group Plc - Overview
- Chemring Group Plc - Business segments
- Chemring Group Plc - Key offerings
- Chemring Group Plc - Segment focus
- SWOT
- 14.8 DetectaChem Inc.
- DetectaChem Inc. - Overview
- DetectaChem Inc. - Product / Service
- DetectaChem Inc. - Key offerings
- SWOT
- 14.9 Hitachi Ltd.
- Hitachi Ltd. - Overview
- Hitachi Ltd. - Business segments
- Hitachi Ltd. - Key news
- Hitachi Ltd. - Key offerings
- Hitachi Ltd. - Segment focus
- SWOT
- 14.10 Leidos Holdings Inc.
- Leidos Holdings Inc. - Overview
- Leidos Holdings Inc. - Business segments
- Leidos Holdings Inc. - Key offerings
- Leidos Holdings Inc. - Segment focus
- SWOT
- 14.11 Nuctech Co. Ltd.
- Nuctech Co. Ltd. - Overview
- Nuctech Co. Ltd. - Product / Service
- Nuctech Co. Ltd. - Key offerings
- SWOT
- 14.12 Rapiscan Systems Inc.
- Rapiscan Systems Inc. - Overview
- Rapiscan Systems Inc. - Product / Service
- Rapiscan Systems Inc. - Key offerings
- SWOT
- 14.13 Safran SA
- Safran SA - Overview
- Safran SA - Business segments
- Safran SA - Key news
- Safran SA - Key offerings
- Safran SA - Segment focus
- SWOT
- 14.14 Scanna MSC Inc.
- Scanna MSC Inc. - Overview
- Scanna MSC Inc. - Product / Service
- Scanna MSC Inc. - Key offerings
- SWOT
- 14.15 Smiths Detection Group Ltd.
- Smiths Detection Group Ltd. - Overview
- Smiths Detection Group Ltd. - Product / Service
- Smiths Detection Group Ltd. - Key offerings
- SWOT
- 14.16 Teledyne FLIR LLC
- Teledyne FLIR LLC - Overview
- Teledyne FLIR LLC - Product / Service
- Teledyne FLIR LLC - Key offerings
- SWOT
- 14.17 Thermo Fisher Scientific Inc.
- Thermo Fisher Scientific Inc. - Overview
- Thermo Fisher Scientific Inc. - Business segments
- Thermo Fisher Scientific Inc. - Key news
- Thermo Fisher Scientific Inc. - Key offerings
- Thermo Fisher Scientific Inc. - Segment focus
- SWOT
- 14.18 Viken Detection Corp.
- Viken Detection Corp. - Overview
- Viken Detection Corp. - Product / Service
- Viken Detection Corp. - Key offerings
- SWOT
15 Appendix
- 15.1 Scope of the report
- 15.2 Inclusions and exclusions checklist
- Inclusions checklist
- Exclusions checklist
- 15.3 Currency conversion rates for US$
- Currency conversion rates for US$
- 15.4 Research methodology
- Research methodology
- 15.5 Data procurement
- Information sources
- 15.6 Data validation
- Data validation
- 15.7 Validation techniques employed for market sizing
- Validation techniques employed for market sizing
- 15.8 Data synthesis
- Data synthesis
- 15.9 360 degree market analysis
- 360 degree market analysis
- 15.10 List of abbreviations
- List of abbreviations
