|
|
市場調査レポート
商品コード
1697286
バス座席システムの世界市場 2025~2029年Global Bus Seating Systems Market 2025-2029 |
||||||
|
|||||||
カスタマイズ可能
|
|||||||


| バス座席システムの世界市場 2025~2029年 |
|
出版日: 2025年03月28日
発行: TechNavio
ページ情報: 英文 240 Pages
納期: 即納可能
|

全表示
- 概要
- 図表
- 目次
バス座席システム市場は2024-2029年に71億1,730万米ドル、予測期間中のCAGRは29.4%で成長すると予測されます。
当レポートでは、バス座席システム市場の全体的な分析、市場規模・予測、動向、成長促進要因、課題、約25のベンダーを網羅したベンダー分析などを掲載しています。
現在の市場シナリオ、最新動向と促進要因、市場環境全体に関する最新分析を提供しています。市場を牽引しているのは、各国政府によるバス輸送への高額投資、快適で豪華なシートへの需要の高まり、従来型バスに対する連節バスの人気の高まりなどです。
| 市場範囲 | |
|---|---|
| 基準年 | 2025 |
| 終了年 | 2029 |
| 予測期間 | 2025-2029 |
| 成長モメンタム | 加速 |
| 前年比2025年 | 22.8% |
| CAGR | 29.4% |
| 増分額 | 71億1,730万米ドル |
本調査は、業界の主要参加者からのインプットを含め、一次情報と二次情報を客観的に組み合わせて実施しました。レポートには、主要企業の分析に加え、包括的な市場規模データ、地域別分析によるセグメント、ベンダー情勢が含まれています。レポートには過去データと予測データがあります。
本調査では、今後数年間のバス座席システム市場の成長を促進する主な理由の一つとして、スマートシーティングに対する需要の増加を挙げています。また、高齢者の通勤を支援する公共バスの座席革新や、スマートシートベルトを備えたスクールバスの追跡は、市場の大きな需要につながります。
目次
第1章 エグゼクティブサマリー
- 市場概要
第2章 Technavio分析
- 価格・ライフサイクル・顧客購入バスケット・採用率・購入基準の分析
- インプットの重要性と差別化の要因
- 混乱の要因
- 促進要因と課題の影響
第3章 市場情勢
- 市場エコシステム
- 市場の特徴
- バリューチェーン分析
第4章 市場規模
- 市場の定義
- 市場セグメント分析
- 市場規模 2024
- 市場の見通し 2024-2029
第5章 市場規模実績
- バス座席システムの世界市場 2019-2023
- タイプ別セグメント分析 2019-2023
- 車両タイプ別セグメント分析 2019-2023
- 素材別セグメント分析 2019-2023
- エンドユーザー別セグメント分析 2019-2023
- 地域別セグメント分析 2019-2023
- 国別セグメント分析 2019-2023
第6章 定性分析
- AIの影響:バス座席システムの世界市場
第7章 ファイブフォース分析
- ファイブフォースの要約
- 買い手の交渉力
- 供給企業の交渉力
- 新規参入業者の脅威
- 代替品の脅威
- 競争の脅威
- 市況
第8章 市場セグメンテーション:タイプ別
- 市場セグメント
- 比較:タイプ別
- 標準座席:市場規模と予測 2024-2029
- リクライニングシート:市場規模と予測 2024-2029
- 市場機会:タイプ別
第9章 市場セグメンテーション:車両タイプ別
- 市場セグメント
- 比較:車両タイプ別
- 路線バス:市場規模と予測 2024-2029
- コーチバス:市場規模と予測 2024-2029
- スクールバス:市場規模と予測 2024-2029
- 送迎バス:市場規模と予測 2024-2029
- 市場機会:車両タイプ別
第10章 市場セグメンテーション:素材別
- 市場セグメント
- 比較:素材別
- レザー:市場規模と予測 2024-2029
- ファブリック:市場規模と予測 2024-2029
- ビニール:市場規模と予測 2024-2029
- 複合材料:市場規模と予測 2024-2029
- 市場機会:素材別
第11章 市場セグメンテーション:エンドユーザー別
- 市場セグメント
- 比較:エンドユーザー別
- OEM:市場規模と予測 2024-2029
- アフターマーケット:市場規模と予測 2024-2029
- 市場機会:エンドユーザー別
第12章 顧客情勢
- 顧客情勢の概要
第13章 地域別情勢
- 地域別セグメンテーション
- 地域別比較
- アジア太平洋:市場規模と予測 2024-2029
- 欧州:市場規模と予測 2024-2029
- 南米:市場規模と予測 2024-2029
- 北米:市場規模と予測 2024-2029
- 中東・アフリカ:市場規模と予測 2024-2029
- 中国:市場規模と予測 2024-2029
- インド:市場規模と予測 2024-2029
- ロシア:市場規模と予測 2024-2029
- 日本:市場規模と予測 2024-2029
- フランス:市場規模と予測 2024-2029
- 韓国:市場規模と予測 2024-2029
- 英国:市場規模と予測 2024-2029
- ドイツ:市場規模と予測 2024-2029
- オーストラリア:市場規模と予測 2024-2029
- 米国:市場規模と予測 2024-2029
- 市場機会:地域情勢別
第14章 促進要因・課題・機会・抑制要因
- 市場促進要因
- 市場の課題
- 促進要因と課題の影響
- 市場の機会・抑制要因
第15章 競合情勢
- 概要
- 競合情勢
- 混乱の状況
- 業界のリスク
第16章 競合分析
- 企業プロファイル
- 企業ランキング指数
- 企業の市場ポジショニング
- Adient Plc
- AUNDE Group SE
- BASF SE
- Brusa Koltuk
- Commercial Vehicle Group Inc.
- Faurecia SE
- Franz Kiel GmbH
- Freedman Seating Co.
- Lazzerini Srl
- Leadcom Seating Inc.
- Magna International Inc.
- Minda Industries Ltd.
- Ningbo Jifeng Auto Parts Co. Ltd.
- Pinnacle Industries Ltd.
- Tata Motors Ltd.
第17章 付録
Exhibits:
- Exhibits1: Executive Summary - Chart on Market Overview
- Exhibits2: Executive Summary - Data Table on Market Overview
- Exhibits3: Executive Summary - Chart on Global Market Characteristics
- Exhibits4: Executive Summary - Chart on Market By Geographical Landscape
- Exhibits5: Executive Summary - Chart on Market Segmentation by Type
- Exhibits6: Executive Summary - Chart on Market Segmentation by Vehicle Type
- Exhibits7: Executive Summary - Chart on Market Segmentation by Material
- Exhibits8: Executive Summary - Chart on Market Segmentation by End-user
- Exhibits9: Executive Summary - Chart on Incremental Growth
- Exhibits10: Executive Summary - Data Table on Incremental Growth
- Exhibits11: Executive Summary - Chart on Company Market Positioning
- Exhibits12: Analysis of price sensitivity, lifecycle, customer purchase basket, adoption rates, and purchase criteria
- Exhibits13: Overview on criticality of inputs and factors of differentiation
- Exhibits14: Overview on factors of disruption
- Exhibits15: Impact of drivers and challenges in 2024 and 2029
- Exhibits16: Parent Market
- Exhibits17: Data Table on - Parent Market
- Exhibits18: Market characteristics analysis
- Exhibits19: Value chain analysis
- Exhibits20: Offerings of companies included in the market definition
- Exhibits21: Market segments
- Exhibits22: Chart on Global - Market size and forecast 2024-2029 ($ million)
- Exhibits23: Data Table on Global - Market size and forecast 2024-2029 ($ million)
- Exhibits24: Chart on Global Market: Year-over-year growth 2024-2029 (%)
- Exhibits25: Data Table on Global Market: Year-over-year growth 2024-2029 (%)
- Exhibits26: Historic Market Size - Data Table on Global Bus Seating Systems Market 2019 - 2023 ($ million)
- Exhibits27: Historic Market Size - Type Segment 2019 - 2023 ($ million)
- Exhibits28: Historic Market Size - Vehicle Type Segment 2019 - 2023 ($ million)
- Exhibits29: Historic Market Size - Material Segment 2019 - 2023 ($ million)
- Exhibits30: Historic Market Size - End-user Segment 2019 - 2023 ($ million)
- Exhibits31: Historic Market Size - Geography Segment 2019 - 2023 ($ million)
- Exhibits32: Historic Market Size - Country Segment 2019 - 2023 ($ million)
- Exhibits33: Five forces analysis - Comparison between 2024 and 2029
- Exhibits34: Bargaining power of buyers - Impact of key factors 2024 and 2029
- Exhibits35: Bargaining power of suppliers - Impact of key factors in 2024 and 2029
- Exhibits36: Threat of new entrants - Impact of key factors in 2024 and 2029
- Exhibits37: Threat of substitutes - Impact of key factors in 2024 and 2029
- Exhibits38: Threat of rivalry - Impact of key factors in 2024 and 2029
- Exhibits39: Chart on Market condition - Five forces 2024 and 2029
- Exhibits40: Chart on Type - Market share 2024-2029 (%)
- Exhibits41: Data Table on Type - Market share 2024-2029 (%)
- Exhibits42: Chart on Comparison by Type
- Exhibits43: Data Table on Comparison by Type
- Exhibits44: Chart on Standard seats - Market size and forecast 2024-2029 ($ million)
- Exhibits45: Data Table on Standard seats - Market size and forecast 2024-2029 ($ million)
- Exhibits46: Chart on Standard seats - Year-over-year growth 2024-2029 (%)
- Exhibits47: Data Table on Standard seats - Year-over-year growth 2024-2029 (%)
- Exhibits48: Chart on Recliner seats - Market size and forecast 2024-2029 ($ million)
- Exhibits49: Data Table on Recliner seats - Market size and forecast 2024-2029 ($ million)
- Exhibits50: Chart on Recliner seats - Year-over-year growth 2024-2029 (%)
- Exhibits51: Data Table on Recliner seats - Year-over-year growth 2024-2029 (%)
- Exhibits52: Market opportunity by Type ($ million)
- Exhibits53: Data Table on Market opportunity by Type ($ million)
- Exhibits54: Chart on Vehicle Type - Market share 2024-2029 (%)
- Exhibits55: Data Table on Vehicle Type - Market share 2024-2029 (%)
- Exhibits56: Chart on Comparison by Vehicle Type
- Exhibits57: Data Table on Comparison by Vehicle Type
- Exhibits58: Chart on Transit buses - Market size and forecast 2024-2029 ($ million)
- Exhibits59: Data Table on Transit buses - Market size and forecast 2024-2029 ($ million)
- Exhibits60: Chart on Transit buses - Year-over-year growth 2024-2029 (%)
- Exhibits61: Data Table on Transit buses - Year-over-year growth 2024-2029 (%)
- Exhibits62: Chart on Coach buses - Market size and forecast 2024-2029 ($ million)
- Exhibits63: Data Table on Coach buses - Market size and forecast 2024-2029 ($ million)
- Exhibits64: Chart on Coach buses - Year-over-year growth 2024-2029 (%)
- Exhibits65: Data Table on Coach buses - Year-over-year growth 2024-2029 (%)
- Exhibits66: Chart on School buses - Market size and forecast 2024-2029 ($ million)
- Exhibits67: Data Table on School buses - Market size and forecast 2024-2029 ($ million)
- Exhibits68: Chart on School buses - Year-over-year growth 2024-2029 (%)
- Exhibits69: Data Table on School buses - Year-over-year growth 2024-2029 (%)
- Exhibits70: Chart on Transfer buses - Market size and forecast 2024-2029 ($ million)
- Exhibits71: Data Table on Transfer buses - Market size and forecast 2024-2029 ($ million)
- Exhibits72: Chart on Transfer buses - Year-over-year growth 2024-2029 (%)
- Exhibits73: Data Table on Transfer buses - Year-over-year growth 2024-2029 (%)
- Exhibits74: Market opportunity by Vehicle Type ($ million)
- Exhibits75: Data Table on Market opportunity by Vehicle Type ($ million)
- Exhibits76: Chart on Material - Market share 2024-2029 (%)
- Exhibits77: Data Table on Material - Market share 2024-2029 (%)
- Exhibits78: Chart on Comparison by Material
- Exhibits79: Data Table on Comparison by Material
- Exhibits80: Chart on Leather - Market size and forecast 2024-2029 ($ million)
- Exhibits81: Data Table on Leather - Market size and forecast 2024-2029 ($ million)
- Exhibits82: Chart on Leather - Year-over-year growth 2024-2029 (%)
- Exhibits83: Data Table on Leather - Year-over-year growth 2024-2029 (%)
- Exhibits84: Chart on Fabric - Market size and forecast 2024-2029 ($ million)
- Exhibits85: Data Table on Fabric - Market size and forecast 2024-2029 ($ million)
- Exhibits86: Chart on Fabric - Year-over-year growth 2024-2029 (%)
- Exhibits87: Data Table on Fabric - Year-over-year growth 2024-2029 (%)
- Exhibits88: Chart on Vinyl - Market size and forecast 2024-2029 ($ million)
- Exhibits89: Data Table on Vinyl - Market size and forecast 2024-2029 ($ million)
- Exhibits90: Chart on Vinyl - Year-over-year growth 2024-2029 (%)
- Exhibits91: Data Table on Vinyl - Year-over-year growth 2024-2029 (%)
- Exhibits92: Chart on Composite materials - Market size and forecast 2024-2029 ($ million)
- Exhibits93: Data Table on Composite materials - Market size and forecast 2024-2029 ($ million)
- Exhibits94: Chart on Composite materials - Year-over-year growth 2024-2029 (%)
- Exhibits95: Data Table on Composite materials - Year-over-year growth 2024-2029 (%)
- Exhibits96: Market opportunity by Material ($ million)
- Exhibits97: Data Table on Market opportunity by Material ($ million)
- Exhibits98: Chart on End-user - Market share 2024-2029 (%)
- Exhibits99: Data Table on End-user - Market share 2024-2029 (%)
- Exhibits100: Chart on Comparison by End-user
- Exhibits101: Data Table on Comparison by End-user
- Exhibits102: Chart on OEMs - Market size and forecast 2024-2029 ($ million)
- Exhibits103: Data Table on OEMs - Market size and forecast 2024-2029 ($ million)
- Exhibits104: Chart on OEMs - Year-over-year growth 2024-2029 (%)
- Exhibits105: Data Table on OEMs - Year-over-year growth 2024-2029 (%)
- Exhibits106: Chart on Aftermarket - Market size and forecast 2024-2029 ($ million)
- Exhibits107: Data Table on Aftermarket - Market size and forecast 2024-2029 ($ million)
- Exhibits108: Chart on Aftermarket - Year-over-year growth 2024-2029 (%)
- Exhibits109: Data Table on Aftermarket - Year-over-year growth 2024-2029 (%)
- Exhibits110: Market opportunity by End-user ($ million)
- Exhibits111: Data Table on Market opportunity by End-user ($ million)
- Exhibits112: Analysis of price sensitivity, lifecycle, customer purchase basket, adoption rates, and purchase criteria
- Exhibits113: Chart on Market share By Geographical Landscape 2024-2029 (%)
- Exhibits114: Data Table on Market share By Geographical Landscape 2024-2029 (%)
- Exhibits115: Chart on Geographic comparison
- Exhibits116: Data Table on Geographic comparison
- Exhibits117: Chart on APAC - Market size and forecast 2024-2029 ($ million)
- Exhibits118: Data Table on APAC - Market size and forecast 2024-2029 ($ million)
- Exhibits119: Chart on APAC - Year-over-year growth 2024-2029 (%)
- Exhibits120: Data Table on APAC - Year-over-year growth 2024-2029 (%)
- Exhibits121: Chart on Europe - Market size and forecast 2024-2029 ($ million)
- Exhibits122: Data Table on Europe - Market size and forecast 2024-2029 ($ million)
- Exhibits123: Chart on Europe - Year-over-year growth 2024-2029 (%)
- Exhibits124: Data Table on Europe - Year-over-year growth 2024-2029 (%)
- Exhibits125: Chart on South America - Market size and forecast 2024-2029 ($ million)
- Exhibits126: Data Table on South America - Market size and forecast 2024-2029 ($ million)
- Exhibits127: Chart on South America - Year-over-year growth 2024-2029 (%)
- Exhibits128: Data Table on South America - Year-over-year growth 2024-2029 (%)
- Exhibits129: Chart on North America - Market size and forecast 2024-2029 ($ million)
- Exhibits130: Data Table on North America - Market size and forecast 2024-2029 ($ million)
- Exhibits131: Chart on North America - Year-over-year growth 2024-2029 (%)
- Exhibits132: Data Table on North America - Year-over-year growth 2024-2029 (%)
- Exhibits133: Chart on Middle East and Africa - Market size and forecast 2024-2029 ($ million)
- Exhibits134: Data Table on Middle East and Africa - Market size and forecast 2024-2029 ($ million)
- Exhibits135: Chart on Middle East and Africa - Year-over-year growth 2024-2029 (%)
- Exhibits136: Data Table on Middle East and Africa - Year-over-year growth 2024-2029 (%)
- Exhibits137: Chart on China - Market size and forecast 2024-2029 ($ million)
- Exhibits138: Data Table on China - Market size and forecast 2024-2029 ($ million)
- Exhibits139: Chart on China - Year-over-year growth 2024-2029 (%)
- Exhibits140: Data Table on China - Year-over-year growth 2024-2029 (%)
- Exhibits141: Chart on India - Market size and forecast 2024-2029 ($ million)
- Exhibits142: Data Table on India - Market size and forecast 2024-2029 ($ million)
- Exhibits143: Chart on India - Year-over-year growth 2024-2029 (%)
- Exhibits144: Data Table on India - Year-over-year growth 2024-2029 (%)
- Exhibits145: Chart on Russia - Market size and forecast 2024-2029 ($ million)
- Exhibits146: Data Table on Russia - Market size and forecast 2024-2029 ($ million)
- Exhibits147: Chart on Russia - Year-over-year growth 2024-2029 (%)
- Exhibits148: Data Table on Russia - Year-over-year growth 2024-2029 (%)
- Exhibits149: Chart on Japan - Market size and forecast 2024-2029 ($ million)
- Exhibits150: Data Table on Japan - Market size and forecast 2024-2029 ($ million)
- Exhibits151: Chart on Japan - Year-over-year growth 2024-2029 (%)
- Exhibits152: Data Table on Japan - Year-over-year growth 2024-2029 (%)
- Exhibits153: Chart on France - Market size and forecast 2024-2029 ($ million)
- Exhibits154: Data Table on France - Market size and forecast 2024-2029 ($ million)
- Exhibits155: Chart on France - Year-over-year growth 2024-2029 (%)
- Exhibits156: Data Table on France - Year-over-year growth 2024-2029 (%)
- Exhibits157: Chart on South Korea - Market size and forecast 2024-2029 ($ million)
- Exhibits158: Data Table on South Korea - Market size and forecast 2024-2029 ($ million)
- Exhibits159: Chart on South Korea - Year-over-year growth 2024-2029 (%)
- Exhibits160: Data Table on South Korea - Year-over-year growth 2024-2029 (%)
- Exhibits161: Chart on UK - Market size and forecast 2024-2029 ($ million)
- Exhibits162: Data Table on UK - Market size and forecast 2024-2029 ($ million)
- Exhibits163: Chart on UK - Year-over-year growth 2024-2029 (%)
- Exhibits164: Data Table on UK - Year-over-year growth 2024-2029 (%)
- Exhibits165: Chart on Germany - Market size and forecast 2024-2029 ($ million)
- Exhibits166: Data Table on Germany - Market size and forecast 2024-2029 ($ million)
- Exhibits167: Chart on Germany - Year-over-year growth 2024-2029 (%)
- Exhibits168: Data Table on Germany - Year-over-year growth 2024-2029 (%)
- Exhibits169: Chart on Australia - Market size and forecast 2024-2029 ($ million)
- Exhibits170: Data Table on Australia - Market size and forecast 2024-2029 ($ million)
- Exhibits171: Chart on Australia - Year-over-year growth 2024-2029 (%)
- Exhibits172: Data Table on Australia - Year-over-year growth 2024-2029 (%)
- Exhibits173: Chart on US - Market size and forecast 2024-2029 ($ million)
- Exhibits174: Data Table on US - Market size and forecast 2024-2029 ($ million)
- Exhibits175: Chart on US - Year-over-year growth 2024-2029 (%)
- Exhibits176: Data Table on US - Year-over-year growth 2024-2029 (%)
- Exhibits177: Market opportunity By Geographical Landscape ($ million)
- Exhibits178: Data Tables on Market opportunity By Geographical Landscape ($ million)
- Exhibits179: Impact of drivers and challenges in 2024 and 2029
- Exhibits180: Overview on criticality of inputs and factors of differentiation
- Exhibits181: Overview on factors of disruption
- Exhibits182: Impact of key risks on business
- Exhibits183: Companies covered
- Exhibits184: Company ranking index
- Exhibits185: Matrix on companies position and classification
- Exhibits186: Adient Plc - Overview
- Exhibits187: Adient Plc - Business segments
- Exhibits188: Adient Plc - Key offerings
- Exhibits189: Adient Plc - Segment focus
- Exhibits190: SWOT
- Exhibits191: AUNDE Group SE - Overview
- Exhibits192: AUNDE Group SE - Product / Service
- Exhibits193: AUNDE Group SE - Key offerings
- Exhibits194: SWOT
- Exhibits195: BASF SE - Overview
- Exhibits196: BASF SE - Business segments
- Exhibits197: BASF SE - Key news
- Exhibits198: BASF SE - Key offerings
- Exhibits199: BASF SE - Segment focus
- Exhibits200: SWOT
- Exhibits201: Brusa Koltuk - Overview
- Exhibits202: Brusa Koltuk - Product / Service
- Exhibits203: Brusa Koltuk - Key offerings
- Exhibits204: SWOT
- Exhibits205: Commercial Vehicle Group Inc. - Overview
- Exhibits206: Commercial Vehicle Group Inc. - Business segments
- Exhibits207: Commercial Vehicle Group Inc. - Key offerings
- Exhibits208: Commercial Vehicle Group Inc. - Segment focus
- Exhibits209: SWOT
- Exhibits210: Faurecia SE - Overview
- Exhibits211: Faurecia SE - Product / Service
- Exhibits212: Faurecia SE - Key news
- Exhibits213: Faurecia SE - Key offerings
- Exhibits214: SWOT
- Exhibits215: Franz Kiel GmbH - Overview
- Exhibits216: Franz Kiel GmbH - Product / Service
- Exhibits217: Franz Kiel GmbH - Key offerings
- Exhibits218: SWOT
- Exhibits219: Freedman Seating Co. - Overview
- Exhibits220: Freedman Seating Co. - Product / Service
- Exhibits221: Freedman Seating Co. - Key offerings
- Exhibits222: SWOT
- Exhibits223: Lazzerini Srl - Overview
- Exhibits224: Lazzerini Srl - Product / Service
- Exhibits225: Lazzerini Srl - Key offerings
- Exhibits226: SWOT
- Exhibits227: Leadcom Seating Inc. - Overview
- Exhibits228: Leadcom Seating Inc. - Product / Service
- Exhibits229: Leadcom Seating Inc. - Key offerings
- Exhibits230: SWOT
- Exhibits231: Magna International Inc. - Overview
- Exhibits232: Magna International Inc. - Business segments
- Exhibits233: Magna International Inc. - Key news
- Exhibits234: Magna International Inc. - Key offerings
- Exhibits235: Magna International Inc. - Segment focus
- Exhibits236: SWOT
- Exhibits237: Minda Industries Ltd. - Overview
- Exhibits238: Minda Industries Ltd. - Product / Service
- Exhibits239: Minda Industries Ltd. - Key offerings
- Exhibits240: SWOT
- Exhibits241: Ningbo Jifeng Auto Parts Co. Ltd. - Overview
- Exhibits242: Ningbo Jifeng Auto Parts Co. Ltd. - Product / Service
- Exhibits243: Ningbo Jifeng Auto Parts Co. Ltd. - Key offerings
- Exhibits244: SWOT
- Exhibits245: Pinnacle Industries Ltd. - Overview
- Exhibits246: Pinnacle Industries Ltd. - Product / Service
- Exhibits247: Pinnacle Industries Ltd. - Key offerings
- Exhibits248: SWOT
- Exhibits249: Tata Motors Ltd. - Overview
- Exhibits250: Tata Motors Ltd. - Business segments
- Exhibits251: Tata Motors Ltd. - Key news
- Exhibits252: Tata Motors Ltd. - Key offerings
- Exhibits253: Tata Motors Ltd. - Segment focus
- Exhibits254: SWOT
- Exhibits255: Inclusions checklist
- Exhibits256: Exclusions checklist
- Exhibits257: Currency conversion rates for US$
- Exhibits258: Research methodology
- Exhibits259: Information sources
- Exhibits260: Data validation
- Exhibits261: Validation techniques employed for market sizing
- Exhibits262: Data synthesis
- Exhibits263: 360 degree market analysis
- Exhibits264: List of abbreviations
The bus seating systems market is forecasted to grow by USD 7117.3 mn during 2024-2029, accelerating at a CAGR of 29.4% during the forecast period. The report on the bus seating systems market provides a holistic analysis, market size and forecast, trends, growth drivers, and challenges, as well as vendor analysis covering around 25 vendors.
The report offers an up-to-date analysis regarding the current market scenario, the latest trends and drivers, and the overall market environment. The market is driven by high investments in bus transportation by governments, increasing demand for comfort and luxury seats, and growing popularity of articulated buses over conventional bus.
| Market Scope | |
|---|---|
| Base Year | 2025 |
| End Year | 2029 |
| Series Year | 2025-2029 |
| Growth Momentum | Accelerate |
| YOY 2025 | 22.8% |
| CAGR | 29.4% |
| Incremental Value | $7117.3 mn |
The study was conducted using an objective combination of primary and secondary information including inputs from key participants in the industry. The report contains a comprehensive market size data, segment with regional analysis and vendor landscape in addition to an analysis of the key companies. Reports have historic and forecast data.
Technavio's bus seating systems market is segmented as below:
By Type
- Standard seats
- Recliner seats
By Vehicle Type
- Transit buses
- Coach buses
- School buses
- Transfer buses
By Material
- Leather
- Fabric
- Vinyl
- Composite materials
By End-user
- OEMs
- Aftermarket
By Geographical Landscape
- APAC
- Europe
- South America
- North America
- Middle East and Africa
This study identifies the increasing demand for smart seating as one of the prime reasons driving the bus seating systems market growth during the next few years. Also, public bus seating innovation to aid elderly commuters and tracking school buses with smart seat belts will lead to sizable demand in the market.
The report on the bus seating systems market covers the following areas:
- Bus Seating Systems Market sizing
- Bus Seating Systems Market forecast
- Bus Seating Systems Market industry analysis
The robust vendor analysis is designed to help clients improve their market position, and in line with this, this report provides a detailed analysis of several leading bus seating systems market vendors that include Adient Plc, AUNDE Group SE, BASF SE, Brusa Koltuk, Commercial Vehicle Group Inc., Exmark, Faurecia SE, FP Seating Systems Pvt. Ltd., Franz Kiel GmbH, Freedman Seating Co., Lazzerini Srl, Leadcom Seating Inc., Lear Corp., Magna International Inc., MG Seating Systems Pvt. Ltd., Minda Industries Ltd., Ningbo Jifeng Auto Parts Co. Ltd., Pinnacle Industries Ltd., TACHI S Co. Ltd., Tata Motors Ltd., and Toyota Motor Corp.. Also, the bus seating systems market analysis report includes information on upcoming trends and challenges that will influence market growth. This is to help companies strategize and leverage all forthcoming growth opportunities.
The publisher presents a detailed picture of the market by the way of study, synthesis, and summation of data from multiple sources by an analysis of key parameters such as profit, pricing, competition, and promotions. It presents various market facets by identifying the key industry influencers. The data presented is comprehensive, reliable, and a result of extensive primary and secondary research. The market research reports provide a complete competitive landscape and an in-depth vendor selection methodology and analysis using qualitative and quantitative research to forecast accurate market growth.
Table of Contents
1 Executive Summary
- 1.1 Market overview
- Executive Summary - Chart on Market Overview
- Executive Summary - Data Table on Market Overview
- Executive Summary - Chart on Global Market Characteristics
- Executive Summary - Chart on Market By Geographical Landscape
- Executive Summary - Chart on Market Segmentation by Type
- Executive Summary - Chart on Market Segmentation by Vehicle Type
- Executive Summary - Chart on Market Segmentation by Material
- Executive Summary - Chart on Market Segmentation by End-user
- Executive Summary - Chart on Incremental Growth
- Executive Summary - Data Table on Incremental Growth
- Executive Summary - Chart on Company Market Positioning
2 Technavio Analysis
- 2.1 Analysis of price sensitivity, lifecycle, customer purchase basket, adoption rates, and purchase criteria
- Analysis of price sensitivity, lifecycle, customer purchase basket, adoption rates, and purchase criteria
- 2.2 Criticality of inputs and Factors of differentiation
- Overview on criticality of inputs and factors of differentiation
- 2.3 Factors of disruption
- Overview on factors of disruption
- 2.4 Impact of drivers and challenges
- Impact of drivers and challenges in 2024 and 2029
3 Market Landscape
- 3.1 Market ecosystem
- Parent Market
- Data Table on - Parent Market
- 3.2 Market characteristics
- Market characteristics analysis
- 3.3 Value chain analysis
- Value chain analysis
4 Market Sizing
- 4.1 Market definition
- Offerings of companies included in the market definition
- 4.2 Market segment analysis
- Market segments
- 4.3 Market size 2024
- 4.4 Market outlook: Forecast for 2024-2029
- Chart on Global - Market size and forecast 2024-2029 ($ million)
- Data Table on Global - Market size and forecast 2024-2029 ($ million)
- Chart on Global Market: Year-over-year growth 2024-2029 (%)
- Data Table on Global Market: Year-over-year growth 2024-2029 (%)
5 Historic Market Size
- 5.1 Global Bus Seating Systems Market 2019 - 2023
- Historic Market Size - Data Table on Global Bus Seating Systems Market 2019 - 2023 ($ million)
- 5.2 Type segment analysis 2019 - 2023
- Historic Market Size - Type Segment 2019 - 2023 ($ million)
- 5.3 Vehicle Type segment analysis 2019 - 2023
- Historic Market Size - Vehicle Type Segment 2019 - 2023 ($ million)
- 5.4 Material segment analysis 2019 - 2023
- Historic Market Size - Material Segment 2019 - 2023 ($ million)
- 5.5 End-user segment analysis 2019 - 2023
- Historic Market Size - End-user Segment 2019 - 2023 ($ million)
- 5.6 Geography segment analysis 2019 - 2023
- Historic Market Size - Geography Segment 2019 - 2023 ($ million)
- 5.7 Country segment analysis 2019 - 2023
- Historic Market Size - Country Segment 2019 - 2023 ($ million)
6 Qualitative Analysis
- 6.1 Impact of AI on Global Bus Seating Systems market
7 Five Forces Analysis
- 7.1 Five forces summary
- Five forces analysis - Comparison between 2024 and 2029
- 7.2 Bargaining power of buyers
- Bargaining power of buyers - Impact of key factors 2024 and 2029
- 7.3 Bargaining power of suppliers
- Bargaining power of suppliers - Impact of key factors in 2024 and 2029
- 7.4 Threat of new entrants
- Threat of new entrants - Impact of key factors in 2024 and 2029
- 7.5 Threat of substitutes
- Threat of substitutes - Impact of key factors in 2024 and 2029
- 7.6 Threat of rivalry
- Threat of rivalry - Impact of key factors in 2024 and 2029
- 7.7 Market condition
- Chart on Market condition - Five forces 2024 and 2029
8 Market Segmentation by Type
- 8.1 Market segments
- Chart on Type - Market share 2024-2029 (%)
- Data Table on Type - Market share 2024-2029 (%)
- 8.2 Comparison by Type
- Chart on Comparison by Type
- Data Table on Comparison by Type
- 8.3 Standard seats - Market size and forecast 2024-2029
- Chart on Standard seats - Market size and forecast 2024-2029 ($ million)
- Data Table on Standard seats - Market size and forecast 2024-2029 ($ million)
- Chart on Standard seats - Year-over-year growth 2024-2029 (%)
- Data Table on Standard seats - Year-over-year growth 2024-2029 (%)
- 8.4 Recliner seats - Market size and forecast 2024-2029
- Chart on Recliner seats - Market size and forecast 2024-2029 ($ million)
- Data Table on Recliner seats - Market size and forecast 2024-2029 ($ million)
- Chart on Recliner seats - Year-over-year growth 2024-2029 (%)
- Data Table on Recliner seats - Year-over-year growth 2024-2029 (%)
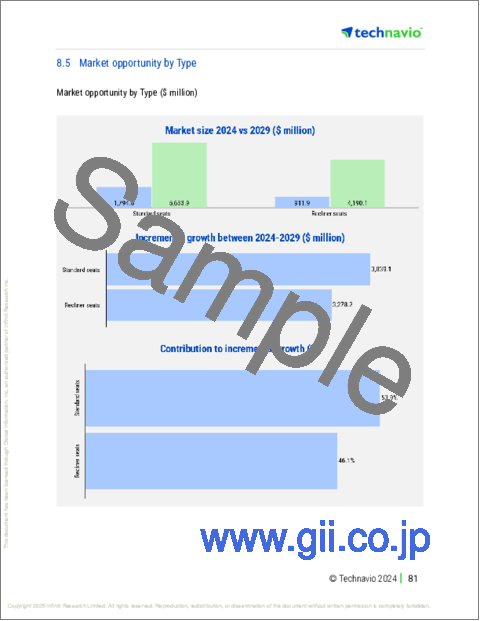
- 8.5 Market opportunity by Type
- Market opportunity by Type ($ million)
- Data Table on Market opportunity by Type ($ million)
9 Market Segmentation by Vehicle Type
- 9.1 Market segments
- Chart on Vehicle Type - Market share 2024-2029 (%)
- Data Table on Vehicle Type - Market share 2024-2029 (%)
- 9.2 Comparison by Vehicle Type
- Chart on Comparison by Vehicle Type
- Data Table on Comparison by Vehicle Type
- 9.3 Transit buses - Market size and forecast 2024-2029
- Chart on Transit buses - Market size and forecast 2024-2029 ($ million)
- Data Table on Transit buses - Market size and forecast 2024-2029 ($ million)
- Chart on Transit buses - Year-over-year growth 2024-2029 (%)
- Data Table on Transit buses - Year-over-year growth 2024-2029 (%)
- 9.4 Coach buses - Market size and forecast 2024-2029
- Chart on Coach buses - Market size and forecast 2024-2029 ($ million)
- Data Table on Coach buses - Market size and forecast 2024-2029 ($ million)
- Chart on Coach buses - Year-over-year growth 2024-2029 (%)
- Data Table on Coach buses - Year-over-year growth 2024-2029 (%)
- 9.5 School buses - Market size and forecast 2024-2029
- Chart on School buses - Market size and forecast 2024-2029 ($ million)
- Data Table on School buses - Market size and forecast 2024-2029 ($ million)
- Chart on School buses - Year-over-year growth 2024-2029 (%)
- Data Table on School buses - Year-over-year growth 2024-2029 (%)
- 9.6 Transfer buses - Market size and forecast 2024-2029
- Chart on Transfer buses - Market size and forecast 2024-2029 ($ million)
- Data Table on Transfer buses - Market size and forecast 2024-2029 ($ million)
- Chart on Transfer buses - Year-over-year growth 2024-2029 (%)
- Data Table on Transfer buses - Year-over-year growth 2024-2029 (%)
- 9.7 Market opportunity by Vehicle Type
- Market opportunity by Vehicle Type ($ million)
- Data Table on Market opportunity by Vehicle Type ($ million)
10 Market Segmentation by Material
- 10.1 Market segments
- Chart on Material - Market share 2024-2029 (%)
- Data Table on Material - Market share 2024-2029 (%)
- 10.2 Comparison by Material
- Chart on Comparison by Material
- Data Table on Comparison by Material
- 10.3 Leather - Market size and forecast 2024-2029
- Chart on Leather - Market size and forecast 2024-2029 ($ million)
- Data Table on Leather - Market size and forecast 2024-2029 ($ million)
- Chart on Leather - Year-over-year growth 2024-2029 (%)
- Data Table on Leather - Year-over-year growth 2024-2029 (%)
- 10.4 Fabric - Market size and forecast 2024-2029
- Chart on Fabric - Market size and forecast 2024-2029 ($ million)
- Data Table on Fabric - Market size and forecast 2024-2029 ($ million)
- Chart on Fabric - Year-over-year growth 2024-2029 (%)
- Data Table on Fabric - Year-over-year growth 2024-2029 (%)
- 10.5 Vinyl - Market size and forecast 2024-2029
- Chart on Vinyl - Market size and forecast 2024-2029 ($ million)
- Data Table on Vinyl - Market size and forecast 2024-2029 ($ million)
- Chart on Vinyl - Year-over-year growth 2024-2029 (%)
- Data Table on Vinyl - Year-over-year growth 2024-2029 (%)
- 10.6 Composite materials - Market size and forecast 2024-2029
- Chart on Composite materials - Market size and forecast 2024-2029 ($ million)
- Data Table on Composite materials - Market size and forecast 2024-2029 ($ million)
- Chart on Composite materials - Year-over-year growth 2024-2029 (%)
- Data Table on Composite materials - Year-over-year growth 2024-2029 (%)
- 10.7 Market opportunity by Material
- Market opportunity by Material ($ million)
- Data Table on Market opportunity by Material ($ million)
11 Market Segmentation by End-user
- 11.1 Market segments
- Chart on End-user - Market share 2024-2029 (%)
- Data Table on End-user - Market share 2024-2029 (%)
- 11.2 Comparison by End-user
- Chart on Comparison by End-user
- Data Table on Comparison by End-user
- 11.3 OEMs - Market size and forecast 2024-2029
- Chart on OEMs - Market size and forecast 2024-2029 ($ million)
- Data Table on OEMs - Market size and forecast 2024-2029 ($ million)
- Chart on OEMs - Year-over-year growth 2024-2029 (%)
- Data Table on OEMs - Year-over-year growth 2024-2029 (%)
- 11.4 Aftermarket - Market size and forecast 2024-2029
- Chart on Aftermarket - Market size and forecast 2024-2029 ($ million)
- Data Table on Aftermarket - Market size and forecast 2024-2029 ($ million)
- Chart on Aftermarket - Year-over-year growth 2024-2029 (%)
- Data Table on Aftermarket - Year-over-year growth 2024-2029 (%)
- 11.5 Market opportunity by End-user
- Market opportunity by End-user ($ million)
- Data Table on Market opportunity by End-user ($ million)
12 Customer Landscape
- 12.1 Customer landscape overview
- Analysis of price sensitivity, lifecycle, customer purchase basket, adoption rates, and purchase criteria
13 Geographic Landscape
- 13.1 Geographic segmentation
- Chart on Market share By Geographical Landscape 2024-2029 (%)
- Data Table on Market share By Geographical Landscape 2024-2029 (%)
- 13.2 Geographic comparison
- Chart on Geographic comparison
- Data Table on Geographic comparison
- 13.3 APAC - Market size and forecast 2024-2029
- Chart on APAC - Market size and forecast 2024-2029 ($ million)
- Data Table on APAC - Market size and forecast 2024-2029 ($ million)
- Chart on APAC - Year-over-year growth 2024-2029 (%)
- Data Table on APAC - Year-over-year growth 2024-2029 (%)
- 13.4 Europe - Market size and forecast 2024-2029
- Chart on Europe - Market size and forecast 2024-2029 ($ million)
- Data Table on Europe - Market size and forecast 2024-2029 ($ million)
- Chart on Europe - Year-over-year growth 2024-2029 (%)
- Data Table on Europe - Year-over-year growth 2024-2029 (%)
- 13.5 South America - Market size and forecast 2024-2029
- Chart on South America - Market size and forecast 2024-2029 ($ million)
- Data Table on South America - Market size and forecast 2024-2029 ($ million)
- Chart on South America - Year-over-year growth 2024-2029 (%)
- Data Table on South America - Year-over-year growth 2024-2029 (%)
- 13.6 North America - Market size and forecast 2024-2029
- Chart on North America - Market size and forecast 2024-2029 ($ million)
- Data Table on North America - Market size and forecast 2024-2029 ($ million)
- Chart on North America - Year-over-year growth 2024-2029 (%)
- Data Table on North America - Year-over-year growth 2024-2029 (%)
- 13.7 Middle East and Africa - Market size and forecast 2024-2029
- Chart on Middle East and Africa - Market size and forecast 2024-2029 ($ million)
- Data Table on Middle East and Africa - Market size and forecast 2024-2029 ($ million)
- Chart on Middle East and Africa - Year-over-year growth 2024-2029 (%)
- Data Table on Middle East and Africa - Year-over-year growth 2024-2029 (%)
- 13.8 China - Market size and forecast 2024-2029
- Chart on China - Market size and forecast 2024-2029 ($ million)
- Data Table on China - Market size and forecast 2024-2029 ($ million)
- Chart on China - Year-over-year growth 2024-2029 (%)
- Data Table on China - Year-over-year growth 2024-2029 (%)
- 13.9 India - Market size and forecast 2024-2029
- Chart on India - Market size and forecast 2024-2029 ($ million)
- Data Table on India - Market size and forecast 2024-2029 ($ million)
- Chart on India - Year-over-year growth 2024-2029 (%)
- Data Table on India - Year-over-year growth 2024-2029 (%)
- 13.10 Russia - Market size and forecast 2024-2029
- Chart on Russia - Market size and forecast 2024-2029 ($ million)
- Data Table on Russia - Market size and forecast 2024-2029 ($ million)
- Chart on Russia - Year-over-year growth 2024-2029 (%)
- Data Table on Russia - Year-over-year growth 2024-2029 (%)
- 13.11 Japan - Market size and forecast 2024-2029
- Chart on Japan - Market size and forecast 2024-2029 ($ million)
- Data Table on Japan - Market size and forecast 2024-2029 ($ million)
- Chart on Japan - Year-over-year growth 2024-2029 (%)
- Data Table on Japan - Year-over-year growth 2024-2029 (%)
- 13.12 France - Market size and forecast 2024-2029
- Chart on France - Market size and forecast 2024-2029 ($ million)
- Data Table on France - Market size and forecast 2024-2029 ($ million)
- Chart on France - Year-over-year growth 2024-2029 (%)
- Data Table on France - Year-over-year growth 2024-2029 (%)
- 13.13 South Korea - Market size and forecast 2024-2029
- Chart on South Korea - Market size and forecast 2024-2029 ($ million)
- Data Table on South Korea - Market size and forecast 2024-2029 ($ million)
- Chart on South Korea - Year-over-year growth 2024-2029 (%)
- Data Table on South Korea - Year-over-year growth 2024-2029 (%)
- 13.14 UK - Market size and forecast 2024-2029
- Chart on UK - Market size and forecast 2024-2029 ($ million)
- Data Table on UK - Market size and forecast 2024-2029 ($ million)
- Chart on UK - Year-over-year growth 2024-2029 (%)
- Data Table on UK - Year-over-year growth 2024-2029 (%)
- 13.15 Germany - Market size and forecast 2024-2029
- Chart on Germany - Market size and forecast 2024-2029 ($ million)
- Data Table on Germany - Market size and forecast 2024-2029 ($ million)
- Chart on Germany - Year-over-year growth 2024-2029 (%)
- Data Table on Germany - Year-over-year growth 2024-2029 (%)
- 13.16 Australia - Market size and forecast 2024-2029
- Chart on Australia - Market size and forecast 2024-2029 ($ million)
- Data Table on Australia - Market size and forecast 2024-2029 ($ million)
- Chart on Australia - Year-over-year growth 2024-2029 (%)
- Data Table on Australia - Year-over-year growth 2024-2029 (%)
- 13.17 US - Market size and forecast 2024-2029
- Chart on US - Market size and forecast 2024-2029 ($ million)
- Data Table on US - Market size and forecast 2024-2029 ($ million)
- Chart on US - Year-over-year growth 2024-2029 (%)
- Data Table on US - Year-over-year growth 2024-2029 (%)
- 13.18 Market opportunity By Geographical Landscape
- Market opportunity By Geographical Landscape ($ million)
- Data Tables on Market opportunity By Geographical Landscape ($ million)
14 Drivers, Challenges, and Opportunity/Restraints
- 14.1 Market drivers
- 14.2 Market challenges
- 14.3 Impact of drivers and challenges
- Impact of drivers and challenges in 2024 and 2029
- 14.4 Market opportunities/restraints
15 Competitive Landscape
- 15.1 Overview
- 15.2 Competitive Landscape
- Overview on criticality of inputs and factors of differentiation
- 15.3 Landscape disruption
- Overview on factors of disruption
- 15.4 Industry risks
- Impact of key risks on business
16 Competitive Analysis
- 16.1 Companies profiled
- Companies covered
- 16.2 Company ranking index
- Company ranking index
- 16.3 Market positioning of companies
- Matrix on companies position and classification
- 16.4 Adient Plc
- Adient Plc - Overview
- Adient Plc - Business segments
- Adient Plc - Key offerings
- Adient Plc - Segment focus
- SWOT
- 16.5 AUNDE Group SE
- AUNDE Group SE - Overview
- AUNDE Group SE - Product / Service
- AUNDE Group SE - Key offerings
- SWOT
- 16.6 BASF SE
- BASF SE - Overview
- BASF SE - Business segments
- BASF SE - Key news
- BASF SE - Key offerings
- BASF SE - Segment focus
- SWOT
- 16.7 Brusa Koltuk
- Brusa Koltuk - Overview
- Brusa Koltuk - Product / Service
- Brusa Koltuk - Key offerings
- SWOT
- 16.8 Commercial Vehicle Group Inc.
- Commercial Vehicle Group Inc. - Overview
- Commercial Vehicle Group Inc. - Business segments
- Commercial Vehicle Group Inc. - Key offerings
- Commercial Vehicle Group Inc. - Segment focus
- SWOT
- 16.9 Faurecia SE
- Faurecia SE - Overview
- Faurecia SE - Product / Service
- Faurecia SE - Key news
- Faurecia SE - Key offerings
- SWOT
- 16.10 Franz Kiel GmbH
- Franz Kiel GmbH - Overview
- Franz Kiel GmbH - Product / Service
- Franz Kiel GmbH - Key offerings
- SWOT
- 16.11 Freedman Seating Co.
- Freedman Seating Co. - Overview
- Freedman Seating Co. - Product / Service
- Freedman Seating Co. - Key offerings
- SWOT
- 16.12 Lazzerini Srl
- Lazzerini Srl - Overview
- Lazzerini Srl - Product / Service
- Lazzerini Srl - Key offerings
- SWOT
- 16.13 Leadcom Seating Inc.
- Leadcom Seating Inc. - Overview
- Leadcom Seating Inc. - Product / Service
- Leadcom Seating Inc. - Key offerings
- SWOT
- 16.14 Magna International Inc.
- Magna International Inc. - Overview
- Magna International Inc. - Business segments
- Magna International Inc. - Key news
- Magna International Inc. - Key offerings
- Magna International Inc. - Segment focus
- SWOT
- 16.15 Minda Industries Ltd.
- Minda Industries Ltd. - Overview
- Minda Industries Ltd. - Product / Service
- Minda Industries Ltd. - Key offerings
- SWOT
- 16.16 Ningbo Jifeng Auto Parts Co. Ltd.
- Ningbo Jifeng Auto Parts Co. Ltd. - Overview
- Ningbo Jifeng Auto Parts Co. Ltd. - Product / Service
- Ningbo Jifeng Auto Parts Co. Ltd. - Key offerings
- SWOT
- 16.17 Pinnacle Industries Ltd.
- Pinnacle Industries Ltd. - Overview
- Pinnacle Industries Ltd. - Product / Service
- Pinnacle Industries Ltd. - Key offerings
- SWOT
- 16.18 Tata Motors Ltd.
- Tata Motors Ltd. - Overview
- Tata Motors Ltd. - Business segments
- Tata Motors Ltd. - Key news
- Tata Motors Ltd. - Key offerings
- Tata Motors Ltd. - Segment focus
- SWOT
17 Appendix
- 17.1 Scope of the report
- 17.2 Inclusions and exclusions checklist
- Inclusions checklist
- Exclusions checklist
- 17.3 Currency conversion rates for US$
- Currency conversion rates for US$
- 17.4 Research methodology
- Research methodology
- 17.5 Data procurement
- Information sources
- 17.6 Data validation
- Data validation
- 17.7 Validation techniques employed for market sizing
- Validation techniques employed for market sizing
- 17.8 Data synthesis
- Data synthesis
- 17.9 360 degree market analysis
- 360 degree market analysis
- 17.10 List of abbreviations
- List of abbreviations
