|
|
市場調査レポート
商品コード
1915314
船舶用ローディングアームの世界市場、2026年~2030年Global Marine Loading Arms Market 2026-2030 |
||||||
|
|||||||
カスタマイズ可能
|
|||||||

| 船舶用ローディングアームの世界市場、2026年~2030年 |
|
出版日: 2026年01月19日
発行: TechNavio
ページ情報: 英文 312 Pages
納期: 即納可能
|

概要
世界の船舶用ローディングアーム市場は、2025年から2030年にかけて8,618万7,400米ドルの成長が見込まれ、予測期間中のCAGRは4.1%と予測されています。
本報告書では、世界の船舶用ローディングアーム市場に関する包括的な分析、市場規模と予測、動向、成長要因、課題に加え、約25社のベンダー分析を提供しております。
本レポートは、現在の市場状況、最新の動向と促進要因、市場環境全般に関する最新の分析を提供します。市場は、新たな石油・ガス探査政策、世界の石油・ガス需要の増加、化学産業からの船舶用ローディングアーム需要の増加によって牽引されています。
本調査は、業界の主要関係者からの情報を含む一次情報と二次情報を客観的に組み合わせて実施されました。本レポートには、主要企業の分析に加え、包括的な市場規模データ、地域別分析を伴うセグメント、ベンダー情勢が含まれています。レポートには過去データと予測データが掲載されています。
| 市場範囲 | |
|---|---|
| 基準年 | 2026年 |
| 終了年 | 2030年 |
| 予測期間 | 2026年~2030年 |
| 成長モメンタム | 加速 |
| 前年比2026年 | 4% |
| CAGR | 4.1% |
| 増分額 | 8,618万7,400米ドル |
本調査では、動作認識機能を備えた船舶用ローディングアームの登場が、今後数年間における世界の船舶用ローディングアーム市場の成長を牽引する主要な要因の一つであると特定しております。また、移動式船舶用ローディングアームの出現とLNG燃料の普及拡大が、市場において相当な需要を生み出すことになると見込まれます。
目次
第1章 エグゼクティブサマリー
第2章 Technavio分析
- 価格・ライフサイクル・顧客購入バスケット・採用率・購入基準の分析
- インプットの重要性と差別化の要因
- 混乱の要因
- 促進要因と課題の影響
第3章 市場情勢
- 市場エコシステム
- 市場の特徴
- バリューチェーン分析
第4章 市場規模
- 市場の定義
- 市場セグメント分析
- 市場規模、2025年
- 市場の見通し、2025年~2030年
第5章 市場規模実績
- 世界の船舶用ローディングアーム市場、2020年~2024年
- 用途別セグメント分析、2020年~2024年
- タイプセグメント分析、2020年~2024年
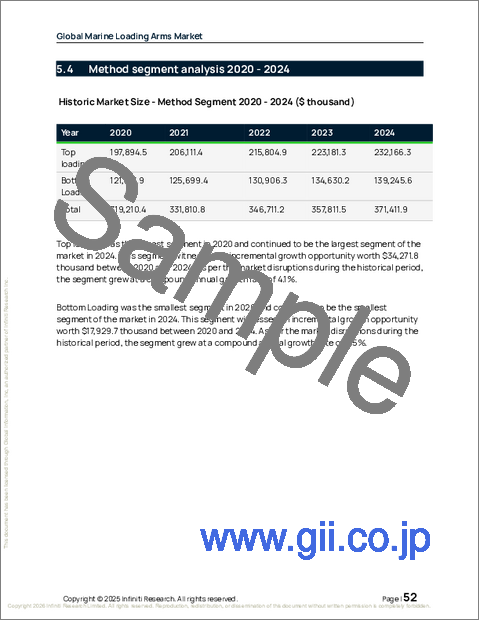
- 方法セグメント分析、2020年~2024年
- 材料セグメント分析、2020年~2024年
- 地域別セグメント分析、2020年~2024年
- 国別セグメント分析、2020年~2024年
第6章 定性分析
- AIの影響:世界の船舶用ローディングアーム市場
第7章 ファイブフォース分析
- ファイブフォースの要約
- 買い手の交渉力
- 供給企業の交渉力
- 新規参入業者の脅威
- 代替品の脅威
- 競争の脅威
- 市況
第8章 市場セグメンテーション:用途別
- 比較:用途別
- 原油
- LG
- IG
- 市場機会:用途別
第9章 市場セグメンテーション:タイプ別
- 比較:タイプ別
- 手動式船舶用ローディングアーム
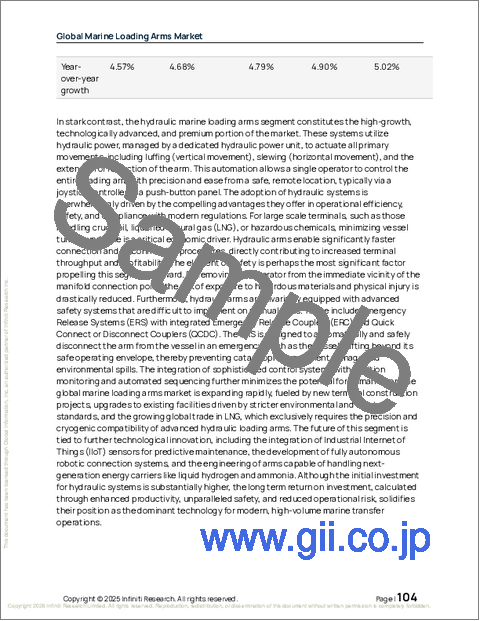
- 油圧式船舶用ローディングアーム
- 市場機会:タイプ別
第10章 市場セグメンテーション:方法別
- 比較:方法別
- トップローディング
- ボトムローディング
- 市場機会:方法別
第11章 市場セグメンテーション:材料別
- 比較:材料別
- 炭素鋼
- ステンレス鋼
- アルミニウム
- その他
- 市場機会:材料別
第12章 顧客情勢
第13章 地域別情勢
- 地域別セグメンテーション
- 地域別比較
- アジア太平洋
- 中国
- インド
- 日本
- 韓国
- オーストラリア
- インドネシア
- 北米
- 米国
- カナダ
- メキシコ
- 欧州
- ドイツ
- オランダ
- ノルウェー
- フランス
- イタリア
- スペイン
- 中東・アフリカ
- サウジアラビア
- アラブ首長国連邦
- 南アフリカ
- エジプト
- トルコ
- 南米
- ブラジル
- アルゼンチン
- チリ
- 市場機会:地域別
第14章 促進要因・課題・機会
- 市場促進要因
- 市場の課題
- 促進要因と課題の影響
- 市場機会
第15章 競合情勢
- 概要
- 競合情勢
- 混乱の状況
- 業界のリスク
第16章 競合分析
- 企業プロファイル
- 企業ランキング指標
- 企業の市場ポジショニング
- Baretti
- Carbis Loadtec Group
- Flotech Performance Systems
- Ingersoll Rand Inc.
- J de Jonge Group
- Jiangsu Changlong Co. Ltd.
- JRE Pvt. Ltd.
- KANON Loading Equipment BV
- Lianyungang HUADE Co. Ltd.
- Lloyds Steel Industries Ltd.
- OPW Engineered Systems
- TB Global Technologies Ltd.
- TechnipFMC plc
- WLT liquid and gas BV
- Woodfield Systems
