|
|
市場調査レポート
商品コード
1685036
アロエベラエキスの世界市場 2025-2029Global Aloe Vera Extracts Market 2025-2029 |
||||||

|
|||||||
カスタマイズ可能
|
|||||||


| アロエベラエキスの世界市場 2025-2029 |
|
出版日: 2025年03月06日
発行: TechNavio
ページ情報: 英文 201 Pages
納期: 即納可能
|

全表示
- 概要
- 図表
- 目次
アロエベラエキス市場は2024年から2029年に16億1,210万米ドル成長し、予測期間中のCAGRは9.3%で成長すると予測されます。
当レポートでは、アロエベラエキス市場の全体的な分析、市場規模・予測、動向、成長促進要因、課題、約25のベンダーを網羅したベンダー分析などを掲載しています。
現在の市場シナリオ、最新動向と促進要因、市場環境全体に関する最新分析を提供しています。地中海食への選好の高まり、ナチュラル・オーガニック製品への需要の高まり、パーソナルケア・化粧品産業の拡大などが市場を牽引しています。
| 市場範囲 | |
|---|---|
| 基準年 | 2025年 |
| 終了年 | 2029年 |
| 予測期間 | 2025年~2029年 |
| 成長モメンタム | 加速 |
| 前年比2025年 | 8.5% |
| CAGR | 9.3% |
| 増分額 | 16億1,210万米ドル |
本調査は、業界の主要参加者からのインプットを含め、一次情報と二次情報を客観的に組み合わせて実施しました。レポートには、主要企業の分析に加え、包括的な市場規模データ、地域分析によるセグメント、ベンダー情勢が含まれています。レポートには実績データと予測データがあります。
本調査では、今後数年間のアロエベラエキス市場の成長を促進する主な理由の一つとして、アロエベラの薬効に対する認知度の高まりを挙げています。また、新興市場におけるアロエベラエキスの人気の高まりや、オーガニックアロエベラエキスへの消費者の選好の変化は、市場の大きな需要につながります。
目次
第1章 エグゼクティブサマリー
- 市場概要
第2章 Technavio分析
- 価格反応性・ライフサイクル・顧客購入バスケット・採用率・購入基準の分析
- インプットの重要性と差別化の要因
- 混乱の要因
- 促進要因と課題の影響
第3章 市場情勢
- 市場エコシステム
- 市場の特徴
- バリューチェーン分析
第4章 市場規模
- 市場の定義
- 市場セグメント分析
- 市場規模、2024年
- 市場の見通し、2024年~2029年
第5章 市場規模実績
- アロエベラエキスの世界市場、2019年~2023年
- 流通チャネルセグメント分析、2019年~2023年
- 用途セグメント分析、2019年~2023年
- フォームファクターセグメント分析、2019年~2023年
- 地域別セグメント分析、2019年~2023年
- 国別セグメント分析、2019年~2023年
第6章 定性分析
- AIの影響:アロエベラエキスの世界市場
第7章 ファイブフォース分析
- ファイブフォースの要約
- 買い手の交渉力
- 供給企業の交渉力
- 新規参入業者の脅威
- 代替品の脅威
- 競争の脅威
- 市況
第8章 市場セグメンテーション:流通チャネル別
- 市場セグメント
- 比較:流通チャネル別
- オフライン:市場規模と予測、2024年~2029年
- オンライン:市場規模と予測、2024年~2029年
- 市場機会:流通チャネル別
第9章 市場セグメンテーション:用途別
- 市場セグメント
- 比較:用途別
- 化粧品:市場規模と予測、2024年~2029年
- 医薬品:市場規模と予測、2024年~2029年
- 食品・飲料:市場規模と予測、2024年~2029年
- 市場機会:用途別
第10章 市場セグメンテーション:フォームファクター別
- 市場セグメント
- 比較:フォームファクター別
- 液体:市場規模と予測、2024年~2029年
- ゲル:市場規模と予測、2024年~2029年
- 粉末:市場規模と予測、2024年~2029年
- その他:市場規模と予測、2024年~2029年
- 市場機会:フォームファクター別
第11章 顧客情勢
- 顧客情勢の概要
第12章 地域別情勢
- 地域別セグメンテーション
- 地域別比較
- アジア太平洋:市場規模と予測、2024年~2029年
- 北米:市場規模と予測、2024年~2029年
- 欧州:市場規模と予測、2024年~2029年
- 南米:市場規模と予測、2024年~2029年
- 中東・アフリカ:市場規模と予測、2024年~2029年
- 米国:市場規模と予測、2024年~2029年
- 中国:市場規模と予測、2024年~2029年
- 日本:市場規模と予測、2024年~2029年
- インド:市場規模と予測、2024年~2029年
- カナダ:市場規模と予測、2024年~2029年
- 韓国:市場規模と予測、2024年~2029年
- 英国:市場規模と予測、2024年~2029年
- ドイツ:市場規模と予測、2024年~2029年
- フランス:市場規模と予測、2024年~2029年
- イタリア:市場規模と予測、2024年~2029年
- 市場機会:地域情勢別
第13章 促進要因、課題、機会/抑制要因
- 市場促進要因
- 市場の課題
- 促進要因と課題の影響
- 市場の機会/抑制要因
第14章 競合情勢
- 概要
- 競合情勢
- 混乱の状況
- 業界のリスク
第15章 競合分析
- 企業プロファイル
- 企業ランキング指数
- 企業の市場ポジショニング
- Alogenic
- Alpspure Lifesciences Pvt. Ltd.
- Anwel Life Sciences Pvt. Ltd.
- AOS Products Pvt. Ltd.
- Arkure Health Care
- ASM Pharmaceuticals and RD Center
- Botanic Healthcare Group
- Forever Living Products International LLC
- Herbal Creations
- Herboil Chem
- HOAP Industries
- Natura Biotechnol Pvt. Ltd.
- Phyto Life Sciences P. Ltd.
- Rudra Shakti Herbs Pvt. Ltd.
- Terry Laboratories LLC
第16章 付録
Exhibits:
- Exhibits1: Executive Summary - Chart on Market Overview
- Exhibits2: Executive Summary - Data Table on Market Overview
- Exhibits3: Executive Summary - Chart on Global Market Characteristics
- Exhibits4: Executive Summary - Chart on Market By Geographical Landscape
- Exhibits5: Executive Summary - Chart on Market Segmentation by Distribution Channel
- Exhibits6: Executive Summary - Chart on Market Segmentation by Application
- Exhibits7: Executive Summary - Chart on Market Segmentation by Form Factor
- Exhibits8: Executive Summary - Chart on Incremental Growth
- Exhibits9: Executive Summary - Data Table on Incremental Growth
- Exhibits10: Executive Summary - Chart on Company Market Positioning
- Exhibits11: Analysis of price sensitivity, lifecycle, customer purchase basket, adoption rates, and purchase criteria
- Exhibits12: Overview on criticality of inputs and factors of differentiation
- Exhibits13: Overview on factors of disruption
- Exhibits14: Impact of drivers and challenges in 2024 and 2029
- Exhibits15: Parent Market
- Exhibits16: Data Table on - Parent Market
- Exhibits17: Market characteristics analysis
- Exhibits18: Value chain analysis
- Exhibits19: Offerings of companies included in the market definition
- Exhibits20: Market segments
- Exhibits21: Chart on Global - Market size and forecast 2024-2029 ($ million)
- Exhibits22: Data Table on Global - Market size and forecast 2024-2029 ($ million)
- Exhibits23: Chart on Global Market: Year-over-year growth 2024-2029 (%)
- Exhibits24: Data Table on Global Market: Year-over-year growth 2024-2029 (%)
- Exhibits25: Historic Market Size - Data Table on Global Aloe Vera Extracts Market 2019 - 2023 ($ million)
- Exhibits26: Historic Market Size - Distribution Channel Segment 2019 - 2023 ($ million)
- Exhibits27: Historic Market Size - Application Segment 2019 - 2023 ($ million)
- Exhibits28: Historic Market Size - Form Factor Segment 2019 - 2023 ($ million)
- Exhibits29: Historic Market Size - Geography Segment 2019 - 2023 ($ million)
- Exhibits30: Historic Market Size - Country Segment 2019 - 2023 ($ million)
- Exhibits31: Five forces analysis - Comparison between 2024 and 2029
- Exhibits32: Bargaining power of buyers - Impact of key factors 2024 and 2029
- Exhibits33: Bargaining power of suppliers - Impact of key factors in 2024 and 2029
- Exhibits34: Threat of new entrants - Impact of key factors in 2024 and 2029
- Exhibits35: Threat of substitutes - Impact of key factors in 2024 and 2029
- Exhibits36: Threat of rivalry - Impact of key factors in 2024 and 2029
- Exhibits37: Chart on Market condition - Five forces 2024 and 2029
- Exhibits38: Chart on Distribution Channel - Market share 2024-2029 (%)
- Exhibits39: Data Table on Distribution Channel - Market share 2024-2029 (%)
- Exhibits40: Chart on Comparison by Distribution Channel
- Exhibits41: Data Table on Comparison by Distribution Channel
- Exhibits42: Chart on Offline - Market size and forecast 2024-2029 ($ million)
- Exhibits43: Data Table on Offline - Market size and forecast 2024-2029 ($ million)
- Exhibits44: Chart on Offline - Year-over-year growth 2024-2029 (%)
- Exhibits45: Data Table on Offline - Year-over-year growth 2024-2029 (%)
- Exhibits46: Chart on Online - Market size and forecast 2024-2029 ($ million)
- Exhibits47: Data Table on Online - Market size and forecast 2024-2029 ($ million)
- Exhibits48: Chart on Online - Year-over-year growth 2024-2029 (%)
- Exhibits49: Data Table on Online - Year-over-year growth 2024-2029 (%)
- Exhibits50: Market opportunity by Distribution Channel ($ million)
- Exhibits51: Data Table on Market opportunity by Distribution Channel ($ million)
- Exhibits52: Chart on Application - Market share 2024-2029 (%)
- Exhibits53: Data Table on Application - Market share 2024-2029 (%)
- Exhibits54: Chart on Comparison by Application
- Exhibits55: Data Table on Comparison by Application
- Exhibits56: Chart on Cosmetics - Market size and forecast 2024-2029 ($ million)
- Exhibits57: Data Table on Cosmetics - Market size and forecast 2024-2029 ($ million)
- Exhibits58: Chart on Cosmetics - Year-over-year growth 2024-2029 (%)
- Exhibits59: Data Table on Cosmetics - Year-over-year growth 2024-2029 (%)
- Exhibits60: Chart on Pharmaceuticals - Market size and forecast 2024-2029 ($ million)
- Exhibits61: Data Table on Pharmaceuticals - Market size and forecast 2024-2029 ($ million)
- Exhibits62: Chart on Pharmaceuticals - Year-over-year growth 2024-2029 (%)
- Exhibits63: Data Table on Pharmaceuticals - Year-over-year growth 2024-2029 (%)
- Exhibits64: Chart on Food and beverages - Market size and forecast 2024-2029 ($ million)
- Exhibits65: Data Table on Food and beverages - Market size and forecast 2024-2029 ($ million)
- Exhibits66: Chart on Food and beverages - Year-over-year growth 2024-2029 (%)
- Exhibits67: Data Table on Food and beverages - Year-over-year growth 2024-2029 (%)
- Exhibits68: Market opportunity by Application ($ million)
- Exhibits69: Data Table on Market opportunity by Application ($ million)
- Exhibits70: Chart on Form Factor - Market share 2024-2029 (%)
- Exhibits71: Data Table on Form Factor - Market share 2024-2029 (%)
- Exhibits72: Chart on Comparison by Form Factor
- Exhibits73: Data Table on Comparison by Form Factor
- Exhibits74: Chart on Liquid - Market size and forecast 2024-2029 ($ million)
- Exhibits75: Data Table on Liquid - Market size and forecast 2024-2029 ($ million)
- Exhibits76: Chart on Liquid - Year-over-year growth 2024-2029 (%)
- Exhibits77: Data Table on Liquid - Year-over-year growth 2024-2029 (%)
- Exhibits78: Chart on Gel - Market size and forecast 2024-2029 ($ million)
- Exhibits79: Data Table on Gel - Market size and forecast 2024-2029 ($ million)
- Exhibits80: Chart on Gel - Year-over-year growth 2024-2029 (%)
- Exhibits81: Data Table on Gel - Year-over-year growth 2024-2029 (%)
- Exhibits82: Chart on Powder - Market size and forecast 2024-2029 ($ million)
- Exhibits83: Data Table on Powder - Market size and forecast 2024-2029 ($ million)
- Exhibits84: Chart on Powder - Year-over-year growth 2024-2029 (%)
- Exhibits85: Data Table on Powder - Year-over-year growth 2024-2029 (%)
- Exhibits86: Chart on Others - Market size and forecast 2024-2029 ($ million)
- Exhibits87: Data Table on Others - Market size and forecast 2024-2029 ($ million)
- Exhibits88: Chart on Others - Year-over-year growth 2024-2029 (%)
- Exhibits89: Data Table on Others - Year-over-year growth 2024-2029 (%)
- Exhibits90: Market opportunity by Form Factor ($ million)
- Exhibits91: Data Table on Market opportunity by Form Factor ($ million)
- Exhibits92: Analysis of price sensitivity, lifecycle, customer purchase basket, adoption rates, and purchase criteria
- Exhibits93: Chart on Market share By Geographical Landscape 2024-2029 (%)
- Exhibits94: Data Table on Market share By Geographical Landscape 2024-2029 (%)
- Exhibits95: Chart on Geographic comparison
- Exhibits96: Data Table on Geographic comparison
- Exhibits97: Chart on APAC - Market size and forecast 2024-2029 ($ million)
- Exhibits98: Data Table on APAC - Market size and forecast 2024-2029 ($ million)
- Exhibits99: Chart on APAC - Year-over-year growth 2024-2029 (%)
- Exhibits100: Data Table on APAC - Year-over-year growth 2024-2029 (%)
- Exhibits101: Chart on North America - Market size and forecast 2024-2029 ($ million)
- Exhibits102: Data Table on North America - Market size and forecast 2024-2029 ($ million)
- Exhibits103: Chart on North America - Year-over-year growth 2024-2029 (%)
- Exhibits104: Data Table on North America - Year-over-year growth 2024-2029 (%)
- Exhibits105: Chart on Europe - Market size and forecast 2024-2029 ($ million)
- Exhibits106: Data Table on Europe - Market size and forecast 2024-2029 ($ million)
- Exhibits107: Chart on Europe - Year-over-year growth 2024-2029 (%)
- Exhibits108: Data Table on Europe - Year-over-year growth 2024-2029 (%)
- Exhibits109: Chart on South America - Market size and forecast 2024-2029 ($ million)
- Exhibits110: Data Table on South America - Market size and forecast 2024-2029 ($ million)
- Exhibits111: Chart on South America - Year-over-year growth 2024-2029 (%)
- Exhibits112: Data Table on South America - Year-over-year growth 2024-2029 (%)
- Exhibits113: Chart on Middle East and Africa - Market size and forecast 2024-2029 ($ million)
- Exhibits114: Data Table on Middle East and Africa - Market size and forecast 2024-2029 ($ million)
- Exhibits115: Chart on Middle East and Africa - Year-over-year growth 2024-2029 (%)
- Exhibits116: Data Table on Middle East and Africa - Year-over-year growth 2024-2029 (%)
- Exhibits117: Chart on US - Market size and forecast 2024-2029 ($ million)
- Exhibits118: Data Table on US - Market size and forecast 2024-2029 ($ million)
- Exhibits119: Chart on US - Year-over-year growth 2024-2029 (%)
- Exhibits120: Data Table on US - Year-over-year growth 2024-2029 (%)
- Exhibits121: Chart on China - Market size and forecast 2024-2029 ($ million)
- Exhibits122: Data Table on China - Market size and forecast 2024-2029 ($ million)
- Exhibits123: Chart on China - Year-over-year growth 2024-2029 (%)
- Exhibits124: Data Table on China - Year-over-year growth 2024-2029 (%)
- Exhibits125: Chart on Japan - Market size and forecast 2024-2029 ($ million)
- Exhibits126: Data Table on Japan - Market size and forecast 2024-2029 ($ million)
- Exhibits127: Chart on Japan - Year-over-year growth 2024-2029 (%)
- Exhibits128: Data Table on Japan - Year-over-year growth 2024-2029 (%)
- Exhibits129: Chart on India - Market size and forecast 2024-2029 ($ million)
- Exhibits130: Data Table on India - Market size and forecast 2024-2029 ($ million)
- Exhibits131: Chart on India - Year-over-year growth 2024-2029 (%)
- Exhibits132: Data Table on India - Year-over-year growth 2024-2029 (%)
- Exhibits133: Chart on Canada - Market size and forecast 2024-2029 ($ million)
- Exhibits134: Data Table on Canada - Market size and forecast 2024-2029 ($ million)
- Exhibits135: Chart on Canada - Year-over-year growth 2024-2029 (%)
- Exhibits136: Data Table on Canada - Year-over-year growth 2024-2029 (%)
- Exhibits137: Chart on South Korea - Market size and forecast 2024-2029 ($ million)
- Exhibits138: Data Table on South Korea - Market size and forecast 2024-2029 ($ million)
- Exhibits139: Chart on South Korea - Year-over-year growth 2024-2029 (%)
- Exhibits140: Data Table on South Korea - Year-over-year growth 2024-2029 (%)
- Exhibits141: Chart on UK - Market size and forecast 2024-2029 ($ million)
- Exhibits142: Data Table on UK - Market size and forecast 2024-2029 ($ million)
- Exhibits143: Chart on UK - Year-over-year growth 2024-2029 (%)
- Exhibits144: Data Table on UK - Year-over-year growth 2024-2029 (%)
- Exhibits145: Chart on Germany - Market size and forecast 2024-2029 ($ million)
- Exhibits146: Data Table on Germany - Market size and forecast 2024-2029 ($ million)
- Exhibits147: Chart on Germany - Year-over-year growth 2024-2029 (%)
- Exhibits148: Data Table on Germany - Year-over-year growth 2024-2029 (%)
- Exhibits149: Chart on France - Market size and forecast 2024-2029 ($ million)
- Exhibits150: Data Table on France - Market size and forecast 2024-2029 ($ million)
- Exhibits151: Chart on France - Year-over-year growth 2024-2029 (%)
- Exhibits152: Data Table on France - Year-over-year growth 2024-2029 (%)
- Exhibits153: Chart on Italy - Market size and forecast 2024-2029 ($ million)
- Exhibits154: Data Table on Italy - Market size and forecast 2024-2029 ($ million)
- Exhibits155: Chart on Italy - Year-over-year growth 2024-2029 (%)
- Exhibits156: Data Table on Italy - Year-over-year growth 2024-2029 (%)
- Exhibits157: Market opportunity By Geographical Landscape ($ million)
- Exhibits158: Data Tables on Market opportunity By Geographical Landscape ($ million)
- Exhibits159: Impact of drivers and challenges in 2024 and 2029
- Exhibits160: Overview on criticality of inputs and factors of differentiation
- Exhibits161: Overview on factors of disruption
- Exhibits162: Impact of key risks on business
- Exhibits163: Companies covered
- Exhibits164: Company ranking index
- Exhibits165: Matrix on companies position and classification
- Exhibits166: Alogenic - Overview
- Exhibits167: Alogenic - Product / Service
- Exhibits168: Alogenic - Key offerings
- Exhibits169: SWOT
- Exhibits170: Alpspure Lifesciences Pvt. Ltd. - Overview
- Exhibits171: Alpspure Lifesciences Pvt. Ltd. - Product / Service
- Exhibits172: Alpspure Lifesciences Pvt. Ltd. - Key offerings
- Exhibits173: SWOT
- Exhibits174: Anwel Life Sciences Pvt. Ltd. - Overview
- Exhibits175: Anwel Life Sciences Pvt. Ltd. - Product / Service
- Exhibits176: Anwel Life Sciences Pvt. Ltd. - Key offerings
- Exhibits177: SWOT
- Exhibits178: AOS Products Pvt. Ltd. - Overview
- Exhibits179: AOS Products Pvt. Ltd. - Product / Service
- Exhibits180: AOS Products Pvt. Ltd. - Key offerings
- Exhibits181: SWOT
- Exhibits182: Arkure Health Care - Overview
- Exhibits183: Arkure Health Care - Product / Service
- Exhibits184: Arkure Health Care - Key offerings
- Exhibits185: SWOT
- Exhibits186: ASM Pharmaceuticals and RD Center - Overview
- Exhibits187: ASM Pharmaceuticals and RD Center - Product / Service
- Exhibits188: ASM Pharmaceuticals and RD Center - Key offerings
- Exhibits189: SWOT
- Exhibits190: Botanic Healthcare Group - Overview
- Exhibits191: Botanic Healthcare Group - Product / Service
- Exhibits192: Botanic Healthcare Group - Key offerings
- Exhibits193: SWOT
- Exhibits194: Forever Living Products International LLC - Overview
- Exhibits195: Forever Living Products International LLC - Product / Service
- Exhibits196: Forever Living Products International LLC - Key offerings
- Exhibits197: SWOT
- Exhibits198: Herbal Creations - Overview
- Exhibits199: Herbal Creations - Product / Service
- Exhibits200: Herbal Creations - Key offerings
- Exhibits201: SWOT
- Exhibits202: Herboil Chem - Overview
- Exhibits203: Herboil Chem - Product / Service
- Exhibits204: Herboil Chem - Key offerings
- Exhibits205: SWOT
- Exhibits206: HOAP Industries - Overview
- Exhibits207: HOAP Industries - Product / Service
- Exhibits208: HOAP Industries - Key offerings
- Exhibits209: SWOT
- Exhibits210: Natura Biotechnol Pvt. Ltd. - Overview
- Exhibits211: Natura Biotechnol Pvt. Ltd. - Product / Service
- Exhibits212: Natura Biotechnol Pvt. Ltd. - Key offerings
- Exhibits213: SWOT
- Exhibits214: Phyto Life Sciences P. Ltd. - Overview
- Exhibits215: Phyto Life Sciences P. Ltd. - Product / Service
- Exhibits216: Phyto Life Sciences P. Ltd. - Key offerings
- Exhibits217: SWOT
- Exhibits218: Rudra Shakti Herbs Pvt. Ltd. - Overview
- Exhibits219: Rudra Shakti Herbs Pvt. Ltd. - Product / Service
- Exhibits220: Rudra Shakti Herbs Pvt. Ltd. - Key offerings
- Exhibits221: SWOT
- Exhibits222: Terry Laboratories LLC - Overview
- Exhibits223: Terry Laboratories LLC - Product / Service
- Exhibits224: Terry Laboratories LLC - Key offerings
- Exhibits225: SWOT
- Exhibits226: Inclusions checklist
- Exhibits227: Exclusions checklist
- Exhibits228: Currency conversion rates for US$
- Exhibits229: Research methodology
- Exhibits230: Information sources
- Exhibits231: Data validation
- Exhibits232: Validation techniques employed for market sizing
- Exhibits233: Data synthesis
- Exhibits234: 360 degree market analysis
- Exhibits235: List of abbreviations
The aloe vera extracts market is forecasted to grow by USD 1612.1 million during 2024-2029, accelerating at a CAGR of 9.3% during the forecast period. The report on the aloe vera extracts market provides a holistic analysis, market size and forecast, trends, growth drivers, and challenges, as well as vendor analysis covering around 25 vendors.
The report offers an up-to-date analysis regarding the current market scenario, the latest trends and drivers, and the overall market environment. The market is driven by increasing preference in mediterranean diet, rising demand for natural and organic products, and expansion of personal care and cosmetics industry.
| Market Scope | |
|---|---|
| Base Year | 2025 |
| End Year | 2029 |
| Series Year | 2025-2029 |
| Growth Momentum | Accelerate |
| YOY 2025 | 8.5% |
| CAGR | 9.3% |
| Incremental Value | $1612.1 mn |
The study was conducted using an objective combination of primary and secondary information including inputs from key participants in the industry. The report contains a comprehensive market size data, segment with regional analysis and vendor landscape in addition to an analysis of the key companies. Reports have historic and forecast data.
Technavio's aloe vera extracts market is segmented as below:
By Distribution Channel
- Offline
- Online
By Application
- Cosmetics
- Pharmaceuticals
- Food and beverages
By Form Factor
- Liquid
- Gel
- Powder
- Others
By Geographical Landscape
- APAC
- North America
- Europe
- South America
- Middle East and Africa
This study identifies the rising awareness of medicinal properties of aloe vera as one of the prime reasons driving the aloe vera extracts market growth during the next few years. Also, growing popularity of aloe vera extract in emerging markets and shifting consumer preference toward organic aloe vera extract will lead to sizable demand in the market.
The report on the aloe vera extracts market covers the following areas:
- Aloe Vera Extracts Market sizing
- Aloe Vera Extracts Market forecast
- Aloe Vera Extracts Market industry analysis
The robust vendor analysis is designed to help clients improve their market position, and in line with this, this report provides a detailed analysis of several leading aloe vera extracts market vendors that include Aloecorp Inc., Alogenic, Alpspure Lifesciences Pvt. Ltd., Anwel Life Sciences Pvt. Ltd., AOS Products Pvt. Ltd., Arkure Health Care, ASM Pharmaceuticals and RD Center, Botanic Healthcare Group, Changsha Vigorous Tech Co. Ltd., Forever Living Products International LLC, Herbal Creations, Herboil Chem, HOAP Industries, Medikonda Nutrients, Natura Biotechnol Pvt. Ltd., Phyto Life Sciences P. Ltd., Power Health Products Ltd., Rudra Shakti Herbs Pvt. Ltd., Terry Laboratories LLC, and Vive Cosmetics. Also, the aloe vera extracts market analysis report includes information on upcoming trends and challenges that will influence market growth. This is to help companies strategize and leverage all forthcoming growth opportunities.
The publisher presents a detailed picture of the market by the way of study, synthesis, and summation of data from multiple sources by an analysis of key parameters such as profit, pricing, competition, and promotions. It presents various market facets by identifying the key industry influencers. The data presented is comprehensive, reliable, and a result of extensive primary and secondary research. The market research reports provide a complete competitive landscape and an in-depth vendor selection methodology and analysis using qualitative and quantitative research to forecast accurate market growth.
Table of Contents
1 Executive Summary
- 1.1 Market overview
- Executive Summary - Chart on Market Overview
- Executive Summary - Data Table on Market Overview
- Executive Summary - Chart on Global Market Characteristics
- Executive Summary - Chart on Market By Geographical Landscape
- Executive Summary - Chart on Market Segmentation by Distribution Channel
- Executive Summary - Chart on Market Segmentation by Application
- Executive Summary - Chart on Market Segmentation by Form Factor
- Executive Summary - Chart on Incremental Growth
- Executive Summary - Data Table on Incremental Growth
- Executive Summary - Chart on Company Market Positioning
2 Technavio Analysis
- 2.1 Analysis of price sensitivity, lifecycle, customer purchase basket, adoption rates, and purchase criteria
- Analysis of price sensitivity, lifecycle, customer purchase basket, adoption rates, and purchase criteria
- 2.2 Criticality of inputs and Factors of differentiation
- Overview on criticality of inputs and factors of differentiation
- 2.3 Factors of disruption
- Overview on factors of disruption
- 2.4 Impact of drivers and challenges
- Impact of drivers and challenges in 2024 and 2029
3 Market Landscape
- 3.1 Market ecosystem
- Parent Market
- Data Table on - Parent Market
- 3.2 Market characteristics
- Market characteristics analysis
- 3.3 Value chain analysis
- Value chain analysis
4 Market Sizing
- 4.1 Market definition
- Offerings of companies included in the market definition
- 4.2 Market segment analysis
- Market segments
- 4.3 Market size 2024
- 4.4 Market outlook: Forecast for 2024-2029
- Chart on Global - Market size and forecast 2024-2029 ($ million)
- Data Table on Global - Market size and forecast 2024-2029 ($ million)
- Chart on Global Market: Year-over-year growth 2024-2029 (%)
- Data Table on Global Market: Year-over-year growth 2024-2029 (%)
5 Historic Market Size
- 5.1 Global Aloe Vera Extracts Market 2019 - 2023
- Historic Market Size - Data Table on Global Aloe Vera Extracts Market 2019 - 2023 ($ million)
- 5.2 Distribution Channel segment analysis 2019 - 2023
- Historic Market Size - Distribution Channel Segment 2019 - 2023 ($ million)
- 5.3 Application segment analysis 2019 - 2023
- Historic Market Size - Application Segment 2019 - 2023 ($ million)
- 5.4 Form Factor segment analysis 2019 - 2023
- Historic Market Size - Form Factor Segment 2019 - 2023 ($ million)
- 5.5 Geography segment analysis 2019 - 2023
- Historic Market Size - Geography Segment 2019 - 2023 ($ million)
- 5.6 Country segment analysis 2019 - 2023
- Historic Market Size - Country Segment 2019 - 2023 ($ million)
6 Qualitative Analysis
- 6.1 Impact of AI on the Global Aloe Vera Extracts Market
7 Five Forces Analysis
- 7.1 Five forces summary
- Five forces analysis - Comparison between 2024 and 2029
- 7.2 Bargaining power of buyers
- Bargaining power of buyers - Impact of key factors 2024 and 2029
- 7.3 Bargaining power of suppliers
- Bargaining power of suppliers - Impact of key factors in 2024 and 2029
- 7.4 Threat of new entrants
- Threat of new entrants - Impact of key factors in 2024 and 2029
- 7.5 Threat of substitutes
- Threat of substitutes - Impact of key factors in 2024 and 2029
- 7.6 Threat of rivalry
- Threat of rivalry - Impact of key factors in 2024 and 2029
- 7.7 Market condition
- Chart on Market condition - Five forces 2024 and 2029
8 Market Segmentation by Distribution Channel
- 8.1 Market segments
- Chart on Distribution Channel - Market share 2024-2029 (%)
- Data Table on Distribution Channel - Market share 2024-2029 (%)
- 8.2 Comparison by Distribution Channel
- Chart on Comparison by Distribution Channel
- Data Table on Comparison by Distribution Channel
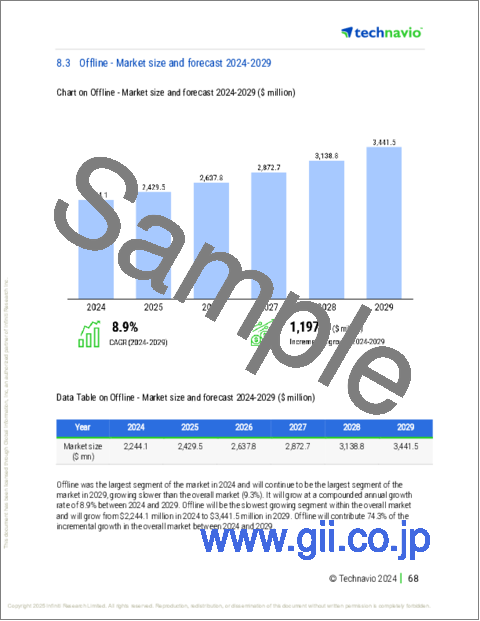
- 8.3 Offline - Market size and forecast 2024-2029
- Chart on Offline - Market size and forecast 2024-2029 ($ million)
- Data Table on Offline - Market size and forecast 2024-2029 ($ million)
- Chart on Offline - Year-over-year growth 2024-2029 (%)
- Data Table on Offline - Year-over-year growth 2024-2029 (%)
- 8.4 Online - Market size and forecast 2024-2029
- Chart on Online - Market size and forecast 2024-2029 ($ million)
- Data Table on Online - Market size and forecast 2024-2029 ($ million)
- Chart on Online - Year-over-year growth 2024-2029 (%)
- Data Table on Online - Year-over-year growth 2024-2029 (%)
- 8.5 Market opportunity by Distribution Channel
- Market opportunity by Distribution Channel ($ million)
- Data Table on Market opportunity by Distribution Channel ($ million)
9 Market Segmentation by Application
- 9.1 Market segments
- Chart on Application - Market share 2024-2029 (%)
- Data Table on Application - Market share 2024-2029 (%)
- 9.2 Comparison by Application
- Chart on Comparison by Application
- Data Table on Comparison by Application
- 9.3 Cosmetics - Market size and forecast 2024-2029
- Chart on Cosmetics - Market size and forecast 2024-2029 ($ million)
- Data Table on Cosmetics - Market size and forecast 2024-2029 ($ million)
- Chart on Cosmetics - Year-over-year growth 2024-2029 (%)
- Data Table on Cosmetics - Year-over-year growth 2024-2029 (%)
- 9.4 Pharmaceuticals - Market size and forecast 2024-2029
- Chart on Pharmaceuticals - Market size and forecast 2024-2029 ($ million)
- Data Table on Pharmaceuticals - Market size and forecast 2024-2029 ($ million)
- Chart on Pharmaceuticals - Year-over-year growth 2024-2029 (%)
- Data Table on Pharmaceuticals - Year-over-year growth 2024-2029 (%)
- 9.5 Food and beverages - Market size and forecast 2024-2029
- Chart on Food and beverages - Market size and forecast 2024-2029 ($ million)
- Data Table on Food and beverages - Market size and forecast 2024-2029 ($ million)
- Chart on Food and beverages - Year-over-year growth 2024-2029 (%)
- Data Table on Food and beverages - Year-over-year growth 2024-2029 (%)
- 9.6 Market opportunity by Application
- Market opportunity by Application ($ million)
- Data Table on Market opportunity by Application ($ million)
10 Market Segmentation by Form Factor
- 10.1 Market segments
- Chart on Form Factor - Market share 2024-2029 (%)
- Data Table on Form Factor - Market share 2024-2029 (%)
- 10.2 Comparison by Form Factor
- Chart on Comparison by Form Factor
- Data Table on Comparison by Form Factor
- 10.3 Liquid - Market size and forecast 2024-2029
- Chart on Liquid - Market size and forecast 2024-2029 ($ million)
- Data Table on Liquid - Market size and forecast 2024-2029 ($ million)
- Chart on Liquid - Year-over-year growth 2024-2029 (%)
- Data Table on Liquid - Year-over-year growth 2024-2029 (%)
- 10.4 Gel - Market size and forecast 2024-2029
- Chart on Gel - Market size and forecast 2024-2029 ($ million)
- Data Table on Gel - Market size and forecast 2024-2029 ($ million)
- Chart on Gel - Year-over-year growth 2024-2029 (%)
- Data Table on Gel - Year-over-year growth 2024-2029 (%)
- 10.5 Powder - Market size and forecast 2024-2029
- Chart on Powder - Market size and forecast 2024-2029 ($ million)
- Data Table on Powder - Market size and forecast 2024-2029 ($ million)
- Chart on Powder - Year-over-year growth 2024-2029 (%)
- Data Table on Powder - Year-over-year growth 2024-2029 (%)
- 10.6 Others - Market size and forecast 2024-2029
- Chart on Others - Market size and forecast 2024-2029 ($ million)
- Data Table on Others - Market size and forecast 2024-2029 ($ million)
- Chart on Others - Year-over-year growth 2024-2029 (%)
- Data Table on Others - Year-over-year growth 2024-2029 (%)
- 10.7 Market opportunity by Form Factor
- Market opportunity by Form Factor ($ million)
- Data Table on Market opportunity by Form Factor ($ million)
11 Customer Landscape
- 11.1 Customer landscape overview
- Analysis of price sensitivity, lifecycle, customer purchase basket, adoption rates, and purchase criteria
12 Geographic Landscape
- 12.1 Geographic segmentation
- Chart on Market share By Geographical Landscape 2024-2029 (%)
- Data Table on Market share By Geographical Landscape 2024-2029 (%)
- 12.2 Geographic comparison
- Chart on Geographic comparison
- Data Table on Geographic comparison
- 12.3 APAC - Market size and forecast 2024-2029
- Chart on APAC - Market size and forecast 2024-2029 ($ million)
- Data Table on APAC - Market size and forecast 2024-2029 ($ million)
- Chart on APAC - Year-over-year growth 2024-2029 (%)
- Data Table on APAC - Year-over-year growth 2024-2029 (%)
- 12.4 North America - Market size and forecast 2024-2029
- Chart on North America - Market size and forecast 2024-2029 ($ million)
- Data Table on North America - Market size and forecast 2024-2029 ($ million)
- Chart on North America - Year-over-year growth 2024-2029 (%)
- Data Table on North America - Year-over-year growth 2024-2029 (%)
- 12.5 Europe - Market size and forecast 2024-2029
- Chart on Europe - Market size and forecast 2024-2029 ($ million)
- Data Table on Europe - Market size and forecast 2024-2029 ($ million)
- Chart on Europe - Year-over-year growth 2024-2029 (%)
- Data Table on Europe - Year-over-year growth 2024-2029 (%)
- 12.6 South America - Market size and forecast 2024-2029
- Chart on South America - Market size and forecast 2024-2029 ($ million)
- Data Table on South America - Market size and forecast 2024-2029 ($ million)
- Chart on South America - Year-over-year growth 2024-2029 (%)
- Data Table on South America - Year-over-year growth 2024-2029 (%)
- 12.7 Middle East and Africa - Market size and forecast 2024-2029
- Chart on Middle East and Africa - Market size and forecast 2024-2029 ($ million)
- Data Table on Middle East and Africa - Market size and forecast 2024-2029 ($ million)
- Chart on Middle East and Africa - Year-over-year growth 2024-2029 (%)
- Data Table on Middle East and Africa - Year-over-year growth 2024-2029 (%)
- 12.8 US - Market size and forecast 2024-2029
- Chart on US - Market size and forecast 2024-2029 ($ million)
- Data Table on US - Market size and forecast 2024-2029 ($ million)
- Chart on US - Year-over-year growth 2024-2029 (%)
- Data Table on US - Year-over-year growth 2024-2029 (%)
- 12.9 China - Market size and forecast 2024-2029
- Chart on China - Market size and forecast 2024-2029 ($ million)
- Data Table on China - Market size and forecast 2024-2029 ($ million)
- Chart on China - Year-over-year growth 2024-2029 (%)
- Data Table on China - Year-over-year growth 2024-2029 (%)
- 12.10 Japan - Market size and forecast 2024-2029
- Chart on Japan - Market size and forecast 2024-2029 ($ million)
- Data Table on Japan - Market size and forecast 2024-2029 ($ million)
- Chart on Japan - Year-over-year growth 2024-2029 (%)
- Data Table on Japan - Year-over-year growth 2024-2029 (%)
- 12.11 India - Market size and forecast 2024-2029
- Chart on India - Market size and forecast 2024-2029 ($ million)
- Data Table on India - Market size and forecast 2024-2029 ($ million)
- Chart on India - Year-over-year growth 2024-2029 (%)
- Data Table on India - Year-over-year growth 2024-2029 (%)
- 12.12 Canada - Market size and forecast 2024-2029
- Chart on Canada - Market size and forecast 2024-2029 ($ million)
- Data Table on Canada - Market size and forecast 2024-2029 ($ million)
- Chart on Canada - Year-over-year growth 2024-2029 (%)
- Data Table on Canada - Year-over-year growth 2024-2029 (%)
- 12.13 South Korea - Market size and forecast 2024-2029
- Chart on South Korea - Market size and forecast 2024-2029 ($ million)
- Data Table on South Korea - Market size and forecast 2024-2029 ($ million)
- Chart on South Korea - Year-over-year growth 2024-2029 (%)
- Data Table on South Korea - Year-over-year growth 2024-2029 (%)
- 12.14 UK - Market size and forecast 2024-2029
- Chart on UK - Market size and forecast 2024-2029 ($ million)
- Data Table on UK - Market size and forecast 2024-2029 ($ million)
- Chart on UK - Year-over-year growth 2024-2029 (%)
- Data Table on UK - Year-over-year growth 2024-2029 (%)
- 12.15 Germany - Market size and forecast 2024-2029
- Chart on Germany - Market size and forecast 2024-2029 ($ million)
- Data Table on Germany - Market size and forecast 2024-2029 ($ million)
- Chart on Germany - Year-over-year growth 2024-2029 (%)
- Data Table on Germany - Year-over-year growth 2024-2029 (%)
- 12.16 France - Market size and forecast 2024-2029
- Chart on France - Market size and forecast 2024-2029 ($ million)
- Data Table on France - Market size and forecast 2024-2029 ($ million)
- Chart on France - Year-over-year growth 2024-2029 (%)
- Data Table on France - Year-over-year growth 2024-2029 (%)
- 12.17 Italy - Market size and forecast 2024-2029
- Chart on Italy - Market size and forecast 2024-2029 ($ million)
- Data Table on Italy - Market size and forecast 2024-2029 ($ million)
- Chart on Italy - Year-over-year growth 2024-2029 (%)
- Data Table on Italy - Year-over-year growth 2024-2029 (%)
- 12.18 Market opportunity By Geographical Landscape
- Market opportunity By Geographical Landscape ($ million)
- Data Tables on Market opportunity By Geographical Landscape ($ million)
13 Drivers, Challenges, and Opportunity/Restraints
- 13.1 Market drivers
- 13.2 Market challenges
- 13.3 Impact of drivers and challenges
- Impact of drivers and challenges in 2024 and 2029
- 13.4 Market opportunities/restraints
14 Competitive Landscape
- 14.1 Overview
- 14.2 Competitive Landscape
- Overview on criticality of inputs and factors of differentiation
- 14.3 Landscape disruption
- Overview on factors of disruption
- 14.4 Industry risks
- Impact of key risks on business
15 Competitive Analysis
- 15.1 Companies profiled
- Companies covered
- 15.2 Company ranking index
- Company ranking index
- 15.3 Market positioning of companies
- Matrix on companies position and classification
- 15.4 Alogenic
- Alogenic - Overview
- Alogenic - Product / Service
- Alogenic - Key offerings
- SWOT
- 15.5 Alpspure Lifesciences Pvt. Ltd.
- Alpspure Lifesciences Pvt. Ltd. - Overview
- Alpspure Lifesciences Pvt. Ltd. - Product / Service
- Alpspure Lifesciences Pvt. Ltd. - Key offerings
- SWOT
- 15.6 Anwel Life Sciences Pvt. Ltd.
- Anwel Life Sciences Pvt. Ltd. - Overview
- Anwel Life Sciences Pvt. Ltd. - Product / Service
- Anwel Life Sciences Pvt. Ltd. - Key offerings
- SWOT
- 15.7 AOS Products Pvt. Ltd.
- AOS Products Pvt. Ltd. - Overview
- AOS Products Pvt. Ltd. - Product / Service
- AOS Products Pvt. Ltd. - Key offerings
- SWOT
- 15.8 Arkure Health Care
- Arkure Health Care - Overview
- Arkure Health Care - Product / Service
- Arkure Health Care - Key offerings
- SWOT
- 15.9 ASM Pharmaceuticals and RD Center
- ASM Pharmaceuticals and RD Center - Overview
- ASM Pharmaceuticals and RD Center - Product / Service
- ASM Pharmaceuticals and RD Center - Key offerings
- SWOT
- 15.10 Botanic Healthcare Group
- Botanic Healthcare Group - Overview
- Botanic Healthcare Group - Product / Service
- Botanic Healthcare Group - Key offerings
- SWOT
- 15.11 Forever Living Products International LLC
- Forever Living Products International LLC - Overview
- Forever Living Products International LLC - Product / Service
- Forever Living Products International LLC - Key offerings
- SWOT
- 15.12 Herbal Creations
- Herbal Creations - Overview
- Herbal Creations - Product / Service
- Herbal Creations - Key offerings
- SWOT
- 15.13 Herboil Chem
- Herboil Chem - Overview
- Herboil Chem - Product / Service
- Herboil Chem - Key offerings
- SWOT
- 15.14 HOAP Industries
- HOAP Industries - Overview
- HOAP Industries - Product / Service
- HOAP Industries - Key offerings
- SWOT
- 15.15 Natura Biotechnol Pvt. Ltd.
- Natura Biotechnol Pvt. Ltd. - Overview
- Natura Biotechnol Pvt. Ltd. - Product / Service
- Natura Biotechnol Pvt. Ltd. - Key offerings
- SWOT
- 15.16 Phyto Life Sciences P. Ltd.
- Phyto Life Sciences P. Ltd. - Overview
- Phyto Life Sciences P. Ltd. - Product / Service
- Phyto Life Sciences P. Ltd. - Key offerings
- SWOT
- 15.17 Rudra Shakti Herbs Pvt. Ltd.
- Rudra Shakti Herbs Pvt. Ltd. - Overview
- Rudra Shakti Herbs Pvt. Ltd. - Product / Service
- Rudra Shakti Herbs Pvt. Ltd. - Key offerings
- SWOT
- 15.18 Terry Laboratories LLC
- Terry Laboratories LLC - Overview
- Terry Laboratories LLC - Product / Service
- Terry Laboratories LLC - Key offerings
- SWOT
16 Appendix
- 16.1 Scope of the report
- 16.2 Inclusions and exclusions checklist
- Inclusions checklist
- Exclusions checklist
- 16.3 Currency conversion rates for US$
- Currency conversion rates for US$
- 16.4 Research methodology
- Research methodology
- 16.5 Data procurement
- Information sources
- 16.6 Data validation
- Data validation
- 16.7 Validation techniques employed for market sizing
- Validation techniques employed for market sizing
- 16.8 Data synthesis
- Data synthesis
- 16.9 360 degree market analysis
- 360 degree market analysis
- 16.10 List of abbreviations
- List of abbreviations
