|
|
市場調査レポート
商品コード
1681206
ヒト免疫不全ウイルス(HIV)迅速検査キットの世界市場、2025-2029年Global Human Immunodeficiency Virus (HIV) Rapid Test Kits Market 2025-2029 |
||||||

|
|||||||
カスタマイズ可能
|
|||||||


| ヒト免疫不全ウイルス(HIV)迅速検査キットの世界市場、2025-2029年 |
|
出版日: 2025年03月05日
発行: TechNavio
ページ情報: 英文 231 Pages
納期: 即納可能
|

全表示
- 概要
- 目次
ヒト免疫不全ウイルス(HIV)迅速検査キット市場は、2024年から2029年にかけて3億3,830万米ドル、予測期間中のCAGRは7%で成長すると予測されています。
当レポートでは、ヒト免疫不全ウイルス(HIV)迅速検査キット市場の全体的な分析、市場規模・予測、動向、成長促進要因、課題、約25のベンダーを網羅したベンダー分析などを掲載しています。
現在の市場シナリオ、最新動向と促進要因、市場環境全体に関する最新分析を提供しています。市場は、HIV検査の啓発プログラムの増加、HIVのポイントオブケア検査に対する需要の高まり、HIVの高い有病率によって牽引されています。
| 市場範囲 | |
|---|---|
| 基準年 | 2025 |
| 終了年 | 2029 |
| 予測期間 | 2025-2029 |
| 成長モメンタム | 加速 |
| 前年比2025年 | 6% |
| CAGR | 7% |
| 増分額 | 3億3,830万米ドル |
本調査は、業界の主要参加者からのインプットを含め、一次情報と二次情報を客観的に組み合わせて実施しました。レポートには、主要企業の分析に加え、包括的な市場規模データ、地域別分析によるセグメント、ベンダー情勢が含まれています。レポートには過去データと予測データがあります。
本調査では、今後数年間のヒト免疫不全ウイルス(HIV)迅速検査キット市場の成長を促進する主な要因の一つとして、HIVの婚前スクリーニングを増加させる取り組みを挙げています。また、研究者による臨床研究の増加やメーカーによるプロモーション活動、企業による幅広いHIV迅速検査キットの提供は、市場の大きな需要につながります。
目次
第1章 エグゼクティブサマリー
- 市場概要
第2章 Technavio分析
- 価格・ライフサイクル・顧客購入バスケット・採用率・購入基準の分析
- インプットの重要性と差別化の要因
- 混乱の要因
- 促進要因と課題の影響
第3章 市場情勢
- 市場エコシステム
- 市場の特徴
- バリューチェーン分析
第4章 市場規模
- 市場の定義
- 市場セグメント分析
- 市場規模 2024
- 市場の見通し 2024-2029
第5章 市場規模実績
- ヒト免疫不全ウイルス(HIV)迅速検査キットの世界市場 2019-2023
- 流通チャネルセグメント分析 2019-2023
- タイプセグメント分析 2019-2023
- エンドユーザーセグメント分析 2019-2023
- ソースセグメント分析 2019-2023
- 地域別セグメント分析 2019-2023
- 国別セグメント分析 2019-2023
第6章 定性分析
- AIの影響:ヒト免疫不全ウイルス(HIV)迅速検査キットの世界市場
第7章 ファイブフォース分析
- ファイブフォースの要約
- 買い手の交渉力
- 供給企業の交渉力
- 新規参入業者の脅威
- 代替品の脅威
- 競争の脅威
- 市況
第8章 市場セグメンテーション:流通チャネル別
- 市場セグメント
- 比較:流通チャネル別
- オフライン:市場規模と予測 2024-2029
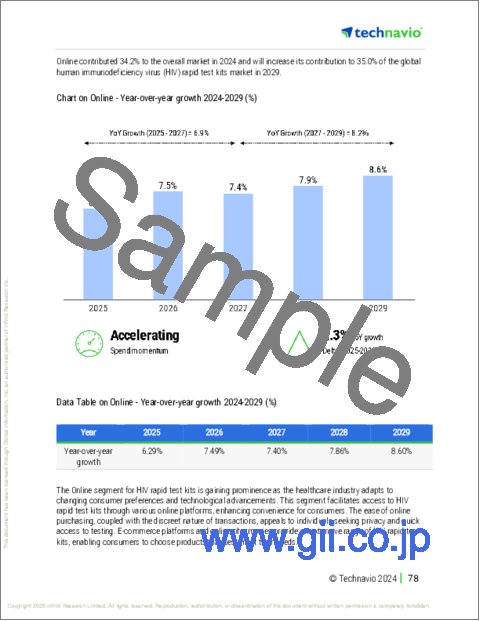
- オンライン:市場規模と予測 2024-2029
- 市場機会:流通チャネル別
第9章 市場セグメンテーション:タイプ別
- 市場セグメント
- 比較:タイプ別
- HIV迅速免疫測定検査:市場規模と予測 2024-2029
- HIV迅速分子診断検査:市場規模と予測 2024-2029
- 市場機会:タイプ別
第10章 市場セグメンテーション:エンドユーザー別
- 市場セグメント
- 比較:エンドユーザー別
- 診断センター:市場規模と予測 2024-2029
- 病院と診療所:市場規模と予測 2024-2029
- 市場機会:エンドユーザー別
第11章 市場セグメンテーション:ソース別
- 市場セグメント
- 比較:ソース別
- 血液:市場規模と予測 2024-2029
- 口腔液:市場規模と予測 2024-2029
- 尿:市場規模と予測 2024-2029
- 市場機会:ソース別
第12章 顧客情勢
- 顧客情勢の概要
第13章 地域別情勢
- 地域別セグメンテーション
- 地域別比較
- 北米:市場規模と予測 2024-2029
- 欧州:市場規模と予測 2024-2029
- アジア:市場規模と予測 2024-2029
- 世界のその他の地域:市場規模と予測 2024-2029
- 米国:市場規模と予測 2024-2029
- カナダ:市場規模と予測 2024-2029
- 中国:市場規模と予測 2024-2029
- 英国:市場規模と予測 2024-2029
- 日本:市場規模と予測 2024-2029
- ドイツ:市場規模と予測 2024-2029
- インド:市場規模と予測 2024-2029
- フランス:市場規模と予測 2024-2029
- イタリア:市場規模と予測 2024-2029
- 韓国:市場規模と予測 2024-2029
- 市場機会:地域情勢別
第14章 促進要因・課題・機会・抑制要因
- 市場促進要因
- 市場の課題
- 促進要因と課題の影響
- 市場の機会・抑制要因
第15章 競合情勢
- 概要
- 競合情勢
- 混乱の状況
- 業界のリスク
第16章 競合分析
- 企業プロファイル
- 企業ランキング指数
- 企業の市場ポジショニング
- Abbott Laboratories
- AccuQuik Test Kits
- Becton Dickinson and Co.
- bioLytical Laboratories Inc.
- bioMerieux SA
- Chembio Diagnostics Inc.
- Danaher Corp.
- DrSafeHands
- F. Hoffmann La Roche Ltd.
- Fujirebio Holdings Inc.
- Healgen Scientific, LLC
- Hologic Inc.
- J. Mitra and Co. Pvt. Ltd.
- MP Biomedicals Inc.
- OraSure Technologies Inc.
第17章 付録
The human immunodeficiency virus (HIV) rapid test kits market is forecasted to grow by USD 338.3 million during 2024-2029, accelerating at a CAGR of 7% during the forecast period. The report on the human immunodeficiency virus (HIV) rapid test kits market provides a holistic analysis, market size and forecast, trends, growth drivers, and challenges, as well as vendor analysis covering around 25 vendors.
The report offers an up-to-date analysis regarding the current market scenario, the latest trends and drivers, and the overall market environment. The market is driven by rise in awareness programs for HIV testing, growing demand for point-of-care testing for HIV, and high prevalence of HIV.
| Market Scope | |
|---|---|
| Base Year | 2025 |
| End Year | 2029 |
| Series Year | 2025-2029 |
| Growth Momentum | Accelerate |
| YOY 2025 | 6% |
| CAGR | 7% |
| Incremental Value | $338.3 mn |
The study was conducted using an objective combination of primary and secondary information including inputs from key participants in the industry. The report contains a comprehensive market size data, segment with regional analysis and vendor landscape in addition to an analysis of the key companies. Reports have historic and forecast data.
Technavio's human immunodeficiency virus (HIV) rapid test kits market is segmented as below:
By Distribution Channel
- Offline
- Online
By Type
- HIV rapid immunoassay test
- HIV rapid molecular diagnostic test
By End-user
- Diagnostic centers
- Hospitals and clinics
By Source
- Blood
- Oral fluids
- Urine
By Geographical Landscape
- North America
- Europe
- Asia
- Rest of World (ROW)
This study identifies the efforts to increase pre-marital screenings for HIV as one of the prime reasons driving the human immunodeficiency virus (HIV) rapid test kits market growth during the next few years. Also, increasing clinical studies by researchers and promotional activities by manufacturers and availability of a broad range of HIV rapid test kits by companies will lead to sizable demand in the market.
The report on the human immunodeficiency virus (HIV) rapid test kits market covers the following areas:
- Human Immunodeficiency Virus (HIV) Rapid Test Kits Market sizing
- Human Immunodeficiency Virus (HIV) Rapid Test Kits Market forecast
- Human Immunodeficiency Virus (HIV) Rapid Test Kits Market industry analysis
The robust vendor analysis is designed to help clients improve their market position, and in line with this, this report provides a detailed analysis of several leading human immunodeficiency virus (HIV) rapid test kits market vendors that include Abbott Laboratories, AccuQuik Test Kits, Amkay Products Pvt. Ltd., Becton Dickinson and Co., Bhat Bio Tech India Pvt Ltd., bioLytical Laboratories Inc., bioMerieux SA, Chembio Diagnostics Inc., Danaher Corp., DrSafeHands, F. Hoffmann La Roche Ltd., Fujirebio Holdings Inc., Healgen Scientific, LLC, Hologic Inc., J. Mitra and Co. Pvt. Ltd., MP Biomedicals Inc., Oragenics Inc., OraSure Technologies Inc., Pathkits, and SHINE SA. Also, the human immunodeficiency virus (HIV) rapid test kits market analysis report includes information on upcoming trends and challenges that will influence market growth. This is to help companies strategize and leverage all forthcoming growth opportunities.
The publisher presents a detailed picture of the market by the way of study, synthesis, and summation of data from multiple sources by an analysis of key parameters such as profit, pricing, competition, and promotions. It presents various market facets by identifying the key industry influencers. The data presented is comprehensive, reliable, and a result of extensive primary and secondary research. The market research reports provide a complete competitive landscape and an in-depth vendor selection methodology and analysis using qualitative and quantitative research to forecast accurate market growth.
Table of Contents
1 Executive Summary
- 1.1 Market overview
- Executive Summary - Chart on Market Overview
- Executive Summary - Data Table on Market Overview
- Executive Summary - Chart on Global Market Characteristics
- Executive Summary - Chart on Market By Geographical Landscape
- Executive Summary - Chart on Market Segmentation by Distribution Channel
- Executive Summary - Chart on Market Segmentation by Type
- Executive Summary - Chart on Market Segmentation by End-user
- Executive Summary - Chart on Market Segmentation by Source
- Executive Summary - Chart on Incremental Growth
- Executive Summary - Data Table on Incremental Growth
- Executive Summary - Chart on Company Market Positioning
2 Technavio Analysis
- 2.1 Analysis of price sensitivity, lifecycle, customer purchase basket, adoption rates, and purchase criteria
- Analysis of price sensitivity, lifecycle, customer purchase basket, adoption rates, and purchase criteria
- 2.2 Criticality of inputs and Factors of differentiation
- Overview on criticality of inputs and factors of differentiation
- 2.3 Factors of disruption
- Overview on factors of disruption
- 2.4 Impact of drivers and challenges
- Impact of drivers and challenges in 2024 and 2029
3 Market Landscape
- 3.1 Market ecosystem
- Parent Market
- Data Table on - Parent Market
- 3.2 Market characteristics
- Market characteristics analysis
- 3.3 Value chain analysis
- Value chain analysis
4 Market Sizing
- 4.1 Market definition
- Offerings of companies included in the market definition
- 4.2 Market segment analysis
- Market segments
- 4.3 Market size 2024
- 4.4 Market outlook: Forecast for 2024-2029
- Chart on Global - Market size and forecast 2024-2029 ($ million)
- Data Table on Global - Market size and forecast 2024-2029 ($ million)
- Chart on Global Market: Year-over-year growth 2024-2029 (%)
- Data Table on Global Market: Year-over-year growth 2024-2029 (%)
5 Historic Market Size
- 5.1 Global Human Immunodeficiency Virus (HIV) Rapid Test Kits Market 2019 - 2023
- Historic Market Size - Data Table on Global Human Immunodeficiency Virus (HIV) Rapid Test Kits Market 2019 - 2023 ($ million)
- 5.2 Distribution Channel segment analysis 2019 - 2023
- Historic Market Size - Distribution Channel Segment 2019 - 2023 ($ million)
- 5.3 Type segment analysis 2019 - 2023
- Historic Market Size - Type Segment 2019 - 2023 ($ million)
- 5.4 End-user segment analysis 2019 - 2023
- Historic Market Size - End-user Segment 2019 - 2023 ($ million)
- 5.5 Source segment analysis 2019 - 2023
- Historic Market Size - Source Segment 2019 - 2023 ($ million)
- 5.6 Geography segment analysis 2019 - 2023
- Historic Market Size - Geography Segment 2019 - 2023 ($ million)
- 5.7 Country segment analysis 2019 - 2023
- Historic Market Size - Country Segment 2019 - 2023 ($ million)
6 Qualitative Analysis
- 6.1 Impact of AI on the global human immunodeficiency virus (HIV) rapid test kits market
7 Five Forces Analysis
- 7.1 Five forces summary
- Five forces analysis - Comparison between 2024 and 2029
- 7.2 Bargaining power of buyers
- Bargaining power of buyers - Impact of key factors 2024 and 2029
- 7.3 Bargaining power of suppliers
- Bargaining power of suppliers - Impact of key factors in 2024 and 2029
- 7.4 Threat of new entrants
- Threat of new entrants - Impact of key factors in 2024 and 2029
- 7.5 Threat of substitutes
- Threat of substitutes - Impact of key factors in 2024 and 2029
- 7.6 Threat of rivalry
- Threat of rivalry - Impact of key factors in 2024 and 2029
- 7.7 Market condition
- Chart on Market condition - Five forces 2024 and 2029
8 Market Segmentation by Distribution Channel
- 8.1 Market segments
- Chart on Distribution Channel - Market share 2024-2029 (%)
- Data Table on Distribution Channel - Market share 2024-2029 (%)
- 8.2 Comparison by Distribution Channel
- Chart on Comparison by Distribution Channel
- Data Table on Comparison by Distribution Channel
- 8.3 Offline - Market size and forecast 2024-2029
- Chart on Offline - Market size and forecast 2024-2029 ($ million)
- Data Table on Offline - Market size and forecast 2024-2029 ($ million)
- Chart on Offline - Year-over-year growth 2024-2029 (%)
- Data Table on Offline - Year-over-year growth 2024-2029 (%)
- 8.4 Online - Market size and forecast 2024-2029
- Chart on Online - Market size and forecast 2024-2029 ($ million)
- Data Table on Online - Market size and forecast 2024-2029 ($ million)
- Chart on Online - Year-over-year growth 2024-2029 (%)
- Data Table on Online - Year-over-year growth 2024-2029 (%)
- 8.5 Market opportunity by Distribution Channel
- Market opportunity by Distribution Channel ($ million)
- Data Table on Market opportunity by Distribution Channel ($ million)
9 Market Segmentation by Type
- 9.1 Market segments
- Chart on Type - Market share 2024-2029 (%)
- Data Table on Type - Market share 2024-2029 (%)
- 9.2 Comparison by Type
- Chart on Comparison by Type
- Data Table on Comparison by Type
- 9.3 HIV rapid immunoassay test - Market size and forecast 2024-2029
- Chart on HIV rapid immunoassay test - Market size and forecast 2024-2029 ($ million)
- Data Table on HIV rapid immunoassay test - Market size and forecast 2024-2029 ($ million)
- Chart on HIV rapid immunoassay test - Year-over-year growth 2024-2029 (%)
- Data Table on HIV rapid immunoassay test - Year-over-year growth 2024-2029 (%)
- 9.4 HIV rapid molecular diagnostic test - Market size and forecast 2024-2029
- Chart on HIV rapid molecular diagnostic test - Market size and forecast 2024-2029 ($ million)
- Data Table on HIV rapid molecular diagnostic test - Market size and forecast 2024-2029 ($ million)
- Chart on HIV rapid molecular diagnostic test - Year-over-year growth 2024-2029 (%)
- Data Table on HIV rapid molecular diagnostic test - Year-over-year growth 2024-2029 (%)
- 9.5 Market opportunity by Type
- Market opportunity by Type ($ million)
- Data Table on Market opportunity by Type ($ million)
10 Market Segmentation by End-user
- 10.1 Market segments
- Chart on End-user - Market share 2024-2029 (%)
- Data Table on End-user - Market share 2024-2029 (%)
- 10.2 Comparison by End-user
- Chart on Comparison by End-user
- Data Table on Comparison by End-user
- 10.3 Diagnostic centers - Market size and forecast 2024-2029
- Chart on Diagnostic centers - Market size and forecast 2024-2029 ($ million)
- Data Table on Diagnostic centers - Market size and forecast 2024-2029 ($ million)
- Chart on Diagnostic centers - Year-over-year growth 2024-2029 (%)
- Data Table on Diagnostic centers - Year-over-year growth 2024-2029 (%)
- 10.4 Hospitals and clinics - Market size and forecast 2024-2029
- Chart on Hospitals and clinics - Market size and forecast 2024-2029 ($ million)
- Data Table on Hospitals and clinics - Market size and forecast 2024-2029 ($ million)
- Chart on Hospitals and clinics - Year-over-year growth 2024-2029 (%)
- Data Table on Hospitals and clinics - Year-over-year growth 2024-2029 (%)
- 10.5 Market opportunity by End-user
- Market opportunity by End-user ($ million)
- Data Table on Market opportunity by End-user ($ million)
11 Market Segmentation by Source
- 11.1 Market segments
- Chart on Source - Market share 2024-2029 (%)
- Data Table on Source - Market share 2024-2029 (%)
- 11.2 Comparison by Source
- Chart on Comparison by Source
- Data Table on Comparison by Source
- 11.3 Blood - Market size and forecast 2024-2029
- Chart on Blood - Market size and forecast 2024-2029 ($ million)
- Data Table on Blood - Market size and forecast 2024-2029 ($ million)
- Chart on Blood - Year-over-year growth 2024-2029 (%)
- Data Table on Blood - Year-over-year growth 2024-2029 (%)
- 11.4 Oral fluids - Market size and forecast 2024-2029
- Chart on Oral fluids - Market size and forecast 2024-2029 ($ million)
- Data Table on Oral fluids - Market size and forecast 2024-2029 ($ million)
- Chart on Oral fluids - Year-over-year growth 2024-2029 (%)
- Data Table on Oral fluids - Year-over-year growth 2024-2029 (%)
- 11.5 Urine - Market size and forecast 2024-2029
- Chart on Urine - Market size and forecast 2024-2029 ($ million)
- Data Table on Urine - Market size and forecast 2024-2029 ($ million)
- Chart on Urine - Year-over-year growth 2024-2029 (%)
- Data Table on Urine - Year-over-year growth 2024-2029 (%)
- 11.6 Market opportunity by Source
- Market opportunity by Source ($ million)
- Data Table on Market opportunity by Source ($ million)
12 Customer Landscape
- 12.1 Customer landscape overview
- Analysis of price sensitivity, lifecycle, customer purchase basket, adoption rates, and purchase criteria
13 Geographic Landscape
- 13.1 Geographic segmentation
- Chart on Market share By Geographical Landscape 2024-2029 (%)
- Data Table on Market share By Geographical Landscape 2024-2029 (%)
- 13.2 Geographic comparison
- Chart on Geographic comparison
- Data Table on Geographic comparison
- 13.3 North America - Market size and forecast 2024-2029
- Chart on North America - Market size and forecast 2024-2029 ($ million)
- Data Table on North America - Market size and forecast 2024-2029 ($ million)
- Chart on North America - Year-over-year growth 2024-2029 (%)
- Data Table on North America - Year-over-year growth 2024-2029 (%)
- 13.4 Europe - Market size and forecast 2024-2029
- Chart on Europe - Market size and forecast 2024-2029 ($ million)
- Data Table on Europe - Market size and forecast 2024-2029 ($ million)
- Chart on Europe - Year-over-year growth 2024-2029 (%)
- Data Table on Europe - Year-over-year growth 2024-2029 (%)
- 13.5 Asia - Market size and forecast 2024-2029
- Chart on Asia - Market size and forecast 2024-2029 ($ million)
- Data Table on Asia - Market size and forecast 2024-2029 ($ million)
- Chart on Asia - Year-over-year growth 2024-2029 (%)
- Data Table on Asia - Year-over-year growth 2024-2029 (%)
- 13.6 Rest of World (ROW) - Market size and forecast 2024-2029
- Chart on Rest of World (ROW) - Market size and forecast 2024-2029 ($ million)
- Data Table on Rest of World (ROW) - Market size and forecast 2024-2029 ($ million)
- Chart on Rest of World (ROW) - Year-over-year growth 2024-2029 (%)
- Data Table on Rest of World (ROW) - Year-over-year growth 2024-2029 (%)
- 13.7 US - Market size and forecast 2024-2029
- Chart on US - Market size and forecast 2024-2029 ($ million)
- Data Table on US - Market size and forecast 2024-2029 ($ million)
- Chart on US - Year-over-year growth 2024-2029 (%)
- Data Table on US - Year-over-year growth 2024-2029 (%)
- 13.8 Canada - Market size and forecast 2024-2029
- Chart on Canada - Market size and forecast 2024-2029 ($ million)
- Data Table on Canada - Market size and forecast 2024-2029 ($ million)
- Chart on Canada - Year-over-year growth 2024-2029 (%)
- Data Table on Canada - Year-over-year growth 2024-2029 (%)
- 13.9 China - Market size and forecast 2024-2029
- Chart on China - Market size and forecast 2024-2029 ($ million)
- Data Table on China - Market size and forecast 2024-2029 ($ million)
- Chart on China - Year-over-year growth 2024-2029 (%)
- Data Table on China - Year-over-year growth 2024-2029 (%)
- 13.10 UK - Market size and forecast 2024-2029
- Chart on UK - Market size and forecast 2024-2029 ($ million)
- Data Table on UK - Market size and forecast 2024-2029 ($ million)
- Chart on UK - Year-over-year growth 2024-2029 (%)
- Data Table on UK - Year-over-year growth 2024-2029 (%)
- 13.11 Japan - Market size and forecast 2024-2029
- Chart on Japan - Market size and forecast 2024-2029 ($ million)
- Data Table on Japan - Market size and forecast 2024-2029 ($ million)
- Chart on Japan - Year-over-year growth 2024-2029 (%)
- Data Table on Japan - Year-over-year growth 2024-2029 (%)
- 13.12 Germany - Market size and forecast 2024-2029
- Chart on Germany - Market size and forecast 2024-2029 ($ million)
- Data Table on Germany - Market size and forecast 2024-2029 ($ million)
- Chart on Germany - Year-over-year growth 2024-2029 (%)
- Data Table on Germany - Year-over-year growth 2024-2029 (%)
- 13.13 India - Market size and forecast 2024-2029
- Chart on India - Market size and forecast 2024-2029 ($ million)
- Data Table on India - Market size and forecast 2024-2029 ($ million)
- Chart on India - Year-over-year growth 2024-2029 (%)
- Data Table on India - Year-over-year growth 2024-2029 (%)
- 13.14 France - Market size and forecast 2024-2029
- Chart on France - Market size and forecast 2024-2029 ($ million)
- Data Table on France - Market size and forecast 2024-2029 ($ million)
- Chart on France - Year-over-year growth 2024-2029 (%)
- Data Table on France - Year-over-year growth 2024-2029 (%)
- 13.15 Italy - Market size and forecast 2024-2029
- Chart on Italy - Market size and forecast 2024-2029 ($ million)
- Data Table on Italy - Market size and forecast 2024-2029 ($ million)
- Chart on Italy - Year-over-year growth 2024-2029 (%)
- Data Table on Italy - Year-over-year growth 2024-2029 (%)
- 13.16 South Korea - Market size and forecast 2024-2029
- Chart on South Korea - Market size and forecast 2024-2029 ($ million)
- Data Table on South Korea - Market size and forecast 2024-2029 ($ million)
- Chart on South Korea - Year-over-year growth 2024-2029 (%)
- Data Table on South Korea - Year-over-year growth 2024-2029 (%)
- 13.17 Market opportunity By Geographical Landscape
- Market opportunity By Geographical Landscape ($ million)
- Data Tables on Market opportunity By Geographical Landscape ($ million)
14 Drivers, Challenges, and Opportunity/Restraints
- 14.1 Market drivers
- 14.2 Market challenges
- 14.3 Impact of drivers and challenges
- Impact of drivers and challenges in 2024 and 2029
- 14.4 Market opportunities/restraints
15 Competitive Landscape
- 15.1 Overview
- 15.2 Competitive Landscape
- Overview on criticality of inputs and factors of differentiation
- 15.3 Landscape disruption
- Overview on factors of disruption
- 15.4 Industry risks
- Impact of key risks on business
16 Competitive Analysis
- 16.1 Companies profiled
- Companies covered
- 16.2 Company ranking index
- Company ranking index
- 16.3 Market positioning of companies
- Matrix on companies position and classification
- 16.4 Abbott Laboratories
- Abbott Laboratories - Overview
- Abbott Laboratories - Business segments
- Abbott Laboratories - Key news
- Abbott Laboratories - Key offerings
- Abbott Laboratories - Segment focus
- SWOT
- 16.5 AccuQuik Test Kits
- AccuQuik Test Kits - Overview
- AccuQuik Test Kits - Product / Service
- AccuQuik Test Kits - Key offerings
- SWOT
- 16.6 Becton Dickinson and Co.
- Becton Dickinson and Co. - Overview
- Becton Dickinson and Co. - Business segments
- Becton Dickinson and Co. - Key news
- Becton Dickinson and Co. - Key offerings
- Becton Dickinson and Co. - Segment focus
- SWOT
- 16.7 bioLytical Laboratories Inc.
- bioLytical Laboratories Inc. - Overview
- bioLytical Laboratories Inc. - Product / Service
- bioLytical Laboratories Inc. - Key offerings
- SWOT
- 16.8 bioMerieux SA
- bioMerieux SA - Overview
- bioMerieux SA - Product / Service
- bioMerieux SA - Key offerings
- SWOT
- 16.9 Chembio Diagnostics Inc.
- Chembio Diagnostics Inc. - Overview
- Chembio Diagnostics Inc. - Product / Service
- Chembio Diagnostics Inc. - Key news
- Chembio Diagnostics Inc. - Key offerings
- SWOT
- 16.10 Danaher Corp.
- Danaher Corp. - Overview
- Danaher Corp. - Business segments
- Danaher Corp. - Key news
- Danaher Corp. - Key offerings
- Danaher Corp. - Segment focus
- SWOT
- 16.11 DrSafeHands
- DrSafeHands - Overview
- DrSafeHands - Product / Service
- DrSafeHands - Key offerings
- SWOT
- 16.12 F. Hoffmann La Roche Ltd.
- F. Hoffmann La Roche Ltd. - Overview
- F. Hoffmann La Roche Ltd. - Business segments
- F. Hoffmann La Roche Ltd. - Key news
- F. Hoffmann La Roche Ltd. - Key offerings
- F. Hoffmann La Roche Ltd. - Segment focus
- SWOT
- 16.13 Fujirebio Holdings Inc.
- Fujirebio Holdings Inc. - Overview
- Fujirebio Holdings Inc. - Product / Service
- Fujirebio Holdings Inc. - Key offerings
- SWOT
- 16.14 Healgen Scientific, LLC
- Healgen Scientific, LLC - Overview
- Healgen Scientific, LLC - Product / Service
- Healgen Scientific, LLC - Key offerings
- SWOT
- 16.15 Hologic Inc.
- Hologic Inc. - Overview
- Hologic Inc. - Business segments
- Hologic Inc. - Key news
- Hologic Inc. - Key offerings
- Hologic Inc. - Segment focus
- SWOT
- 16.16 J. Mitra and Co. Pvt. Ltd.
- J. Mitra and Co. Pvt. Ltd. - Overview
- J. Mitra and Co. Pvt. Ltd. - Product / Service
- J. Mitra and Co. Pvt. Ltd. - Key offerings
- SWOT
- 16.17 MP Biomedicals Inc.
- MP Biomedicals Inc. - Overview
- MP Biomedicals Inc. - Product / Service
- MP Biomedicals Inc. - Key offerings
- SWOT
- 16.18 OraSure Technologies Inc.
- OraSure Technologies Inc. - Overview
- OraSure Technologies Inc. - Business segments
- OraSure Technologies Inc. - Key news
- OraSure Technologies Inc. - Key offerings
- OraSure Technologies Inc. - Segment focus
- SWOT
17 Appendix
- 17.1 Scope of the report
- 17.2 Inclusions and exclusions checklist
- Inclusions checklist
- Exclusions checklist
- 17.3 Currency conversion rates for US$
- Currency conversion rates for US$
- 17.4 Research methodology
- Research methodology
- 17.5 Data procurement
- Information sources
- 17.6 Data validation
- Data validation
- 17.7 Validation techniques employed for market sizing
- Validation techniques employed for market sizing
- 17.8 Data synthesis
- Data synthesis
- 17.9 360 degree market analysis
- 360 degree market analysis
- 17.10 List of abbreviations
- List of abbreviations
