|
|
市場調査レポート
商品コード
2030496
ガスマスクの世界市場 2026年~2030年Global Gas Masks Market 2026-2030 |
||||||
|
|||||||
カスタマイズ可能
|
|||||||

| ガスマスクの世界市場 2026年~2030年 |
|
出版日: 2026年05月03日
発行: TechNavio
ページ情報: 英文 306 Pages
納期: 即納可能
|

概要
世界のガスマスク市場は、2025年から2030年にかけて67億5,500万米ドル成長し、予測期間中のCAGRは10.9%になると予測されています。
本レポートでは、世界のガスマスク市場について、包括的な分析、市場規模と予測、動向、成長要因、課題に加え、約25社のベンダーを網羅したベンダー分析を提供しています。
本レポートでは、現在の市場状況、最新の市場動向と促進要因、および市場環境全体に関する最新の分析を提供しています。この市場は、厳格な労働安全衛生規制や企業の社会的責任の高まり、地政学的不安定性の増大や防衛分野の近代化、新興国における工業化の加速、そして大気汚染問題の深刻化によって牽引されています。
本調査は、業界の主要関係者からの意見を含む一次情報と二次情報を客観的に組み合わせて実施されました。本レポートには、主要企業の分析に加え、包括的な市場規模データ、地域別分析を伴うセグメント、およびベンダー情勢が含まれています。レポートには、過去データと予測データが掲載されています。
| 市場の範囲 | |
|---|---|
| 基準年 | 2025年 |
| 終了年 | 2030年 |
| 調査期間 | 2026年~2030年 |
| 成長モメンタム | 加速 |
| 2026年比 | 9.8% |
| CAGR | 10.9% |
| 増分額 | 67億5,500万米ドル |
本調査では、高度なエレクトロニクス技術とスマートシステム機能の統合が、今後数年間における世界のガスマスク市場の成長を牽引する主な要因の一つであると特定しています。また、人間工学やユーザー中心設計への注力、ならびにろ過材や多脅威対策技術の進歩により、市場では相当な需要が見込まれます。
目次
第1章 エグゼクティブサマリー
第2章 Technavio分析
- 価格・ライフサイクル・顧客購入バスケット・採用率・購入基準の分析
- インプットの重要性と差別化の要因
- ディスラプション要因
- 促進要因と課題の影響
第3章 市場情勢
- 市場エコシステム
- 市場の特徴
- バリューチェーン分析
第4章 市場規模
- 市場の定義
- 市場セグメント分析
- 市場規模、2025年
- 市場の見通し、2025年-2030年
第5章 市場規模実績
- 世界のガスマスクの世界市場、2020年-2024年
- 用途別セグメント分析、2020年-2024年
- タイプ別セグメント分析、2020年-2024年
- 製品タイプ別セグメント分析、2020年-2024年
- 地域別セグメント分析、2020年-2024年
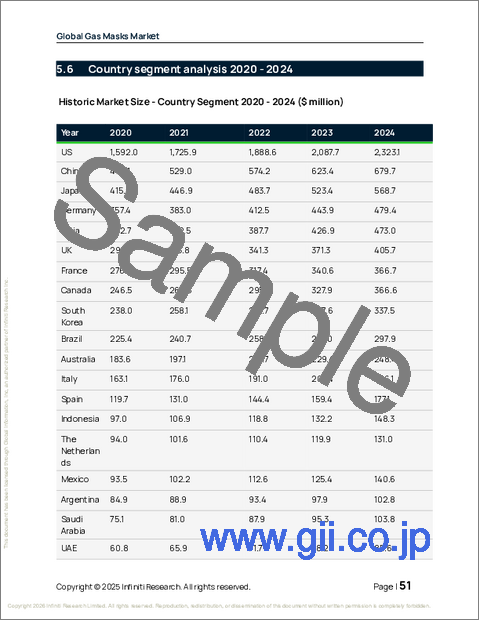
- 国別セグメント分析、2020年-2024年
第6章 定性分析
- AIの影響:世界のガスマスクの世界市場
- 地政学的紛争が及ぼす影響:世界のガスマスクの世界市場
第7章 ファイブフォース分析
第8章 市場セグメンテーション:用途別
- 比較:用途別
- 化学工業
- 石油・ガス
- 鉱業
- ヘルスケア
- その他
- 市場機会:用途別
第9章 市場セグメンテーション:タイプ別
- 比較:タイプ別
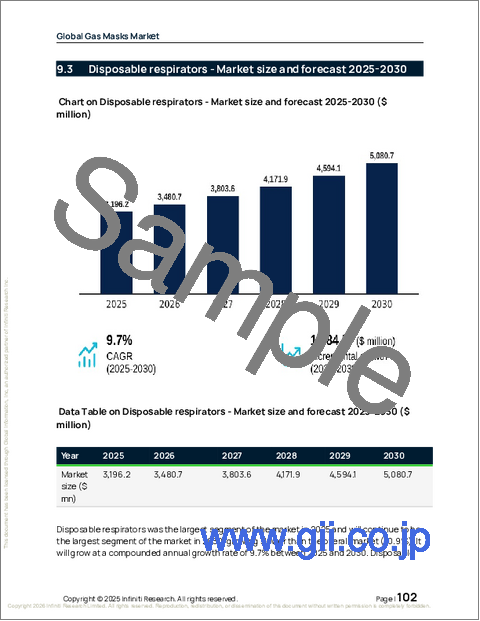
- 使い捨て呼吸用保護具
- 電動式空気浄化呼吸用保護具
- 送風式呼吸用保護具
- 自給式呼吸器
- 市場機会:タイプ別
第10章 市場セグメンテーション:製品タイプ別
- 比較:製品タイプ別
- フルフェイスピースガスマスク
- ハーフフェイスピースガスマスク
- 市場機会:製品タイプ別
第11章 顧客情勢
第12章 地域別情勢
- 地域別セグメンテーション
- 地域別比較
- 北米
- 米国
- カナダ
- メキシコ
- アジア太平洋
- 中国
- 日本
- インド
- 韓国
- オーストラリア
- インドネシア
- 欧州
- ドイツ
- 英国
- フランス
- イタリア
- スペイン
- オランダ
- 南アメリカ
- ブラジル
- アルゼンチン
- チリ
- 中東・アフリカ
- サウジアラビア
- UAE
- 南アフリカ
- イスラエル
- トルコ
- 市場機会:地域別
第13章 促進要因・課題・機会
- 市場促進要因
- 市場の課題
- 促進要因と課題の影響
- 市場機会
第14章 競合情勢
- 概要
- 競合情勢
- ディスラプション情勢
- 業界のリスク
第15章 競合分析
- 企業プロファイル
- 企業ランキング指標
- 企業の市場ポジショニング
- 3M Co.
- AirBoss of America Corp.
- Avon Polymer Products Ltd.
- CleanSpace Technology Pty Ltd.
- Delta Plus Group SA
- Dragerwerk AG and Co. KGaA
- Gentex Corp.
- Honeywell International Inc.
- ILC Dover LP
- JSP Ltd.
- Moldex Metric
- MSA Safety Inc.
- SHIGEMATSU WORKS CO. LTD.
- Sundstrom Safety AB
- Trelleborg AB
