|
|
市場調査レポート
商品コード
1681170
解剖学的病理追跡ソリューションの世界市場 2025~2029年Global Anatomic Pathology Track and Trace Solutions Market 2025-2029 |
||||||

|
|||||||
カスタマイズ可能
|
|||||||


| 解剖学的病理追跡ソリューションの世界市場 2025~2029年 |
|
出版日: 2025年02月28日
発行: TechNavio
ページ情報: 英文 233 Pages
納期: 即納可能
|

全表示
- 概要
- 目次
解剖学的病理追跡ソリューション市場は2024~2029年に17億9,460万米ドル、予測期間中のCAGRは23.1%で成長すると予測されます。
当レポートでは、解剖学的病理追跡ソリューション市場の全体的な分析、市場規模・予測、動向、成長促進要因、課題、約25のベンダーを網羅したベンダー分析などを掲載しています。
現在の市場シナリオ、最新動向と促進要因、市場環境全体に関する最新分析を提供しています。同市場は、検査室における自動化システムの採用拡大、タイムリーな疾患診断に対する需要の高まり、解剖学的病理追跡における人為的ミスの頻度の高さによって牽引されています。
| 市場範囲 | |
|---|---|
| 基準年 | 2025年 |
| 終了年 | 2029年 |
| 予測期間 | 2025~2029年 |
| 成長モメンタム | 加速 |
| 前年比2025年 | 18.2% |
| CAGR | 23.1% |
| 増分額 | 17億9,460万米ドル |
本調査は、業界の主要参加者からのインプットを含め、一次情報と二次情報を客観的に組み合わせて実施しました。レポートには、主要企業の分析に加え、包括的な市場規模データ、地域分析によるセグメント、ベンダー情勢が含まれています。レポートには過去データと予測データがあります。
本調査では、ヘルスケアのデジタル化が今後数年間の解剖学的病理追跡ソリューション市場の成長を促進する主要因の1つであると指摘しています。また、解剖学的病理追跡ソリューションへのAIの統合やヘルスケア産業への投資の増加は、市場の大きな需要につながるでしょう。
目次
第1章 エグゼクティブサマリー
- 市場概要
第2章 Technavio分析
- 価格・ライフサイクル・顧客購入バスケット・採用率・購入基準の分析
- インプットの重要性と差別化の要因
- 混乱の要因
- 促進要因と課題の影響
第3章 市場情勢
- 市場エコシステム
- 市場の特徴
- バリューチェーン分析
第4章 市場規模
- 市場の定義
- 市場セグメント分析
- 市場規模 2024年
- 市場展望 2024~2029年
第5章 市場規模実績
- 解剖学的病理追跡ソリューションの世界市場 2019~2023年
- エンドユーザー別セグメント分析 2019~2023年
- 技術別セグメント分析 2019~2023年
- 製品別セグメント分析 2019~2023年
- 用途別セグメント分析 2019~2023年
- 地域別セグメント分析 2019~2023年
- 国別セグメント分析 2019~2023年
第6章 定性分析
- AIの影響:解剖学的病理追跡ソリューションの世界市場
第7章 ファイブフォース分析
- ファイブフォースの要約
- 買い手の交渉力
- 供給企業の交渉力
- 新規参入業者の脅威
- 代替品の脅威
- 競争の脅威
- 市況
第8章 市場セグメンテーション:エンドユーザー別
- 市場セグメント
- 比較:エンドユーザー別
- 病院検査室:市場規模と予測 2024~2029年
- 独立系・レファレンス検査室:市場規模と予測 2024~2029年
- その他:市場規模と予測 2024~2029年
- 市場機会:エンドユーザー別
第9章 市場セグメンテーション:技術別
- 市場セグメント
- 比較:技術別
- バーコード:市場規模と予測 2024~2029年
- RFID:市場規模と予測 2024~2029年
- 市場機会:技術別
第10章 市場セグメンテーション:製品別
- 市場セグメント
- 比較:製品別
- ソフトウェア:市場規模と予測 2024~2029年
- ハードウェア:市場規模と予測 2024~2029年
- 消耗品:市場規模と予測 2024~2029年
- 市場機会:製品別
第11章 市場セグメンテーション:用途別
- 市場セグメント
- 比較:用途別
- スライド追跡:市場規模と予測 2024~2029年
- 組織カセット・ブロック追跡:市場規模と予測 2024~2029年
- 標本追跡:市場規模と予測 2024~2029年
- 市場機会:用途別
第12章 顧客情勢
- 顧客情勢の概要
第13章 地域別情勢
- 地域別セグメンテーション
- 地域別比較
- 北米:市場規模と予測 2024~2029年
- 欧州:市場規模と予測 2024~2029年
- アジア:市場規模と予測 2024~2029年
- 世界のその他の地域:市場規模と予測 2024~2029年
- 米国:市場規模と予測 2024~2029年
- カナダ:市場規模と予測 2024~2029年
- 中国:市場規模と予測 2024~2029年
- ドイツ:市場規模と予測 2024~2029年
- 英国:市場規模と予測 2024~2029年
- インド:市場規模と予測 2024~2029年
- 日本:市場規模と予測 2024~2029年
- フランス:市場規模と予測 2024~2029年
- イタリア:市場規模と予測 2024~2029年
- ブラジル:市場規模と予測 2024~2029年
- 市場機会:地域情勢別
第14章 促進要因・課題・機会・抑制要因
- 市場促進要因
- 市場の課題
- 促進要因と課題の影響
- 市場の機会・抑制要因
第15章 競合情勢
- 概要
- 競合情勢
- 混乱の状況
- 業界のリスク
第16章 競合分析
- 企業プロファイル
- 企業ランキング指数
- 企業の市場ポジショニング
- Agilent Technologies Inc.
- Cirdan
- Clinisys Inc
- CompuGroup Medical SE and Co. KGaA
- Danaher Corp.
- F. Hoffmann La Roche Ltd.
- Mikroscan Technologies Inc.
- PHC Holdings Corp.
- Powered Milestone Srl
- Psyche Systems Corp.
- Sakura Finetek
- Siemens Healthineers AG
- Visiopharm AS
- Voicebrook Inc.
- XIFIN Inc.
第17章 付録
The anatomic pathology track and trace solutions market is forecasted to grow by USD 1794.6 million during 2024-2029, accelerating at a CAGR of 23.1% during the forecast period. The report on the anatomic pathology track and trace solutions market provides a holistic analysis, market size and forecast, trends, growth drivers, and challenges, as well as vendor analysis covering around 25 vendors.
The report offers an up-to-date analysis regarding the current market scenario, the latest trends and drivers, and the overall market environment. The market is driven by growing adoption of automated systems in laboratories, rising demand for timely disease diagnosis, and high frequency of human errors in anatomic pathology tracking and tracing.
| Market Scope | |
|---|---|
| Base Year | 2025 |
| End Year | 2029 |
| Series Year | 2025-2029 |
| Growth Momentum | Accelerate |
| YOY 2025 | 18.2% |
| CAGR | 23.1% |
| Incremental Value | $1794.6 mn |
The study was conducted using an objective combination of primary and secondary information including inputs from key participants in the industry. The report contains a comprehensive market size data, segment with regional analysis and vendor landscape in addition to an analysis of the key companies. Reports have historic and forecast data.
Technavio's anatomic pathology track and trace solutions market is segmented as below:
By End-user
- Hospital laboratories
- Independent and reference laboratories
- Others
By Technology
- Barcode
- RFID
By Product
- Software
- Hardware
- Consumables
By Application
- Slides tracking
- Tissue cassettes and blocks tracking
- Specimen tracking
By Geographical Landscape
- North America
- Europe
- Asia
- Rest of World (ROW)
This study identifies the digitization of healthcare as one of the prime reasons driving the anatomic pathology track and trace solutions market growth during the next few years. Also, integration of artificial intelligence into anatomic pathology track and trace solutions and increasing investments in healthcare industry will lead to sizable demand in the market.
The report on the anatomic pathology track and trace solutions market covers the following areas:
- Anatomic Pathology Track And Trace Solutions Market sizing
- Anatomic Pathology Track And Trace Solutions Market forecast
- Anatomic Pathology Track And Trace Solutions Market industry analysis
The robust vendor analysis is designed to help clients improve their market position, and in line with this, this report provides a detailed analysis of several leading anatomic pathology track and trace solutions market vendors that include Agilent Technologies Inc., Cirdan, Clinisys Inc, CompuGroup Medical SE and Co. KGaA, Danaher Corp., F. Hoffmann La Roche Ltd., Indica Labs Inc., LigoLab Information Systems, Mikroscan Technologies Inc., Pathcore Inc., PHC Holdings Corp., Powered Milestone Srl, Proscia Inc., Psyche Systems Corp., Sakura Finetek, Siemens Healthineers AG, Visiopharm AS, Voicebrook Inc., and XIFIN Inc.. Also, the anatomic pathology track and trace solutions market analysis report includes information on upcoming trends and challenges that will influence market growth. This is to help companies strategize and leverage all forthcoming growth opportunities.
The publisher presents a detailed picture of the market by the way of study, synthesis, and summation of data from multiple sources by an analysis of key parameters such as profit, pricing, competition, and promotions. It presents various market facets by identifying the key industry influencers. The data presented is comprehensive, reliable, and a result of extensive primary and secondary research. The market research reports provide a complete competitive landscape and an in-depth vendor selection methodology and analysis using qualitative and quantitative research to forecast accurate market growth.
Table of Contents
1 Executive Summary
- 1.1 Market overview
- Executive Summary - Chart on Market Overview
- Executive Summary - Data Table on Market Overview
- Executive Summary - Chart on Global Market Characteristics
- Executive Summary - Chart on Market By Geographical Landscape
- Executive Summary - Chart on Market Segmentation by End-user
- Executive Summary - Chart on Market Segmentation by Technology
- Executive Summary - Chart on Market Segmentation by Product
- Executive Summary - Chart on Market Segmentation by Application
- Executive Summary - Chart on Incremental Growth
- Executive Summary - Data Table on Incremental Growth
- Executive Summary - Chart on Company Market Positioning
2 Technavio Analysis
- 2.1 Analysis of price sensitivity, lifecycle, customer purchase basket, adoption rates, and purchase criteria
- Analysis of price sensitivity, lifecycle, customer purchase basket, adoption rates, and purchase criteria
- 2.2 Criticality of inputs and Factors of differentiation
- Overview on criticality of inputs and factors of differentiation
- 2.3 Factors of disruption
- Overview on factors of disruption
- 2.4 Impact of drivers and challenges
- Impact of drivers and challenges in 2024 and 2029
3 Market Landscape
- 3.1 Market ecosystem
- Parent Market
- Data Table on - Parent Market
- 3.2 Market characteristics
- Market characteristics analysis
- 3.3 Value chain analysis
- Value chain analysis
4 Market Sizing
- 4.1 Market definition
- Offerings of companies included in the market definition
- 4.2 Market segment analysis
- Market segments
- 4.3 Market size 2024
- 4.4 Market outlook: Forecast for 2024-2029
- Chart on Global - Market size and forecast 2024-2029 ($ million)
- Data Table on Global - Market size and forecast 2024-2029 ($ million)
- Chart on Global Market: Year-over-year growth 2024-2029 (%)
- Data Table on Global Market: Year-over-year growth 2024-2029 (%)
5 Historic Market Size
- 5.1 Global Anatomic Pathology Track And Trace Solutions Market 2019 - 2023
- Historic Market Size - Data Table on Global Anatomic Pathology Track And Trace Solutions Market 2019 - 2023 ($ million)
- 5.2 End-user segment analysis 2019 - 2023
- Historic Market Size - End-user Segment 2019 - 2023 ($ million)
- 5.3 Technology segment analysis 2019 - 2023
- Historic Market Size - Technology Segment 2019 - 2023 ($ million)
- 5.4 Product segment analysis 2019 - 2023
- Historic Market Size - Product Segment 2019 - 2023 ($ million)
- 5.5 Application segment analysis 2019 - 2023
- Historic Market Size - Application Segment 2019 - 2023 ($ million)
- 5.6 Geography segment analysis 2019 - 2023
- Historic Market Size - Geography Segment 2019 - 2023 ($ million)
- 5.7 Country segment analysis 2019 - 2023
- Historic Market Size - Country Segment 2019 - 2023 ($ million)
6 Qualitative Analysis
- 6.1 The AI impact on global anatomic pathology track and trace solutions market
7 Five Forces Analysis
- 7.1 Five forces summary
- Five forces analysis - Comparison between 2024 and 2029
- 7.2 Bargaining power of buyers
- Bargaining power of buyers - Impact of key factors 2024 and 2029
- 7.3 Bargaining power of suppliers
- Bargaining power of suppliers - Impact of key factors in 2024 and 2029
- 7.4 Threat of new entrants
- Threat of new entrants - Impact of key factors in 2024 and 2029
- 7.5 Threat of substitutes
- Threat of substitutes - Impact of key factors in 2024 and 2029
- 7.6 Threat of rivalry
- Threat of rivalry - Impact of key factors in 2024 and 2029
- 7.7 Market condition
- Chart on Market condition - Five forces 2024 and 2029
8 Market Segmentation by End-user
- 8.1 Market segments
- Chart on End-user - Market share 2024-2029 (%)
- Data Table on End-user - Market share 2024-2029 (%)
- 8.2 Comparison by End-user
- Chart on Comparison by End-user
- Data Table on Comparison by End-user
- 8.3 Hospital laboratories - Market size and forecast 2024-2029
- Chart on Hospital laboratories - Market size and forecast 2024-2029 ($ million)
- Data Table on Hospital laboratories - Market size and forecast 2024-2029 ($ million)
- Chart on Hospital laboratories - Year-over-year growth 2024-2029 (%)
- Data Table on Hospital laboratories - Year-over-year growth 2024-2029 (%)
- 8.4 Independent and reference laboratories - Market size and forecast 2024-2029
- Chart on Independent and reference laboratories - Market size and forecast 2024-2029 ($ million)
- Data Table on Independent and reference laboratories - Market size and forecast 2024-2029 ($ million)
- Chart on Independent and reference laboratories - Year-over-year growth 2024-2029 (%)
- Data Table on Independent and reference laboratories - Year-over-year growth 2024-2029 (%)
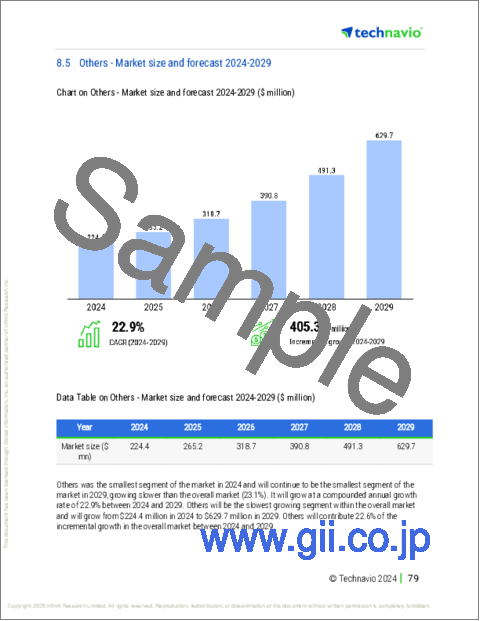
- 8.5 Others - Market size and forecast 2024-2029
- Chart on Others - Market size and forecast 2024-2029 ($ million)
- Data Table on Others - Market size and forecast 2024-2029 ($ million)
- Chart on Others - Year-over-year growth 2024-2029 (%)
- Data Table on Others - Year-over-year growth 2024-2029 (%)
- 8.6 Market opportunity by End-user
- Market opportunity by End-user ($ million)
- Data Table on Market opportunity by End-user ($ million)
9 Market Segmentation by Technology
- 9.1 Market segments
- Chart on Technology - Market share 2024-2029 (%)
- Data Table on Technology - Market share 2024-2029 (%)
- 9.2 Comparison by Technology
- Chart on Comparison by Technology
- Data Table on Comparison by Technology
- 9.3 Barcode - Market size and forecast 2024-2029
- Chart on Barcode - Market size and forecast 2024-2029 ($ million)
- Data Table on Barcode - Market size and forecast 2024-2029 ($ million)
- Chart on Barcode - Year-over-year growth 2024-2029 (%)
- Data Table on Barcode - Year-over-year growth 2024-2029 (%)
- 9.4 RFID - Market size and forecast 2024-2029
- Chart on RFID - Market size and forecast 2024-2029 ($ million)
- Data Table on RFID - Market size and forecast 2024-2029 ($ million)
- Chart on RFID - Year-over-year growth 2024-2029 (%)
- Data Table on RFID - Year-over-year growth 2024-2029 (%)
- 9.5 Market opportunity by Technology
- Market opportunity by Technology ($ million)
- Data Table on Market opportunity by Technology ($ million)
10 Market Segmentation by Product
- 10.1 Market segments
- Chart on Product - Market share 2024-2029 (%)
- Data Table on Product - Market share 2024-2029 (%)
- 10.2 Comparison by Product
- Chart on Comparison by Product
- Data Table on Comparison by Product
- 10.3 Software - Market size and forecast 2024-2029
- Chart on Software - Market size and forecast 2024-2029 ($ million)
- Data Table on Software - Market size and forecast 2024-2029 ($ million)
- Chart on Software - Year-over-year growth 2024-2029 (%)
- Data Table on Software - Year-over-year growth 2024-2029 (%)
- 10.4 Hardware - Market size and forecast 2024-2029
- Chart on Hardware - Market size and forecast 2024-2029 ($ million)
- Data Table on Hardware - Market size and forecast 2024-2029 ($ million)
- Chart on Hardware - Year-over-year growth 2024-2029 (%)
- Data Table on Hardware - Year-over-year growth 2024-2029 (%)
- 10.5 Consumables - Market size and forecast 2024-2029
- Chart on Consumables - Market size and forecast 2024-2029 ($ million)
- Data Table on Consumables - Market size and forecast 2024-2029 ($ million)
- Chart on Consumables - Year-over-year growth 2024-2029 (%)
- Data Table on Consumables - Year-over-year growth 2024-2029 (%)
- 10.6 Market opportunity by Product
- Market opportunity by Product ($ million)
- Data Table on Market opportunity by Product ($ million)
11 Market Segmentation by Application
- 11.1 Market segments
- Chart on Application - Market share 2024-2029 (%)
- Data Table on Application - Market share 2024-2029 (%)
- 11.2 Comparison by Application
- Chart on Comparison by Application
- Data Table on Comparison by Application
- 11.3 Slides tracking - Market size and forecast 2024-2029
- Chart on Slides tracking - Market size and forecast 2024-2029 ($ million)
- Data Table on Slides tracking - Market size and forecast 2024-2029 ($ million)
- Chart on Slides tracking - Year-over-year growth 2024-2029 (%)
- Data Table on Slides tracking - Year-over-year growth 2024-2029 (%)
- 11.4 Tissue cassettes and blocks tracking - Market size and forecast 2024-2029
- Chart on Tissue cassettes and blocks tracking - Market size and forecast 2024-2029 ($ million)
- Data Table on Tissue cassettes and blocks tracking - Market size and forecast 2024-2029 ($ million)
- Chart on Tissue cassettes and blocks tracking - Year-over-year growth 2024-2029 (%)
- Data Table on Tissue cassettes and blocks tracking - Year-over-year growth 2024-2029 (%)
- 11.5 Specimen tracking - Market size and forecast 2024-2029
- Chart on Specimen tracking - Market size and forecast 2024-2029 ($ million)
- Data Table on Specimen tracking - Market size and forecast 2024-2029 ($ million)
- Chart on Specimen tracking - Year-over-year growth 2024-2029 (%)
- Data Table on Specimen tracking - Year-over-year growth 2024-2029 (%)
- 11.6 Market opportunity by Application
- Market opportunity by Application ($ million)
- Data Table on Market opportunity by Application ($ million)
12 Customer Landscape
- 12.1 Customer landscape overview
- Analysis of price sensitivity, lifecycle, customer purchase basket, adoption rates, and purchase criteria
13 Geographic Landscape
- 13.1 Geographic segmentation
- Chart on Market share By Geographical Landscape 2024-2029 (%)
- Data Table on Market share By Geographical Landscape 2024-2029 (%)
- 13.2 Geographic comparison
- Chart on Geographic comparison
- Data Table on Geographic comparison
- 13.3 North America - Market size and forecast 2024-2029
- Chart on North America - Market size and forecast 2024-2029 ($ million)
- Data Table on North America - Market size and forecast 2024-2029 ($ million)
- Chart on North America - Year-over-year growth 2024-2029 (%)
- Data Table on North America - Year-over-year growth 2024-2029 (%)
- 13.4 Europe - Market size and forecast 2024-2029
- Chart on Europe - Market size and forecast 2024-2029 ($ million)
- Data Table on Europe - Market size and forecast 2024-2029 ($ million)
- Chart on Europe - Year-over-year growth 2024-2029 (%)
- Data Table on Europe - Year-over-year growth 2024-2029 (%)
- 13.5 Asia - Market size and forecast 2024-2029
- Chart on Asia - Market size and forecast 2024-2029 ($ million)
- Data Table on Asia - Market size and forecast 2024-2029 ($ million)
- Chart on Asia - Year-over-year growth 2024-2029 (%)
- Data Table on Asia - Year-over-year growth 2024-2029 (%)
- 13.6 Rest of World (ROW) - Market size and forecast 2024-2029
- Chart on Rest of World (ROW) - Market size and forecast 2024-2029 ($ million)
- Data Table on Rest of World (ROW) - Market size and forecast 2024-2029 ($ million)
- Chart on Rest of World (ROW) - Year-over-year growth 2024-2029 (%)
- Data Table on Rest of World (ROW) - Year-over-year growth 2024-2029 (%)
- 13.7 US - Market size and forecast 2024-2029
- Chart on US - Market size and forecast 2024-2029 ($ million)
- Data Table on US - Market size and forecast 2024-2029 ($ million)
- Chart on US - Year-over-year growth 2024-2029 (%)
- Data Table on US - Year-over-year growth 2024-2029 (%)
- 13.8 Canada - Market size and forecast 2024-2029
- Chart on Canada - Market size and forecast 2024-2029 ($ million)
- Data Table on Canada - Market size and forecast 2024-2029 ($ million)
- Chart on Canada - Year-over-year growth 2024-2029 (%)
- Data Table on Canada - Year-over-year growth 2024-2029 (%)
- 13.9 China - Market size and forecast 2024-2029
- Chart on China - Market size and forecast 2024-2029 ($ million)
- Data Table on China - Market size and forecast 2024-2029 ($ million)
- Chart on China - Year-over-year growth 2024-2029 (%)
- Data Table on China - Year-over-year growth 2024-2029 (%)
- 13.10 Germany - Market size and forecast 2024-2029
- Chart on Germany - Market size and forecast 2024-2029 ($ million)
- Data Table on Germany - Market size and forecast 2024-2029 ($ million)
- Chart on Germany - Year-over-year growth 2024-2029 (%)
- Data Table on Germany - Year-over-year growth 2024-2029 (%)
- 13.11 UK - Market size and forecast 2024-2029
- Chart on UK - Market size and forecast 2024-2029 ($ million)
- Data Table on UK - Market size and forecast 2024-2029 ($ million)
- Chart on UK - Year-over-year growth 2024-2029 (%)
- Data Table on UK - Year-over-year growth 2024-2029 (%)
- 13.12 India - Market size and forecast 2024-2029
- Chart on India - Market size and forecast 2024-2029 ($ million)
- Data Table on India - Market size and forecast 2024-2029 ($ million)
- Chart on India - Year-over-year growth 2024-2029 (%)
- Data Table on India - Year-over-year growth 2024-2029 (%)
- 13.13 Japan - Market size and forecast 2024-2029
- Chart on Japan - Market size and forecast 2024-2029 ($ million)
- Data Table on Japan - Market size and forecast 2024-2029 ($ million)
- Chart on Japan - Year-over-year growth 2024-2029 (%)
- Data Table on Japan - Year-over-year growth 2024-2029 (%)
- 13.14 France - Market size and forecast 2024-2029
- Chart on France - Market size and forecast 2024-2029 ($ million)
- Data Table on France - Market size and forecast 2024-2029 ($ million)
- Chart on France - Year-over-year growth 2024-2029 (%)
- Data Table on France - Year-over-year growth 2024-2029 (%)
- 13.15 Italy - Market size and forecast 2024-2029
- Chart on Italy - Market size and forecast 2024-2029 ($ million)
- Data Table on Italy - Market size and forecast 2024-2029 ($ million)
- Chart on Italy - Year-over-year growth 2024-2029 (%)
- Data Table on Italy - Year-over-year growth 2024-2029 (%)
- 13.16 Brazil - Market size and forecast 2024-2029
- Chart on Brazil - Market size and forecast 2024-2029 ($ million)
- Data Table on Brazil - Market size and forecast 2024-2029 ($ million)
- Chart on Brazil - Year-over-year growth 2024-2029 (%)
- Data Table on Brazil - Year-over-year growth 2024-2029 (%)
- 13.17 Market opportunity By Geographical Landscape
- Market opportunity By Geographical Landscape ($ million)
- Data Tables on Market opportunity By Geographical Landscape ($ million)
14 Drivers, Challenges, and Opportunity/Restraints
- 14.1 Market drivers
- 14.2 Market challenges
- 14.3 Impact of drivers and challenges
- Impact of drivers and challenges in 2024 and 2029
- 14.4 Market opportunities/restraints
15 Competitive Landscape
- 15.1 Overview
- 15.2 Competitive Landscape
- Overview on criticality of inputs and factors of differentiation
- 15.3 Landscape disruption
- Overview on factors of disruption
- 15.4 Industry risks
- Impact of key risks on business
16 Competitive Analysis
- 16.1 Companies profiled
- Companies covered
- 16.2 Company ranking index
- Company ranking index
- 16.3 Market positioning of companies
- Matrix on companies position and classification
- 16.4 Agilent Technologies Inc.
- Agilent Technologies Inc. - Overview
- Agilent Technologies Inc. - Business segments
- Agilent Technologies Inc. - Key news
- Agilent Technologies Inc. - Key offerings
- Agilent Technologies Inc. - Segment focus
- SWOT
- 16.5 Cirdan
- Cirdan - Overview
- Cirdan - Product / Service
- Cirdan - Key offerings
- SWOT
- 16.6 Clinisys Inc
- Clinisys Inc - Overview
- Clinisys Inc - Product / Service
- Clinisys Inc - Key offerings
- SWOT
- 16.7 CompuGroup Medical SE and Co. KGaA
- CompuGroup Medical SE and Co. KGaA - Overview
- CompuGroup Medical SE and Co. KGaA - Business segments
- CompuGroup Medical SE and Co. KGaA - Key offerings
- CompuGroup Medical SE and Co. KGaA - Segment focus
- SWOT
- 16.8 Danaher Corp.
- Danaher Corp. - Overview
- Danaher Corp. - Business segments
- Danaher Corp. - Key news
- Danaher Corp. - Key offerings
- Danaher Corp. - Segment focus
- SWOT
- 16.9 F. Hoffmann La Roche Ltd.
- F. Hoffmann La Roche Ltd. - Overview
- F. Hoffmann La Roche Ltd. - Business segments
- F. Hoffmann La Roche Ltd. - Key news
- F. Hoffmann La Roche Ltd. - Key offerings
- F. Hoffmann La Roche Ltd. - Segment focus
- SWOT
- 16.10 Mikroscan Technologies Inc.
- Mikroscan Technologies Inc. - Overview
- Mikroscan Technologies Inc. - Product / Service
- Mikroscan Technologies Inc. - Key offerings
- SWOT
- 16.11 PHC Holdings Corp.
- PHC Holdings Corp. - Overview
- PHC Holdings Corp. - Business segments
- PHC Holdings Corp. - Key offerings
- PHC Holdings Corp. - Segment focus
- SWOT
- 16.12 Powered Milestone Srl
- Powered Milestone Srl - Overview
- Powered Milestone Srl - Product / Service
- Powered Milestone Srl - Key offerings
- SWOT
- 16.13 Psyche Systems Corp.
- Psyche Systems Corp. - Overview
- Psyche Systems Corp. - Product / Service
- Psyche Systems Corp. - Key offerings
- SWOT
- 16.14 Sakura Finetek
- Sakura Finetek - Overview
- Sakura Finetek - Product / Service
- Sakura Finetek - Key offerings
- SWOT
- 16.15 Siemens Healthineers AG
- Siemens Healthineers AG - Overview
- Siemens Healthineers AG - Business segments
- Siemens Healthineers AG - Key news
- Siemens Healthineers AG - Key offerings
- Siemens Healthineers AG - Segment focus
- SWOT
- 16.16 Visiopharm AS
- Visiopharm AS - Overview
- Visiopharm AS - Product / Service
- Visiopharm AS - Key news
- Visiopharm AS - Key offerings
- SWOT
- 16.17 Voicebrook Inc.
- Voicebrook Inc. - Overview
- Voicebrook Inc. - Product / Service
- Voicebrook Inc. - Key offerings
- SWOT
- 16.18 XIFIN Inc.
- XIFIN Inc. - Overview
- XIFIN Inc. - Product / Service
- XIFIN Inc. - Key news
- XIFIN Inc. - Key offerings
- SWOT
17 Appendix
- 17.1 Scope of the report
- 17.2 Inclusions and exclusions checklist
- Inclusions checklist
- Exclusions checklist
- 17.3 Currency conversion rates for US$
- Currency conversion rates for US$
- 17.4 Research methodology
- Research methodology
- 17.5 Data procurement
- Information sources
- 17.6 Data validation
- Data validation
- 17.7 Validation techniques employed for market sizing
- Validation techniques employed for market sizing
- 17.8 Data synthesis
- Data synthesis
- 17.9 360 degree market analysis
- 360 degree market analysis
- 17.10 List of abbreviations
- List of abbreviations
