市場調査レポート
商品コード
1666864

日本のクラウドコンピューティング市場 2025~2029年

Cloud Computing Market in Japan 2025-2029


出版日
発行
TechNavio
ページ情報
英文 192 Pages
納期
即納可能 即納可能とは
カスタマイズ可能
価格
価格表記: USDを日本円(税抜)に換算
本日の銀行送金レート: 1USD=144.06円
日本のクラウドコンピューティング市場 2025~2029年
出版日: 2025年02月20日
発行: TechNavio
ページ情報: 英文 192 Pages
納期: 即納可能 即納可能とは
GIIご利用のメリット
  • 全表示
  • 概要
  • 目次
概要

日本のクラウドコンピューティング市場は、2024~2029年にかけて204億6,610万米ドル、予測期間中のCAGRは14.8%で成長すると予測されます。

当レポートでは、日本のクラウドコンピューティング市場について、市場規模・予測、動向、成長促進要因、25社前後のベンダーを網羅した総合的な分析を掲載しています。

現在の市場シナリオ、最新動向と促進要因、市場環境全般に関する最新分析を提供しています。市場を牽引しているのは、コスト削減を目的としたクラウドコンピューティングへの嗜好の高まり、クラウド導入を後押しするコンテナ利用の増加、中小企業におけるクラウド導入の拡大などです。

本調査は、業界の主要参加者からのインプットを含め、一次情報と二次情報を客観的に組み合わせて実施しました。レポートには、主要企業の分析に加え、包括的な市場規模データ、地域別分析によるセグメント、ベンダー情勢が含まれています。レポートには過去データと予測データを掲載しています。

市場範囲
基準年 2025年
終了年 2029年
予測期間 2025~2029年
成長モメンタム 加速
前年比2025年 12.5%
CAGR 14.8%
増分額 204億6,610万米ドル

本調査では、クラウドオーケストレーションとクラウド管理ソフトウェアの利用増加が、今後数年間の日本のクラウドコンピューティング市場の成長を牽引する主要因の1つであると分析しています。また、ハイブリッドクラウドやマルチクラウドの採用が増加し、持続可能性やグリーンコンピューティングへの注目が高まっていることも、市場の大きな需要につながると思われます。

目次

第1章 エグゼクティブサマリー

  • 市場概要

第2章 Technavio別分析

  • 価格・ライフサイクル・顧客購入バスケット・採用率・購入基準の分析
  • インプットの重要性と差別化の要因
  • 混乱の要因
  • 促進要因と課題の影響

第3章 市場情勢

  • 市場エコシステム
  • 市場の特徴
  • バリューチェーン分析

第4章 市場規模

  • 市場の定義
  • 市場セグメント分析
  • 市場規模 2024年
  • 市場展望 2024~2029年

第5章 市場規模実績

  • 日本のクラウドコンピューティング市場 2019~2023年
  • サービス別セグメント分析 2019~2023年
  • 展開別セグメント分析 2019~2023年
  • エンドユーザー別セグメント分析 2019~2023年
  • セクター別セグメント分析 2019~2023年

第6章 定性分析

  • AIの影響:日本のクラウドコンピューティング市場

第7章 ファイブフォース分析

  • ファイブフォースの要約
  • 買い手の交渉力
  • 供給企業の交渉力
  • 新規参入業者の脅威
  • 代替品の脅威
  • 競争の脅威
  • 市況

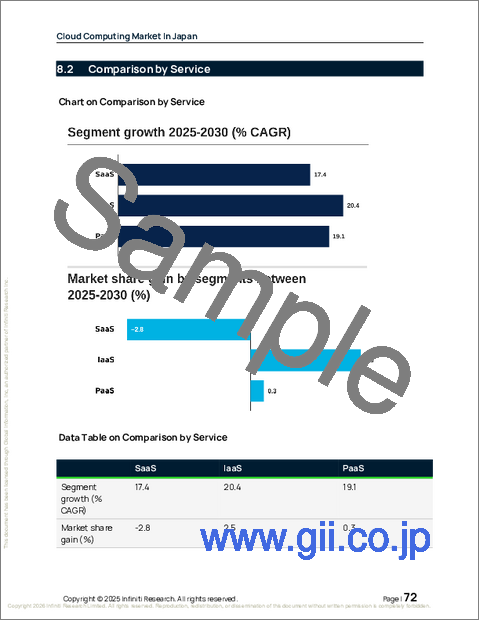
第8章 市場セグメンテーション:サービス別

  • 市場セグメント
  • 比較:サービス別
  • SaaS:市場規模と予測 2024~2029年
  • IaaS:市場規模と予測 2024~2029年
  • PaaS:市場規模と予測 2024~2029年
  • 市場機会:サービス別

第9章 市場セグメンテーション:展開別

  • 市場セグメント
  • 比較:展開別
  • パブリッククラウド:市場規模と予測 2024~2029年
  • プライベートクラウド:市場規模と予測 2024~2029年
  • 市場機会:展開別

第10章 市場セグメンテーション:エンドユーザー別

  • 市場セグメント
  • 比較:エンドユーザー別
  • IT・通信:市場規模と予測 2024~2029年
  • BFSI:市場規模と予測 2024~2029年
  • 政府:市場規模と予測 2024~2029年
  • その他:市場規模と予測 2024~2029年
  • 市場機会:エンドユーザー別

第11章 市場セグメンテーション:セクター別

  • 市場セグメント
  • 比較:セクター別
  • 中小企業:市場規模と予測 2024~2029年
  • 大企業:市場規模と予測 2024~2029年
  • 市場機会:セクター別

第12章 顧客情勢

  • 顧客情勢の概要

第13章 促進要因・課題・機会・抑制要因

  • 市場促進要因
  • 市場の課題
  • 促進要因と課題の影響
  • 市場の機会・抑制要因

第14章 競合情勢

  • 概要
  • 競合情勢
  • 混乱の状況
  • 業界のリスク

第15章 競合分析

  • 企業プロファイル
  • 企業ランキング指数
  • 企業の市場ポジショニング
  • Alibaba Group Holding Ltd.
  • Amazon.com Inc.
  • Dell Technologies Inc.
  • DS Solution Inc.
  • Fujitsu Ltd.
  • Google LLC
  • Huawei Technologies Co. Ltd.
  • International Business Machines Corp.
  • Internet Initiative Japan Inc.
  • Microsoft Corp.
  • NEC Corp.
  • Nutanix Inc.
  • Oracle Corp.
  • Salesforce Inc.
  • VMware Inc.

第16章 付録

目次
Product Code: IRTNTR75519

The cloud computing market in Japan is forecasted to grow by USD 20466.1 million during 2024-2029, accelerating at a CAGR of 14.8% during the forecast period. The report on the cloud computing market in Japan provides a holistic analysis, market size and forecast, trends, growth drivers, and challenges, as well as vendor analysis covering around 25 vendors.

The report offers an up-to-date analysis regarding the current market scenario, the latest trends and drivers, and the overall market environment. The market is driven by growing inclination toward cloud computing for cost-cutting, increased use of containers boosting cloud adoption, and growing adoption of cloud among smes.

The study was conducted using an objective combination of primary and secondary information including inputs from key participants in the industry. The report contains a comprehensive market size data, segment with regional analysis and vendor landscape in addition to an analysis of the key companies. Reports have historic and forecast data.

Market Scope
Base Year2025
End Year2029
Series Year2025-2029
Growth MomentumAccelerate
YOY 202512.5%
CAGR14.8%
Incremental Value$20466.1 mn

Technavio's cloud computing market in Japan is segmented as below:

By Service

    • SaaS
    • IaaS
    • PaaS

By Deployment

    • Public cloud
    • Private cloud

By End-user

    • IT and telecommunications
    • BFSI
    • Government
    • Others

By Sector

    • SMEs
    • Large enterprises

By Geographical Landscape

    • APAC

This study identifies the increase in use of cloud orchestration and cloud management software as one of the prime reasons driving the cloud computing market in Japan growth during the next few years. Also, increasing adoption of hybrid and multi-cloud and growing focus on sustainability and green computing will lead to sizable demand in the market.

The report on the cloud computing market in Japan covers the following areas:

    • Cloud Computing Market in Japan sizing
    • Cloud Computing Market in Japan forecast
    • Cloud Computing Market in Japan industry analysis

The robust vendor analysis is designed to help clients improve their market position, and in line with this, this report provides a detailed analysis of several leading cloud computing market in Japan vendors that include Akamai Technologies Inc., Alibaba Group Holding Ltd., Amazon.com Inc., Coupa Software Inc., Dell Technologies Inc., DevSamurai Inc., DS Solution Inc., Fujitsu Ltd., Google LLC, Huawei Technologies Co. Ltd., International Business Machines Corp., Internet Initiative Japan Inc., Microsoft Corp., NEC Corp., Nutanix Inc., Oracle Corp., Rikkeisoft Corp., Salesforce Inc., The Constant Co. LLC, and VMware Inc.. Also, the cloud computing market in Japan analysis report includes information on upcoming trends and challenges that will influence market growth. This is to help companies strategize and leverage all forthcoming growth opportunities.

The publisher presents a detailed picture of the market by the way of study, synthesis, and summation of data from multiple sources by an analysis of key parameters such as profit, pricing, competition, and promotions. It presents various market facets by identifying the key industry influencers. The data presented is comprehensive, reliable, and a result of extensive primary and secondary research. The market research reports provide a complete competitive landscape and an in-depth vendor selection methodology and analysis using qualitative and quantitative research to forecast accurate market growth.

Table of Contents

1 Executive Summary

  • 1.1 Market overview
    • Executive Summary - Chart on Market Overview
    • Executive Summary - Data Table on Market Overview
    • Executive Summary - Chart on Country Market Characteristics
    • Executive Summary - Chart on Market Segmentation by Service
    • Executive Summary - Chart on Market Segmentation by Deployment
    • Executive Summary - Chart on Market Segmentation by End-user
    • Executive Summary - Chart on Market Segmentation by Sector
    • Executive Summary - Chart on Company Market Positioning

2 Technavio Analysis

  • 2.1 Analysis of price sensitivity, lifecycle, customer purchase basket, adoption rates, and purchase criteria
    • Analysis of price sensitivity, lifecycle, customer purchase basket, adoption rates, and purchase criteria
  • 2.2 Criticality of inputs and Factors of differentiation
    • Overview on criticality of inputs and factors of differentiation
  • 2.3 Factors of disruption
    • Overview on factors of disruption
  • 2.4 Impact of drivers and challenges
    • Impact of drivers and challenges in 2024 and 2029

3 Market Landscape

  • 3.1 Market ecosystem
    • Parent Market
    • Data Table on - Parent Market
  • 3.2 Market characteristics
    • Market characteristics analysis
  • 3.3 Value chain analysis
    • Value chain analysis

4 Market Sizing

  • 4.1 Market definition
    • Offerings of companies included in the market definition
  • 4.2 Market segment analysis
    • Market segments
  • 4.3 Market size 2024
  • 4.4 Market outlook: Forecast for 2024-2029
    • Chart on Japan - Market size and forecast 2024-2029 ($ million)
    • Data Table on Japan - Market size and forecast 2024-2029 ($ million)
    • Chart on Japan: Year-over-year growth 2024-2029 (%)
    • Data Table on Japan: Year-over-year growth 2024-2029 (%)

5 Historic Market Size

  • 5.1 Cloud Computing Market in Japan 2019 - 2023
    • Historic Market Size - Data Table on Cloud Computing Market in Japan 2019 - 2023 ($ million)
  • 5.2 Service segment analysis 2019 - 2023
    • Historic Market Size - Service Segment 2019 - 2023 ($ million)
  • 5.3 Deployment segment analysis 2019 - 2023
    • Historic Market Size - Deployment Segment 2019 - 2023 ($ million)
  • 5.4 End-user segment analysis 2019 - 2023
    • Historic Market Size - End-user Segment 2019 - 2023 ($ million)
  • 5.5 Sector segment analysis 2019 - 2023
    • Historic Market Size - Sector Segment 2019 - 2023 ($ million)

6 Qualitative Analysis

  • 6.1 AI Impact on Cloud Computing Market in Japan

7 Five Forces Analysis

  • 7.1 Five forces summary
    • Five forces analysis - Comparison between 2024 and 2029
  • 7.2 Bargaining power of buyers
    • Bargaining power of buyers - Impact of key factors 2024 and 2029
  • 7.3 Bargaining power of suppliers
    • Bargaining power of suppliers - Impact of key factors in 2024 and 2029
  • 7.4 Threat of new entrants
    • Threat of new entrants - Impact of key factors in 2024 and 2029
  • 7.5 Threat of substitutes
    • Threat of substitutes - Impact of key factors in 2024 and 2029
  • 7.6 Threat of rivalry
    • Threat of rivalry - Impact of key factors in 2024 and 2029
  • 7.7 Market condition
    • Chart on Market condition - Five forces 2024 and 2029

8 Market Segmentation by Service

  • 8.1 Market segments
    • Chart on Service - Market share 2024-2029 (%)
    • Data Table on Service - Market share 2024-2029 (%)
  • 8.2 Comparison by Service
    • Chart on Comparison by Service
    • Data Table on Comparison by Service
  • 8.3 SaaS - Market size and forecast 2024-2029
    • Chart on SaaS - Market size and forecast 2024-2029 ($ million)
    • Data Table on SaaS - Market size and forecast 2024-2029 ($ million)
    • Chart on SaaS - Year-over-year growth 2024-2029 (%)
    • Data Table on SaaS - Year-over-year growth 2024-2029 (%)
  • 8.4 IaaS - Market size and forecast 2024-2029
    • Chart on IaaS - Market size and forecast 2024-2029 ($ million)
    • Data Table on IaaS - Market size and forecast 2024-2029 ($ million)
    • Chart on IaaS - Year-over-year growth 2024-2029 (%)
    • Data Table on IaaS - Year-over-year growth 2024-2029 (%)
  • 8.5 PaaS - Market size and forecast 2024-2029
    • Chart on PaaS - Market size and forecast 2024-2029 ($ million)
    • Data Table on PaaS - Market size and forecast 2024-2029 ($ million)
    • Chart on PaaS - Year-over-year growth 2024-2029 (%)
    • Data Table on PaaS - Year-over-year growth 2024-2029 (%)
  • 8.6 Market opportunity by Service
    • Market opportunity by Service ($ million)
    • Data Table on Market opportunity by Service ($ million)

9 Market Segmentation by Deployment

  • 9.1 Market segments
    • Chart on Deployment - Market share 2024-2029 (%)
    • Data Table on Deployment - Market share 2024-2029 (%)
  • 9.2 Comparison by Deployment
    • Chart on Comparison by Deployment
    • Data Table on Comparison by Deployment
  • 9.3 Public cloud - Market size and forecast 2024-2029
    • Chart on Public cloud - Market size and forecast 2024-2029 ($ million)
    • Data Table on Public cloud - Market size and forecast 2024-2029 ($ million)
    • Chart on Public cloud - Year-over-year growth 2024-2029 (%)
    • Data Table on Public cloud - Year-over-year growth 2024-2029 (%)
  • 9.4 Private cloud - Market size and forecast 2024-2029
    • Chart on Private cloud - Market size and forecast 2024-2029 ($ million)
    • Data Table on Private cloud - Market size and forecast 2024-2029 ($ million)
    • Chart on Private cloud - Year-over-year growth 2024-2029 (%)
    • Data Table on Private cloud - Year-over-year growth 2024-2029 (%)
  • 9.5 Market opportunity by Deployment
    • Market opportunity by Deployment ($ million)
    • Data Table on Market opportunity by Deployment ($ million)

10 Market Segmentation by End-user

  • 10.1 Market segments
    • Chart on End-user - Market share 2024-2029 (%)
    • Data Table on End-user - Market share 2024-2029 (%)
  • 10.2 Comparison by End-user
    • Chart on Comparison by End-user
    • Data Table on Comparison by End-user
  • 10.3 IT and telecommunications - Market size and forecast 2024-2029
    • Chart on IT and telecommunications - Market size and forecast 2024-2029 ($ million)
    • Data Table on IT and telecommunications - Market size and forecast 2024-2029 ($ million)
    • Chart on IT and telecommunications - Year-over-year growth 2024-2029 (%)
    • Data Table on IT and telecommunications - Year-over-year growth 2024-2029 (%)
  • 10.4 BFSI - Market size and forecast 2024-2029
    • Chart on BFSI - Market size and forecast 2024-2029 ($ million)
    • Data Table on BFSI - Market size and forecast 2024-2029 ($ million)
    • Chart on BFSI - Year-over-year growth 2024-2029 (%)
    • Data Table on BFSI - Year-over-year growth 2024-2029 (%)
  • 10.5 Government - Market size and forecast 2024-2029
    • Chart on Government - Market size and forecast 2024-2029 ($ million)
    • Data Table on Government - Market size and forecast 2024-2029 ($ million)
    • Chart on Government - Year-over-year growth 2024-2029 (%)
    • Data Table on Government - Year-over-year growth 2024-2029 (%)
  • 10.6 Others - Market size and forecast 2024-2029
    • Chart on Others - Market size and forecast 2024-2029 ($ million)
    • Data Table on Others - Market size and forecast 2024-2029 ($ million)
    • Chart on Others - Year-over-year growth 2024-2029 (%)
    • Data Table on Others - Year-over-year growth 2024-2029 (%)
  • 10.7 Market opportunity by End-user
    • Market opportunity by End-user ($ million)
    • Data Table on Market opportunity by End-user ($ million)

11 Market Segmentation by Sector

  • 11.1 Market segments
    • Chart on Sector - Market share 2024-2029 (%)
    • Data Table on Sector - Market share 2024-2029 (%)
  • 11.2 Comparison by Sector
    • Chart on Comparison by Sector
    • Data Table on Comparison by Sector
  • 11.3 SMEs - Market size and forecast 2024-2029
    • Chart on SMEs - Market size and forecast 2024-2029 ($ million)
    • Data Table on SMEs - Market size and forecast 2024-2029 ($ million)
    • Chart on SMEs - Year-over-year growth 2024-2029 (%)
    • Data Table on SMEs - Year-over-year growth 2024-2029 (%)
  • 11.4 Large enterprises - Market size and forecast 2024-2029
    • Chart on Large enterprises - Market size and forecast 2024-2029 ($ million)
    • Data Table on Large enterprises - Market size and forecast 2024-2029 ($ million)
    • Chart on Large enterprises - Year-over-year growth 2024-2029 (%)
    • Data Table on Large enterprises - Year-over-year growth 2024-2029 (%)
  • 11.5 Market opportunity by Sector
    • Market opportunity by Sector ($ million)
    • Data Table on Market opportunity by Sector ($ million)

12 Customer Landscape

  • 12.1 Customer landscape overview
    • Analysis of price sensitivity, lifecycle, customer purchase basket, adoption rates, and purchase criteria

13 Drivers, Challenges, and Opportunity/Restraints

  • 13.1 Market drivers
  • 13.2 Market challenges
  • 13.3 Impact of drivers and challenges
    • Impact of drivers and challenges in 2024 and 2029
  • 13.4 Market opportunities/restraints

14 Competitive Landscape

  • 14.1 Overview
  • 14.2 Competitive Landscape
    • Overview on criticality of inputs and factors of differentiation
  • 14.3 Landscape disruption
    • Overview on factors of disruption
  • 14.4 Industry risks
    • Impact of key risks on business

15 Competitive Analysis

  • 15.1 Companies profiled
    • Companies covered
  • 15.2 Company ranking index
    • Company ranking index
  • 15.3 Market positioning of companies
    • Matrix on companies position and classification
  • 15.4 Alibaba Group Holding Ltd.
    • Alibaba Group Holding Ltd. - Overview
    • Alibaba Group Holding Ltd. - Business segments
    • Alibaba Group Holding Ltd. - Key news
    • Alibaba Group Holding Ltd. - Key offerings
    • Alibaba Group Holding Ltd. - Segment focus
    • SWOT
  • 15.5 Amazon.com Inc.
    • Amazon.com Inc. - Overview
    • Amazon.com Inc. - Business segments
    • Amazon.com Inc. - Key news
    • Amazon.com Inc. - Key offerings
    • Amazon.com Inc. - Segment focus
    • SWOT
  • 15.6 Dell Technologies Inc.
    • Dell Technologies Inc. - Overview
    • Dell Technologies Inc. - Business segments
    • Dell Technologies Inc. - Key news
    • Dell Technologies Inc. - Key offerings
    • Dell Technologies Inc. - Segment focus
    • SWOT
  • 15.7 DS Solution Inc.
    • DS Solution Inc. - Overview
    • DS Solution Inc. - Product / Service
    • DS Solution Inc. - Key offerings
    • SWOT
  • 15.8 Fujitsu Ltd.
    • Fujitsu Ltd. - Overview
    • Fujitsu Ltd. - Business segments
    • Fujitsu Ltd. - Key news
    • Fujitsu Ltd. - Key offerings
    • Fujitsu Ltd. - Segment focus
    • SWOT
  • 15.9 Google LLC
    • Google LLC - Overview
    • Google LLC - Product / Service
    • Google LLC - Key news
    • Google LLC - Key offerings
    • SWOT
  • 15.10 Huawei Technologies Co. Ltd.
    • Huawei Technologies Co. Ltd. - Overview
    • Huawei Technologies Co. Ltd. - Product / Service
    • Huawei Technologies Co. Ltd. - Key news
    • Huawei Technologies Co. Ltd. - Key offerings
    • SWOT
  • 15.11 International Business Machines Corp.
    • International Business Machines Corp. - Overview
    • International Business Machines Corp. - Business segments
    • International Business Machines Corp. - Key news
    • International Business Machines Corp. - Key offerings
    • International Business Machines Corp. - Segment focus
    • SWOT
  • 15.12 Internet Initiative Japan Inc.
    • Internet Initiative Japan Inc. - Overview
    • Internet Initiative Japan Inc. - Product / Service
    • Internet Initiative Japan Inc. - Key offerings
    • SWOT
  • 15.13 Microsoft Corp.
    • Microsoft Corp. - Overview
    • Microsoft Corp. - Business segments
    • Microsoft Corp. - Key news
    • Microsoft Corp. - Key offerings
    • Microsoft Corp. - Segment focus
    • SWOT
  • 15.14 NEC Corp.
    • NEC Corp. - Overview
    • NEC Corp. - Business segments
    • NEC Corp. - Key news
    • NEC Corp. - Key offerings
    • NEC Corp. - Segment focus
    • SWOT
  • 15.15 Nutanix Inc.
    • Nutanix Inc. - Overview
    • Nutanix Inc. - Product / Service
    • Nutanix Inc. - Key offerings
    • SWOT
  • 15.16 Oracle Corp.
    • Oracle Corp. - Overview
    • Oracle Corp. - Business segments
    • Oracle Corp. - Key news
    • Oracle Corp. - Key offerings
    • Oracle Corp. - Segment focus
    • SWOT
  • 15.17 Salesforce Inc.
    • Salesforce Inc. - Overview
    • Salesforce Inc. - Product / Service
    • Salesforce Inc. - Key news
    • Salesforce Inc. - Key offerings
    • SWOT
  • 15.18 VMware Inc.
    • VMware Inc. - Overview
    • VMware Inc. - Product / Service
    • VMware Inc. - Key offerings
    • SWOT

16 Appendix

  • 16.1 Scope of the report
  • 16.2 Inclusions and exclusions checklist
    • Inclusions checklist
    • Exclusions checklist
  • 16.3 Currency conversion rates for US$
    • Currency conversion rates for US$
  • 16.4 Research methodology
    • Research methodology
  • 16.5 Data procurement
    • Information sources
  • 16.6 Data validation
    • Data validation
  • 16.7 Validation techniques employed for market sizing
    • Validation techniques employed for market sizing
  • 16.8 Data synthesis
    • Data synthesis
  • 16.9 360 degree market analysis
    • 360 degree market analysis
  • 16.10 List of abbreviations
    • List of abbreviations