|
|
市場調査レポート
商品コード
1937226
マーケティングコンサルティングの世界市場 2026年~2030年Global Marketing Consulting Market 2026-2030 |
||||||

|
|||||||
カスタマイズ可能
|
|||||||

| マーケティングコンサルティングの世界市場 2026年~2030年 |
|
出版日: 2026年02月11日
発行: TechNavio
ページ情報: 英文 305 Pages
納期: 即納可能
|

概要
世界のマーケティングコンサルティング市場は、2025年から2030年にかけて431億9,740万米ドルの成長が見込まれ、予測期間中のCAGRは4.6%と予測されています。
本レポートでは、世界のマーケティングコンサルティング市場に関する包括的な分析、市場規模と予測、動向、成長要因、課題に加え、約25社のベンダー分析を提供しております。
本レポートは、現在の市場状況、最新の動向と促進要因、市場環境全般に関する最新の分析を提供します。市場は、デジタルトランスフォーメーションと人工知能チャットボットの統合、データ駆動型かつパーソナライズされたマーケティング、オムニチャネルおよび顧客中心の戦略によって牽引されています。
本調査は、業界の主要関係者からの情報を含む、一次情報と二次情報の客観的な組み合わせを用いて実施されました。本レポートには、主要企業の分析に加え、包括的な市場規模データ、地域別分析を伴うセグメント、ベンダー情勢が含まれています。レポートには過去データと予測データが掲載されています。
| 市場範囲 | |
|---|---|
| 基準年 | 2026年 |
| 終了年 | 2030年 |
| 予測期間 | 2026-2030 |
| 成長モメンタム | 加速 |
| 前年比2026年 | 4.3% |
| CAGR | 4.6% |
| 増分額 | 431億9,740万米ドル |
本調査では、持続可能性と目的志向のブランディングアドバイザリーが、今後数年間における世界のマーケティングコンサルティング市場の成長を牽引する主要な要因の一つであると特定しております。また、コンテンツおよびキャンペーン最適化における生成AIの採用、ならびにプライバシー優先およびファーストパーティデータ戦略が、市場において相当な需要を生み出すものと見込まれます。
目次
第1章 エグゼクティブサマリー
第2章 Technavio分析
- 価格・ライフサイクル・顧客購入バスケット・採用率・購入基準の分析
- インプットの重要性と差別化の要因
- 混乱の要因
- 促進要因と課題の影響
第3章 市場情勢
- 市場エコシステム
- 市場の特徴
- バリューチェーン分析
第4章 市場規模
- 市場の定義
- 市場セグメント分析
- 市場規模 2025
- 市場の見通し 2025-2030
第5章 市場規模実績
- マーケティングコンサルティングの世界市場 2020-2024
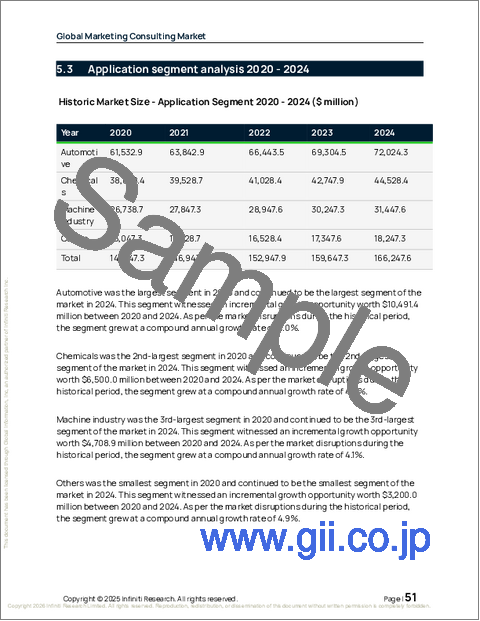
- サービスセグメント分析 2020-2024
- 用途別セグメント分析 2020-2024
- タイプセグメント分析 2020-2024
- 地域別セグメント分析 2020-2024
- 国別セグメント分析 2020-2024
第6章 定性分析
- AIの影響:マーケティングコンサルティングの世界市場
第7章 ファイブフォース分析
- ファイブフォースの要約
- 買い手の交渉力
- 供給企業の交渉力
- 新規参入業者の脅威
- 代替品の脅威
- 競争の脅威
- 市況
第8章 市場セグメンテーション:サービス別
- 比較:サービス別
- MSMDおよびICサービス
- 営業管理・開発コンサルティングサービス
- その他
- 市場機会:サービス別
第9章 市場セグメンテーション:用途別
- 比較:用途別
- 自動車
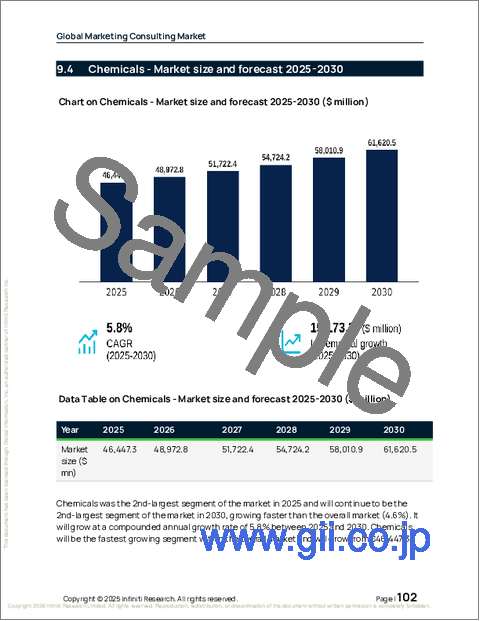
- 化学品
- 機械産業
- その他
- 市場機会:用途別
第10章 市場セグメンテーション:タイプ別
- 比較:タイプ別
- プロジェクトベース
- リテイナー契約型
- オンデマンド
- 市場機会:タイプ別
第11章 顧客情勢
第12章 地域別情勢
- 地域別セグメンテーション
- 地域別比較
- 北米
- 米国
- カナダ
- メキシコ
- 欧州
- ドイツ
- フランス
- 英国
- イタリア
- スペイン
- オランダ
- アジア太平洋
- 中国
- 日本
- インド
- 韓国
- オーストラリア
- インドネシア
- 中東・アフリカ
- アラブ首長国連邦
- サウジアラビア
- 南アフリカ
- トルコ
- イスラエル
- 南米
- ブラジル
- アルゼンチン
- コロンビア
- 市場機会:地域別
第13章 促進要因・課題・機会
- 市場促進要因
- 市場の課題
- 促進要因と課題の影響
- 市場機会
第14章 競合情勢
- 概要
- 競合情勢
- 混乱の状況
- 業界のリスク
第15章 競合分析
- 企業プロファイル
- 企業ランキング指標
- 企業の市場ポジショニング
- Accenture Plc
- Alvarez and Marsal Holdings
- Bain and Co. Inc.
- BearingPoint Holding BV
- Boston Consulting Group Inc.
- Deloitte Touche Tohmatsu Ltd.
- Ernst and Young Global Ltd.
- KPMG International Ltd.
- L.E.K. Consulting LLC
- McKinsey and Co.
- PricewaterhouseCoopers LLP
- RGA Media Group Inc.
- The Nielsen Co. LLC
- YCP Holdings Ltd.
- ZS Associates Inc.
