|
|
市場調査レポート
商品コード
1653092
清掃機器・用品の世界市場 2025~2029年Global Janitorial Cleaning Equipment and Supplies Market 2025-2029 |
||||||

|
|||||||
カスタマイズ可能
|
|||||||


| 清掃機器・用品の世界市場 2025~2029年 |
|
出版日: 2025年01月25日
発行: TechNavio
ページ情報: 英文 214 Pages
納期: 即納可能
|

全表示
- 概要
- 目次
清掃機器・用品市場は2024~2029年に123億370万米ドル、予測期間中のCAGRは5.2%で成長すると予測されます。
当レポートでは、清掃機器・用品市場の全体的な分析、市場規模・予測、動向、成長促進要因、課題、約25のベンダーを網羅したベンダー分析などを掲載しています。
現在の市場シナリオ、最新動向と促進要因、市場環境全体に関する最新分析を提供しています。市場は、衛生・安全性に関する厳しい規制要件、急速な都市化とインフラの成長、新興国における可処分所得の増加によって牽引されています。
| 市場範囲 | |
|---|---|
| 基準年 | 2025年 |
| 終了年 | 2029年 |
| 予測期間 | 2025~2029年 |
| 成長モメンタム | 加速 |
| 前年比[2025年] | 3.9% |
| CAGR | 5.2% |
| 増分額 | 123億370万米ドル |
本調査は、産業の主要参加者からのインプットを含め、一次情報と二次情報を客観的に組み合わせて実施しました。レポートには、主要企業の分析に加え、包括的な市場規模データ、地域別分析によるセグメント、ベンダー情勢が含まれています。レポートには過去データと予測データがあります。
本調査では、環境に優しい製品に対する需要の高まりが、今後数年間の清掃機器・用品市場の成長を促進する主要な理由の1つであると特定しています。また、ロボットや自動洗浄ソリューションの採用、洗浄サービスのアウトソーシングの増加が、市場の大きな需要につながります。
目次
第1章 エグゼクティブサマリー
- 市場概要
第2章 Technavio分析
- 価格・ライフサイクル・顧客購入バスケット・採用率・購入基準の分析
- インプットの重要性と差別化の要因
- 混乱の要因
- 促進要因と課題の影響
第3章 市場情勢
- 市場エコシステム
- 市場の特徴
- バリューチェーン分析
第4章 市場規模
- 市場の定義
- 市場セグメント分析
- 市場規模 2024年
- 市場の展望 2024~2029年
第5章 市場規模実績
- 清掃機器・用品の世界市場 2019~2023年
- 製品タイプ別セグメント分析 2019~2023年
- エンドユーザー別セグメント分析 2019~2023年
- 地域別セグメント分析 2019~2023年
- 国別セグメント分析 2019~2023年
第6章 定性分析
- AIの影響-清掃機器・用品の世界市場
第7章 ファイブフォース分析
- ファイブフォースの要約
- 買い手の交渉力
- 供給企業の交渉力
- 新規参入業者の脅威
- 代替品の脅威
- 競争の脅威
- 市況
第8章 市場セグメンテーション:製品タイプ別
- 市場セグメント
- 比較:製品タイプ別
- 装置:市場規模と予測 2024~2029年
- カートとツール:市場規模と予測 2024~2029年
- 床掃除用品:市場規模と予測 2024~2029年
- 使い捨て:市場規模と予測 2024~2029年
- 市場機会:製品タイプ別
第9章 市場セグメンテーション:エンドユーザー別
- 市場セグメント
- 比較:エンドユーザー別
- 業務用:市場規模と予測 2024~2029年
- 住宅用:市場規模と予測 2024~2029年
- 市場機会:エンドユーザー別
第10章 顧客情勢
- 顧客情勢概要
第11章 地域別情勢
- 地域別セグメンテーション
- 比較:地域別
- 北米:市場規模と予測 2024~2029年
- 欧州:市場規模と予測 2024~2029年
- アジア太平洋:市場規模と予測 2024~2029年
- 南米:市場規模と予測 2024~2029年
- 中東・アフリカ:市場規模と予測 2024~2029年
- 米国:市場規模と予測 2024~2029年
- 中国:市場規模と予測 2024~2029年
- ドイツ:市場規模と予測 2024~2029年
- 英国:市場規模と予測 2024~2029年
- 日本:市場規模と予測 2024~2029年
- インド:市場規模と予測 2024~2029年
- カナダ:市場規模と予測 2024~2029年
- フランス:市場規模と予測 2024~2029年
- イタリア:市場規模と予測 2024~2029年
- ブラジル:市場規模と予測 2024~2029年
- 地域情勢による市場機会
第12章 促進要因・課題・機会・抑制要因
- 市場促進要因
- 市場課題
- 促進要因と課題の影響
- 市場機会・抑制要因
第13章 競合情勢
- 概要
- 競合情勢
- 混乱の状況
- 産業のリスク
第14章 競合分析
- 企業プロファイル
- 企業ランキング指数
- 企業の市場ポジショニング
- Alfred Karcher SE and Co. KG
- Diversey Inc.
- Ecolab Inc.
- Electrolux Professional AB
- Eureka SpA
- Evonik Industries AG
- Kimberly Clark Corp.
- Newell Brands Inc.
- Reckitt Benckiser Group Plc
- S.C. Johnson and Son Inc.
- Tennant Co.
- The Clorox Co.
- The Procter and Gamble Co.
- Unilever PLC
第15章 付録
The janitorial cleaning equipment and supplies market is forecasted to grow by USD 12303.7 mn during 2024-2029, accelerating at a CAGR of 5.2% during the forecast period. The report on the janitorial cleaning equipment and supplies market provides a holistic analysis, market size and forecast, trends, growth drivers, and challenges, as well as vendor analysis covering around 25 vendors.
The report offers an up-to-date analysis regarding the current market scenario, the latest trends and drivers, and the overall market environment. The market is driven by stringent regulatory requirements related to hygiene and safety, rapid urbanization and infrastructure growth, and increasing disposable income in emerging economies.
| Market Scope | |
|---|---|
| Base Year | 2025 |
| End Year | 2029 |
| Series Year | 2025-2029 |
| Growth Momentum | Accelerate |
| YOY 2025 | 3.9% |
| CAGR | 5.2% |
| Incremental Value | $12303.7 mn |
The study was conducted using an objective combination of primary and secondary information including inputs from key participants in the industry. The report contains a comprehensive market size data, segment with regional analysis and vendor landscape in addition to an analysis of the key companies. Reports have historic and forecast data.
Technavio's janitorial cleaning equipment and supplies market is segmented as below:
By Product Type
- Equipment
- Carts and tools
- Floor care supplies
- Disposables
By End-user
- Commercial
- Residential
By Geographical Landscape
- North America
- Europe
- APAC
- South America
- Middle East and Africa
This study identifies the growing demand for eco-friendly products as one of the prime reasons driving the janitorial cleaning equipment and supplies market growth during the next few years. Also, adoption of robotic and automated cleaning solutions and increased outsourcing of cleaning services will lead to sizable demand in the market.
The report on the janitorial cleaning equipment and supplies market covers the following areas:
- Janitorial Cleaning Equipment And Supplies Market sizing
- Janitorial Cleaning Equipment And Supplies Market forecast
- Janitorial Cleaning Equipment And Supplies Market industry analysis
The robust vendor analysis is designed to help clients improve their market position, and in line with this, this report provides a detailed analysis of several leading janitorial cleaning equipment and supplies market vendors that include 3M Co., Alfred Karcher SE and Co. KG, BASF SE, COMAC SpA, Croda International Plc, Diversey Inc., Ecolab Inc., Electrolux Professional AB, Eureka SpA, Evonik Industries AG, Hako GmbH, Henkel AG and Co. KGaA, ICE USA, Kimberly Clark Corp., Minuteman Intl, Newell Brands Inc., Nilfisk AS, Reckitt Benckiser Group Plc, Roots Multiclean Ltd., Rubbermaid Commercial Products, S.C. Johnson and Son Inc., Techtronic Industries Co. Ltd., Tennant Co., The Clorox Co., The Procter and Gamble Co., and Unilever PLC. Also, the janitorial cleaning equipment and supplies market analysis report includes information on upcoming trends and challenges that will influence market growth. This is to help companies strategize and leverage all forthcoming growth opportunities.
The publisher presents a detailed picture of the market by the way of study, synthesis, and summation of data from multiple sources by an analysis of key parameters such as profit, pricing, competition, and promotions. It presents various market facets by identifying the key industry influencers. The data presented is comprehensive, reliable, and a result of extensive primary and secondary research. The market research reports provide a complete competitive landscape and an in-depth vendor selection methodology and analysis using qualitative and quantitative research to forecast accurate market growth.
Table of Contents
1 Executive Summary
- 1.1 Market overview
- Executive Summary - Chart on Market Overview
- Executive Summary - Data Table on Market Overview
- Executive Summary - Chart on Global Market Characteristics
- Executive Summary - Chart on Market By Geographical Landscape
- Executive Summary - Chart on Market Segmentation by Product Type
- Executive Summary - Chart on Market Segmentation by End-user
- Executive Summary - Chart on Incremental Growth
- Executive Summary - Data Table on Incremental Growth
- Executive Summary - Chart on Company Market Positioning
2 Technavio Analysis
- 2.1 Analysis of price sensitivity, lifecycle, customer purchase basket, adoption rates, and purchase criteria
- Analysis of price sensitivity, lifecycle, customer purchase basket, adoption rates, and purchase criteria
- 2.2 Criticality of inputs and Factors of differentiation
- Overview on criticality of inputs and factors of differentiation
- 2.3 Factors of disruption
- Overview on factors of disruption
- 2.4 Impact of drivers and challenges
- Impact of drivers and challenges in 2024 and 2029
3 Market Landscape
- 3.1 Market ecosystem
- Parent Market
- Data Table on - Parent Market
- 3.2 Market characteristics
- Market characteristics analysis
- 3.3 Value chain analysis
- Value chain analysis
4 Market Sizing
- 4.1 Market definition
- Offerings of companies included in the market definition
- 4.2 Market segment analysis
- Market segments
- 4.3 Market size 2024
- 4.4 Market outlook: Forecast for 2024-2029
- Chart on Global - Market size and forecast 2024-2029 ($ million)
- Data Table on Global - Market size and forecast 2024-2029 ($ million)
- Chart on Global Market: Year-over-year growth 2024-2029 (%)
- Data Table on Global Market: Year-over-year growth 2024-2029 (%)
5 Historic Market Size
- 5.1 Global Janitorial Cleaning Equipment And Supplies Market 2019 - 2023
- Historic Market Size - Data Table on Global Janitorial Cleaning Equipment And Supplies Market 2019 - 2023 ($ million)
- 5.2 Product Type segment analysis 2019 - 2023
- Historic Market Size - Product Type Segment 2019 - 2023 ($ million)
- 5.3 End-user segment analysis 2019 - 2023
- Historic Market Size - End-user Segment 2019 - 2023 ($ million)
- 5.4 Geography segment analysis 2019 - 2023
- Historic Market Size - Geography Segment 2019 - 2023 ($ million)
- 5.5 Country segment analysis 2019 - 2023
- Historic Market Size - Country Segment 2019 - 2023 ($ million)
6 Qualitative Analysis
- 6.1 Impact of AI on Global Janitorial Cleaning Equipment and Supplies Market
7 Five Forces Analysis
- 7.1 Five forces summary
- Five forces analysis - Comparison between 2024 and 2029
- 7.2 Bargaining power of buyers
- Bargaining power of buyers - Impact of key factors 2024 and 2029
- 7.3 Bargaining power of suppliers
- Bargaining power of suppliers - Impact of key factors in 2024 and 2029
- 7.4 Threat of new entrants
- Threat of new entrants - Impact of key factors in 2024 and 2029
- 7.5 Threat of substitutes
- Threat of substitutes - Impact of key factors in 2024 and 2029
- 7.6 Threat of rivalry
- Threat of rivalry - Impact of key factors in 2024 and 2029
- 7.7 Market condition
- Chart on Market condition - Five forces 2024 and 2029
8 Market Segmentation by Product Type
- 8.1 Market segments
- Chart on Product Type - Market share 2024-2029 (%)
- Data Table on Product Type - Market share 2024-2029 (%)
- 8.2 Comparison by Product Type
- Chart on Comparison by Product Type
- Data Table on Comparison by Product Type
- 8.3 Equipment - Market size and forecast 2024-2029
- Chart on Equipment - Market size and forecast 2024-2029 ($ million)
- Data Table on Equipment - Market size and forecast 2024-2029 ($ million)
- Chart on Equipment - Year-over-year growth 2024-2029 (%)
- Data Table on Equipment - Year-over-year growth 2024-2029 (%)
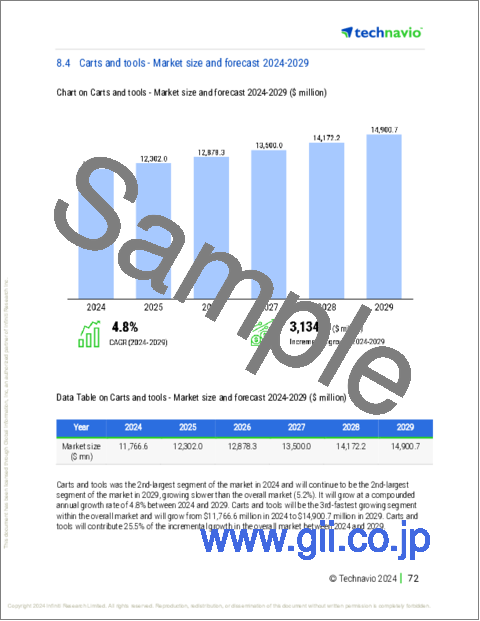
- 8.4 Carts and tools - Market size and forecast 2024-2029
- Chart on Carts and tools - Market size and forecast 2024-2029 ($ million)
- Data Table on Carts and tools - Market size and forecast 2024-2029 ($ million)
- Chart on Carts and tools - Year-over-year growth 2024-2029 (%)
- Data Table on Carts and tools - Year-over-year growth 2024-2029 (%)
- 8.5 Floor care supplies - Market size and forecast 2024-2029
- Chart on Floor care supplies - Market size and forecast 2024-2029 ($ million)
- Data Table on Floor care supplies - Market size and forecast 2024-2029 ($ million)
- Chart on Floor care supplies - Year-over-year growth 2024-2029 (%)
- Data Table on Floor care supplies - Year-over-year growth 2024-2029 (%)
- 8.6 Disposables - Market size and forecast 2024-2029
- Chart on Disposables - Market size and forecast 2024-2029 ($ million)
- Data Table on Disposables - Market size and forecast 2024-2029 ($ million)
- Chart on Disposables - Year-over-year growth 2024-2029 (%)
- Data Table on Disposables - Year-over-year growth 2024-2029 (%)
- 8.7 Market opportunity by Product Type
- Market opportunity by Product Type ($ million)
- Data Table on Market opportunity by Product Type ($ million)
9 Market Segmentation by End-user
- 9.1 Market segments
- Chart on End-user - Market share 2024-2029 (%)
- Data Table on End-user - Market share 2024-2029 (%)
- 9.2 Comparison by End-user
- Chart on Comparison by End-user
- Data Table on Comparison by End-user
- 9.3 Commercial - Market size and forecast 2024-2029
- Chart on Commercial - Market size and forecast 2024-2029 ($ million)
- Data Table on Commercial - Market size and forecast 2024-2029 ($ million)
- Chart on Commercial - Year-over-year growth 2024-2029 (%)
- Data Table on Commercial - Year-over-year growth 2024-2029 (%)
- 9.4 Residential - Market size and forecast 2024-2029
- Chart on Residential - Market size and forecast 2024-2029 ($ million)
- Data Table on Residential - Market size and forecast 2024-2029 ($ million)
- Chart on Residential - Year-over-year growth 2024-2029 (%)
- Data Table on Residential - Year-over-year growth 2024-2029 (%)
- 9.5 Market opportunity by End-user
- Market opportunity by End-user ($ million)
- Data Table on Market opportunity by End-user ($ million)
10 Customer Landscape
- 10.1 Customer landscape overview
- Analysis of price sensitivity, lifecycle, customer purchase basket, adoption rates, and purchase criteria
11 Geographic Landscape
- 11.1 Geographic segmentation
- Chart on Market share By Geographical Landscape 2024-2029 (%)
- Data Table on Market share By Geographical Landscape 2024-2029 (%)
- 11.2 Geographic comparison
- Chart on Geographic comparison
- Data Table on Geographic comparison
- 11.3 North America - Market size and forecast 2024-2029
- Chart on North America - Market size and forecast 2024-2029 ($ million)
- Data Table on North America - Market size and forecast 2024-2029 ($ million)
- Chart on North America - Year-over-year growth 2024-2029 (%)
- Data Table on North America - Year-over-year growth 2024-2029 (%)
- 11.4 Europe - Market size and forecast 2024-2029
- Chart on Europe - Market size and forecast 2024-2029 ($ million)
- Data Table on Europe - Market size and forecast 2024-2029 ($ million)
- Chart on Europe - Year-over-year growth 2024-2029 (%)
- Data Table on Europe - Year-over-year growth 2024-2029 (%)
- 11.5 APAC - Market size and forecast 2024-2029
- Chart on APAC - Market size and forecast 2024-2029 ($ million)
- Data Table on APAC - Market size and forecast 2024-2029 ($ million)
- Chart on APAC - Year-over-year growth 2024-2029 (%)
- Data Table on APAC - Year-over-year growth 2024-2029 (%)
- 11.6 South America - Market size and forecast 2024-2029
- Chart on South America - Market size and forecast 2024-2029 ($ million)
- Data Table on South America - Market size and forecast 2024-2029 ($ million)
- Chart on South America - Year-over-year growth 2024-2029 (%)
- Data Table on South America - Year-over-year growth 2024-2029 (%)
- 11.7 Middle East and Africa - Market size and forecast 2024-2029
- Chart on Middle East and Africa - Market size and forecast 2024-2029 ($ million)
- Data Table on Middle East and Africa - Market size and forecast 2024-2029 ($ million)
- Chart on Middle East and Africa - Year-over-year growth 2024-2029 (%)
- Data Table on Middle East and Africa - Year-over-year growth 2024-2029 (%)
- 11.8 US - Market size and forecast 2024-2029
- Chart on US - Market size and forecast 2024-2029 ($ million)
- Data Table on US - Market size and forecast 2024-2029 ($ million)
- Chart on US - Year-over-year growth 2024-2029 (%)
- Data Table on US - Year-over-year growth 2024-2029 (%)
- 11.9 China - Market size and forecast 2024-2029
- Chart on China - Market size and forecast 2024-2029 ($ million)
- Data Table on China - Market size and forecast 2024-2029 ($ million)
- Chart on China - Year-over-year growth 2024-2029 (%)
- Data Table on China - Year-over-year growth 2024-2029 (%)
- 11.10 Germany - Market size and forecast 2024-2029
- Chart on Germany - Market size and forecast 2024-2029 ($ million)
- Data Table on Germany - Market size and forecast 2024-2029 ($ million)
- Chart on Germany - Year-over-year growth 2024-2029 (%)
- Data Table on Germany - Year-over-year growth 2024-2029 (%)
- 11.11 UK - Market size and forecast 2024-2029
- Chart on UK - Market size and forecast 2024-2029 ($ million)
- Data Table on UK - Market size and forecast 2024-2029 ($ million)
- Chart on UK - Year-over-year growth 2024-2029 (%)
- Data Table on UK - Year-over-year growth 2024-2029 (%)
- 11.12 Japan - Market size and forecast 2024-2029
- Chart on Japan - Market size and forecast 2024-2029 ($ million)
- Data Table on Japan - Market size and forecast 2024-2029 ($ million)
- Chart on Japan - Year-over-year growth 2024-2029 (%)
- Data Table on Japan - Year-over-year growth 2024-2029 (%)
- 11.13 India - Market size and forecast 2024-2029
- Chart on India - Market size and forecast 2024-2029 ($ million)
- Data Table on India - Market size and forecast 2024-2029 ($ million)
- Chart on India - Year-over-year growth 2024-2029 (%)
- Data Table on India - Year-over-year growth 2024-2029 (%)
- 11.14 Canada - Market size and forecast 2024-2029
- Chart on Canada - Market size and forecast 2024-2029 ($ million)
- Data Table on Canada - Market size and forecast 2024-2029 ($ million)
- Chart on Canada - Year-over-year growth 2024-2029 (%)
- Data Table on Canada - Year-over-year growth 2024-2029 (%)
- 11.15 France - Market size and forecast 2024-2029
- Chart on France - Market size and forecast 2024-2029 ($ million)
- Data Table on France - Market size and forecast 2024-2029 ($ million)
- Chart on France - Year-over-year growth 2024-2029 (%)
- Data Table on France - Year-over-year growth 2024-2029 (%)
- 11.16 Italy - Market size and forecast 2024-2029
- Chart on Italy - Market size and forecast 2024-2029 ($ million)
- Data Table on Italy - Market size and forecast 2024-2029 ($ million)
- Chart on Italy - Year-over-year growth 2024-2029 (%)
- Data Table on Italy - Year-over-year growth 2024-2029 (%)
- 11.17 Brazil - Market size and forecast 2024-2029
- Chart on Brazil - Market size and forecast 2024-2029 ($ million)
- Data Table on Brazil - Market size and forecast 2024-2029 ($ million)
- Chart on Brazil - Year-over-year growth 2024-2029 (%)
- Data Table on Brazil - Year-over-year growth 2024-2029 (%)
- 11.18 Market opportunity By Geographical Landscape
- Market opportunity By Geographical Landscape ($ million)
- Data Tables on Market opportunity By Geographical Landscape ($ million)
12 Drivers, Challenges, and Opportunity/Restraints
- 12.1 Market drivers
- 12.2 Market challenges
- 12.3 Impact of drivers and challenges
- Impact of drivers and challenges in 2024 and 2029
- 12.4 Market opportunities/restraints
13 Competitive Landscape
- 13.1 Overview
- 13.2 Competitive Landscape
- Overview on criticality of inputs and factors of differentiation
- 13.3 Landscape disruption
- Overview on factors of disruption
- 13.4 Industry risks
- Impact of key risks on business
14 Competitive Analysis
- 14.1 Companies profiled
- Companies covered
- 14.2 Company ranking index
- Company ranking index
- 14.3 Market positioning of companies
- Matrix on companies position and classification
- 3M Co.
- 3M Co. - Overview
- 3M Co. - Business segments
- 3M Co. - Key news
- 3M Co. - Key offerings
- 3M Co. - Segment focus
- SWOT
- 14.5 Alfred Karcher SE and Co. KG
- Alfred Karcher SE and Co. KG - Overview
- Alfred Karcher SE and Co. KG - Product / Service
- Alfred Karcher SE and Co. KG - Key offerings
- SWOT
- 14.6 Diversey Inc.
- Diversey Inc. - Overview
- Diversey Inc. - Product / Service
- Diversey Inc. - Key offerings
- SWOT
- 14.7 Ecolab Inc.
- Ecolab Inc. - Overview
- Ecolab Inc. - Business segments
- Ecolab Inc. - Key news
- Ecolab Inc. - Key offerings
- Ecolab Inc. - Segment focus
- SWOT
- 14.8 Electrolux Professional AB
- Electrolux Professional AB - Overview
- Electrolux Professional AB - Business segments
- Electrolux Professional AB - Key news
- Electrolux Professional AB - Key offerings
- Electrolux Professional AB - Segment focus
- SWOT
- 14.9 Eureka SpA
- Eureka SpA - Overview
- Eureka SpA - Product / Service
- Eureka SpA - Key offerings
- SWOT
- 14.10 Evonik Industries AG
- Evonik Industries AG - Overview
- Evonik Industries AG - Business segments
- Evonik Industries AG - Key news
- Evonik Industries AG - Key offerings
- Evonik Industries AG - Segment focus
- SWOT
- 14.11 Kimberly Clark Corp.
- Kimberly Clark Corp. - Overview
- Kimberly Clark Corp. - Business segments
- Kimberly Clark Corp. - Key news
- Kimberly Clark Corp. - Key offerings
- Kimberly Clark Corp. - Segment focus
- SWOT
- 14.12 Newell Brands Inc.
- Newell Brands Inc. - Overview
- Newell Brands Inc. - Business segments
- Newell Brands Inc. - Key news
- Newell Brands Inc. - Key offerings
- Newell Brands Inc. - Segment focus
- SWOT
- 14.13 Reckitt Benckiser Group Plc
- Reckitt Benckiser Group Plc - Overview
- Reckitt Benckiser Group Plc - Business segments
- Reckitt Benckiser Group Plc - Key news
- Reckitt Benckiser Group Plc - Key offerings
- Reckitt Benckiser Group Plc - Segment focus
- SWOT
- 14.14 S.C. Johnson and Son Inc.
- S.C. Johnson and Son Inc. - Overview
- S.C. Johnson and Son Inc. - Product / Service
- S.C. Johnson and Son Inc. - Key offerings
- SWOT
- 14.15 Tennant Co.
- Tennant Co. - Overview
- Tennant Co. - Business segments
- Tennant Co. - Key offerings
- Tennant Co. - Segment focus
- SWOT
- 14.16 The Clorox Co.
- The Clorox Co. - Overview
- The Clorox Co. - Business segments
- The Clorox Co. - Key news
- The Clorox Co. - Key offerings
- The Clorox Co. - Segment focus
- SWOT
- 14.17 The Procter and Gamble Co.
- The Procter and Gamble Co. - Overview
- The Procter and Gamble Co. - Business segments
- The Procter and Gamble Co. - Key offerings
- The Procter and Gamble Co. - Segment focus
- SWOT
- 14.18 Unilever PLC
- Unilever PLC - Overview
- Unilever PLC - Business segments
- Unilever PLC - Key offerings
- Unilever PLC - Segment focus
- SWOT
15 Appendix
- 15.1 Scope of the report
- 15.2 Inclusions and exclusions checklist
- Inclusions checklist
- Exclusions checklist
- 15.3 Currency conversion rates for US$
- Currency conversion rates for US$
- 15.4 Research methodology
- Research methodology
- 15.5 Data procurement
- Information sources
- 15.6 Data validation
- Data validation
- 15.7 Validation techniques employed for market sizing
- Validation techniques employed for market sizing
- 15.8 Data synthesis
- Data synthesis
- 15.9 360 degree market analysis
- 360 degree market analysis
- 15.10 List of abbreviations
- List of abbreviations

