|
|
市場調査レポート
商品コード
1653015
産業用クリーニングサービスの世界市場、2025-2029年Global Industrial Cleaning Services Market 2025-2029 |
||||||

|
|||||||
カスタマイズ可能
|
|||||||


| 産業用クリーニングサービスの世界市場、2025-2029年 |
|
出版日: 2025年02月01日
発行: TechNavio
ページ情報: 英文 210 Pages
納期: 即納可能
|

全表示
- 概要
- 目次
産業用クリーニングサービス市場は2024-2029年に189億米ドル、予測期間中のCAGRは6%で成長すると予測されます。
当レポートでは、産業用クリーニングサービス市場の全体的な分析、市場規模・予測、動向、成長促進要因、課題、約25のベンダーを網羅したベンダー分析などを掲載しています。
現在の市場シナリオ、最新動向と促進要因、市場環境全体に関する最新分析を提供しています。この市場を牽引しているのは、職場のウェルネスと持続可能性に関する意識の高まり、オフィススペースの増加、産業用クリーニングにおける低毒性物質への需要の高まりなどです。
| 市場範囲 | |
|---|---|
| 基準年 | 2025 |
| 終了年 | 2029 |
| 予測期間 | 2025-2029 |
| 成長モメンタム | 加速 |
| 前年比2025年 | 5.7% |
| CAGR | 6% |
| 増分額 | 189億米ドル |
本調査は、業界の主要参加者からのインプットを含め、一次情報と二次情報を客観的に組み合わせて実施しました。レポートには、主要企業の分析に加え、包括的な市場規模データ、地域別分析によるセグメント、ベンダー情勢が含まれています。レポートには過去データと予測データがあります。
本調査では、今後数年間の産業用クリーニングサービス市場の成長を促進する主な要因の1つとして、クリーニングロボットの導入を挙げています。また、再生可能クリーニングの人気の高まりや、産業用クリーニングにおける拡張現実(AR)の採用は、市場の大きな需要につながるでしょう。
目次
第1章 エグゼクティブサマリー
- 市場概要
第2章 Technavio分析
- 価格・ライフサイクル・顧客購入バスケット・採用率・購入基準の分析
- インプットの重要性と差別化の要因
- 混乱の要因
- 促進要因と課題の影響
第3章 市場情勢
- 市場エコシステム
- 市場の特徴
- バリューチェーン分析
第4章 市場規模
- 市場の定義
- 市場セグメント分析
- 市場規模 2024
- 市場の見通し 2024-2029
第5章 市場規模実績
- 産業用クリーニングサービスの世界市場 2019-2023
- 用途別セグメント分析 2019-2023
- エンドユーザーセグメント分析 2019-2023
- 地域別セグメント分析 2019-2023
- 国別セグメント分析 2019-2023
第6章 定性分析
- AIの影響:産業用クリーニングサービスの世界市場
第7章 ファイブフォース分析
- ファイブフォースの要約
- 買い手の交渉力
- 供給企業の交渉力
- 新規参入業者の脅威
- 代替品の脅威
- 競争の脅威
- 市況
第8章 市場セグメンテーション:用途別
- 市場セグメント
- 比較:用途別
- 機器の清掃:市場規模と予測 2024-2029
- 生産現場の清掃:市場規模と予測 2024-2029
- 公共エリアの清掃:市場規模と予測 2024-2029
- 窓の清掃:市場規模と予測 2024-2029
- 市場機会:用途別
第9章 市場セグメンテーション:エンドユーザー別
- 市場セグメント
- 比較:エンドユーザー別
- 製造および商業オフィス:市場規模と予測 2024-2029
- 製薬業界:市場規模と予測 2024-2029
- 石油・ガス・石油化学産業:市場規模と予測 2024-2029
- 食品・飲料業界:市場規模と予測 2024-2029
- その他:市場規模と予測 2024-2029
- 市場機会:エンドユーザー別
第10章 顧客情勢
- 顧客情勢の概要
第11章 地域別情勢
- 地域別セグメンテーション
- 地域別比較
- アジア太平洋:市場規模と予測 2024-2029
- 北米:市場規模と予測 2024-2029
- 欧州:市場規模と予測 2024-2029
- 南米:市場規模と予測 2024-2029
- 中東・アフリカ:市場規模と予測 2024-2029
- 米国:市場規模と予測 2024-2029
- 中国:市場規模と予測 2024-2029
- 日本:市場規模と予測 2024-2029
- インド:市場規模と予測 2024-2029
- ドイツ:市場規模と予測 2024-2029
- 韓国:市場規模と予測 2024-2029
- フランス:市場規模と予測 2024-2029
- カナダ:市場規模と予測 2024-2029
- 英国:市場規模と予測 2024-2029
- オーストラリア:市場規模と予測 2024-2029
- 市場機会:地域情勢別
第12章 促進要因・課題・機会・抑制要因
- 市場促進要因
- 市場の課題
- 促進要因と課題の影響
- 市場の機会・抑制要因
第13章 競合情勢
- 概要
- 競合情勢
- 混乱の状況
- 業界のリスク
第14章 競合分析
- 企業プロファイル
- 企業ランキング指数
- 企業の市場ポジショニング
- ABM Industries Inc.
- Anago Cleaning Systems Inc.
- AVEX Building Solutions
- Clean Co Systems
- Ecoserv Group
- EnviroVac
- GDI Integrated Facility Services
- Imperial Cleaning
- JAN PRO Franchising International Inc.
- Jani King International Inc.
- K2 Industrial Services Inc.
- OCS Group International Ltd.
- Servpro Industries LLC
- The ServiceMaster Co. LLC
- Vanguard Cleaning Systems Inc.
第15章 付録
The industrial cleaning services market is forecasted to grow by USD 18.9 bn during 2024-2029, accelerating at a CAGR of 6% during the forecast period. The report on the industrial cleaning services market provides a holistic analysis, market size and forecast, trends, growth drivers, and challenges, as well as vendor analysis covering around 25 vendors.
The report offers an up-to-date analysis regarding the current market scenario, the latest trends and drivers, and the overall market environment. The market is driven by rising awareness about workplace wellness and sustainability, growing number of office spaces, and increasing demand for less toxic substances for industrial cleaning.
| Market Scope | |
|---|---|
| Base Year | 2025 |
| End Year | 2029 |
| Series Year | 2025-2029 |
| Growth Momentum | Accelerate |
| YOY 2025 | 5.7% |
| CAGR | 6% |
| Incremental Value | $18.9 bn |
The study was conducted using an objective combination of primary and secondary information including inputs from key participants in the industry. The report contains a comprehensive market size data, segment with regional analysis and vendor landscape in addition to an analysis of the key companies. Reports have historic and forecast data.
Technavio's industrial cleaning services market is segmented as below:
By Application
- Equipment cleaning
- Shop floor cleaning
- Public area cleaning
- Window cleaning
By End-user
- Manufacturing and commercial offices
- Pharmaceutical industry
- Oil and gas and petrochemical industry
- Food and beverage industry
- Others
By Geographical Landscape
- APAC
- North America
- Europe
- South America
- Middle East and Africa
This study identifies the introduction of cleaning robots as one of the prime reasons driving the industrial cleaning services market growth during the next few years. Also, rising popularity of renewable cleaning and adoption of augmented reality in industrial cleaning will lead to sizable demand in the market.
The report on the industrial cleaning services market covers the following areas:
- Industrial Cleaning Services Market sizing
- Industrial Cleaning Services Market forecast
- Industrial Cleaning Services Market industry analysis
The robust vendor analysis is designed to help clients improve their market position, and in line with this, this report provides a detailed analysis of several leading industrial cleaning services market vendors that include ABM Industries Inc., Anago Cleaning Systems Inc., AVEX Building Solutions, BELFOR Holdings Inc., Clean Co Systems, Ecoserv Group, EnviroVac, GDI Integrated Facility Services, Imperial Cleaning, JAN PRO Franchising International Inc., Jani King International Inc., K2 Industrial Services Inc., Nugent Contract Cleaning, OCS Group International Ltd., OpenWorks, Pritchard Industries Inc., Servpro Industries LLC, Stratus Building Solutions, The ServiceMaster Co. LLC, and Vanguard Cleaning Systems Inc.. Also, the industrial cleaning services market analysis report includes information on upcoming trends and challenges that will influence market growth. This is to help companies strategize and leverage all forthcoming growth opportunities.
The publisher presents a detailed picture of the market by the way of study, synthesis, and summation of data from multiple sources by an analysis of key parameters such as profit, pricing, competition, and promotions. It presents various market facets by identifying the key industry influencers. The data presented is comprehensive, reliable, and a result of extensive primary and secondary research. The market research reports provide a complete competitive landscape and an in-depth vendor selection methodology and analysis using qualitative and quantitative research to forecast accurate market growth.
Table of Contents
1 Executive Summary
- 1.1 Market overview
- Executive Summary - Chart on Market Overview
- Executive Summary - Data Table on Market Overview
- Executive Summary - Chart on Global Market Characteristics
- Executive Summary - Chart on Market By Geographical Landscape
- Executive Summary - Chart on Market Segmentation by Application
- Executive Summary - Chart on Market Segmentation by End-user
- Executive Summary - Chart on Incremental Growth
- Executive Summary - Data Table on Incremental Growth
- Executive Summary - Chart on Company Market Positioning
2 Technavio Analysis
- 2.1 Analysis of price sensitivity, lifecycle, customer purchase basket, adoption rates, and purchase criteria
- Analysis of price sensitivity, lifecycle, customer purchase basket, adoption rates, and purchase criteria
- 2.2 Criticality of inputs and Factors of differentiation
- Overview on criticality of inputs and factors of differentiation
- 2.3 Factors of disruption
- Overview on factors of disruption
- 2.4 Impact of drivers and challenges
- Impact of drivers and challenges in 2024 and 2029
3 Market Landscape
- 3.1 Market ecosystem
- Parent Market
- Data Table on - Parent Market
- 3.2 Market characteristics
- Market characteristics analysis
- 3.3 Value chain analysis
- Value chain analysis
4 Market Sizing
- 4.1 Market definition
- Offerings of companies included in the market definition
- 4.2 Market segment analysis
- Market segments
- 4.3 Market size 2024
- 4.4 Market outlook: Forecast for 2024-2029
- Chart on Global - Market size and forecast 2024-2029 ($ billion)
- Data Table on Global - Market size and forecast 2024-2029 ($ billion)
- Chart on Global Market: Year-over-year growth 2024-2029 (%)
- Data Table on Global Market: Year-over-year growth 2024-2029 (%)
5 Historic Market Size
- 5.1 Global Industrial Cleaning Services Market 2019 - 2023
- Historic Market Size - Data Table on Global Industrial Cleaning Services Market 2019 - 2023 ($ billion)
- 5.2 Application segment analysis 2019 - 2023
- Historic Market Size - Application Segment 2019 - 2023 ($ billion)
- 5.3 End-user segment analysis 2019 - 2023
- Historic Market Size - End-user Segment 2019 - 2023 ($ billion)
- 5.4 Geography segment analysis 2019 - 2023
- Historic Market Size - Geography Segment 2019 - 2023 ($ billion)
- 5.5 Country segment analysis 2019 - 2023
- Historic Market Size - Country Segment 2019 - 2023 ($ billion)
6 Qualitative Analysis
- 6.1 Impact of AI on Global Industrial Cleaning Services Market
7 Five Forces Analysis
- 7.1 Five forces summary
- Five forces analysis - Comparison between 2024 and 2029
- 7.2 Bargaining power of buyers
- Bargaining power of buyers - Impact of key factors 2024 and 2029
- 7.3 Bargaining power of suppliers
- Bargaining power of suppliers - Impact of key factors in 2024 and 2029
- 7.4 Threat of new entrants
- Threat of new entrants - Impact of key factors in 2024 and 2029
- 7.5 Threat of substitutes
- Threat of substitutes - Impact of key factors in 2024 and 2029
- 7.6 Threat of rivalry
- Threat of rivalry - Impact of key factors in 2024 and 2029
- 7.7 Market condition
- Chart on Market condition - Five forces 2024 and 2029
8 Market Segmentation by Application
- 8.1 Market segments
- Chart on Application - Market share 2024-2029 (%)
- Data Table on Application - Market share 2024-2029 (%)
- 8.2 Comparison by Application
- Chart on Comparison by Application
- Data Table on Comparison by Application
- 8.3 Equipment cleaning - Market size and forecast 2024-2029
- Chart on Equipment cleaning - Market size and forecast 2024-2029 ($ billion)
- Data Table on Equipment cleaning - Market size and forecast 2024-2029 ($ billion)
- Chart on Equipment cleaning - Year-over-year growth 2024-2029 (%)
- Data Table on Equipment cleaning - Year-over-year growth 2024-2029 (%)
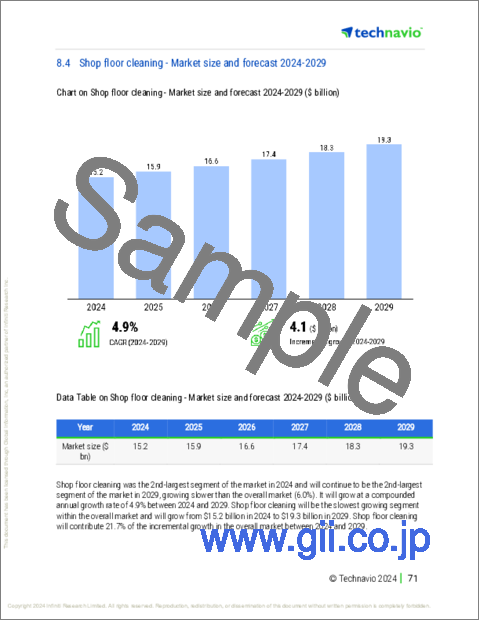
- 8.4 Shop floor cleaning - Market size and forecast 2024-2029
- Chart on Shop floor cleaning - Market size and forecast 2024-2029 ($ billion)
- Data Table on Shop floor cleaning - Market size and forecast 2024-2029 ($ billion)
- Chart on Shop floor cleaning - Year-over-year growth 2024-2029 (%)
- Data Table on Shop floor cleaning - Year-over-year growth 2024-2029 (%)
- 8.5 Public area cleaning - Market size and forecast 2024-2029
- Chart on Public area cleaning - Market size and forecast 2024-2029 ($ billion)
- Data Table on Public area cleaning - Market size and forecast 2024-2029 ($ billion)
- Chart on Public area cleaning - Year-over-year growth 2024-2029 (%)
- Data Table on Public area cleaning - Year-over-year growth 2024-2029 (%)
- 8.6 Window cleaning - Market size and forecast 2024-2029
- Chart on Window cleaning - Market size and forecast 2024-2029 ($ billion)
- Data Table on Window cleaning - Market size and forecast 2024-2029 ($ billion)
- Chart on Window cleaning - Year-over-year growth 2024-2029 (%)
- Data Table on Window cleaning - Year-over-year growth 2024-2029 (%)
- 8.7 Market opportunity by Application
- Market opportunity by Application ($ billion)
- Data Table on Market opportunity by Application ($ billion)
9 Market Segmentation by End-user
- 9.1 Market segments
- Chart on End-user - Market share 2024-2029 (%)
- Data Table on End-user - Market share 2024-2029 (%)
- 9.2 Comparison by End-user
- Chart on Comparison by End-user
- Data Table on Comparison by End-user
- 9.3 Manufacturing and commercial offices - Market size and forecast 2024-2029
- Chart on Manufacturing and commercial offices - Market size and forecast 2024-2029 ($ billion)
- Data Table on Manufacturing and commercial offices - Market size and forecast 2024-2029 ($ billion)
- Chart on Manufacturing and commercial offices - Year-over-year growth 2024-2029 (%)
- Data Table on Manufacturing and commercial offices - Year-over-year growth 2024-2029 (%)
- 9.4 Pharmaceutical industry - Market size and forecast 2024-2029
- Chart on Pharmaceutical industry - Market size and forecast 2024-2029 ($ billion)
- Data Table on Pharmaceutical industry - Market size and forecast 2024-2029 ($ billion)
- Chart on Pharmaceutical industry - Year-over-year growth 2024-2029 (%)
- Data Table on Pharmaceutical industry - Year-over-year growth 2024-2029 (%)
- 9.5 Oil and gas and petrochemical industry - Market size and forecast 2024-2029
- Chart on Oil and gas and petrochemical industry - Market size and forecast 2024-2029 ($ billion)
- Data Table on Oil and gas and petrochemical industry - Market size and forecast 2024-2029 ($ billion)
- Chart on Oil and gas and petrochemical industry - Year-over-year growth 2024-2029 (%)
- Data Table on Oil and gas and petrochemical industry - Year-over-year growth 2024-2029 (%)
- 9.6 Food and beverage industry - Market size and forecast 2024-2029
- Chart on Food and beverage industry - Market size and forecast 2024-2029 ($ billion)
- Data Table on Food and beverage industry - Market size and forecast 2024-2029 ($ billion)
- Chart on Food and beverage industry - Year-over-year growth 2024-2029 (%)
- Data Table on Food and beverage industry - Year-over-year growth 2024-2029 (%)
- 9.7 Others - Market size and forecast 2024-2029
- Chart on Others - Market size and forecast 2024-2029 ($ billion)
- Data Table on Others - Market size and forecast 2024-2029 ($ billion)
- Chart on Others - Year-over-year growth 2024-2029 (%)
- Data Table on Others - Year-over-year growth 2024-2029 (%)
- 9.8 Market opportunity by End-user
- Market opportunity by End-user ($ billion)
- Data Table on Market opportunity by End-user ($ billion)
10 Customer Landscape
- 10.1 Customer landscape overview
- Analysis of price sensitivity, lifecycle, customer purchase basket, adoption rates, and purchase criteria
11 Geographic Landscape
- 11.1 Geographic segmentation
- Chart on Market share By Geographical Landscape 2024-2029 (%)
- Data Table on Market share By Geographical Landscape 2024-2029 (%)
- 11.2 Geographic comparison
- Chart on Geographic comparison
- Data Table on Geographic comparison
- 11.3 APAC - Market size and forecast 2024-2029
- Chart on APAC - Market size and forecast 2024-2029 ($ billion)
- Data Table on APAC - Market size and forecast 2024-2029 ($ billion)
- Chart on APAC - Year-over-year growth 2024-2029 (%)
- Data Table on APAC - Year-over-year growth 2024-2029 (%)
- 11.4 North America - Market size and forecast 2024-2029
- Chart on North America - Market size and forecast 2024-2029 ($ billion)
- Data Table on North America - Market size and forecast 2024-2029 ($ billion)
- Chart on North America - Year-over-year growth 2024-2029 (%)
- Data Table on North America - Year-over-year growth 2024-2029 (%)
- 11.5 Europe - Market size and forecast 2024-2029
- Chart on Europe - Market size and forecast 2024-2029 ($ billion)
- Data Table on Europe - Market size and forecast 2024-2029 ($ billion)
- Chart on Europe - Year-over-year growth 2024-2029 (%)
- Data Table on Europe - Year-over-year growth 2024-2029 (%)
- 11.6 South America - Market size and forecast 2024-2029
- Chart on South America - Market size and forecast 2024-2029 ($ billion)
- Data Table on South America - Market size and forecast 2024-2029 ($ billion)
- Chart on South America - Year-over-year growth 2024-2029 (%)
- Data Table on South America - Year-over-year growth 2024-2029 (%)
- 11.7 Middle East and Africa - Market size and forecast 2024-2029
- Chart on Middle East and Africa - Market size and forecast 2024-2029 ($ billion)
- Data Table on Middle East and Africa - Market size and forecast 2024-2029 ($ billion)
- Chart on Middle East and Africa - Year-over-year growth 2024-2029 (%)
- Data Table on Middle East and Africa - Year-over-year growth 2024-2029 (%)
- 11.8 US - Market size and forecast 2024-2029
- Chart on US - Market size and forecast 2024-2029 ($ billion)
- Data Table on US - Market size and forecast 2024-2029 ($ billion)
- Chart on US - Year-over-year growth 2024-2029 (%)
- Data Table on US - Year-over-year growth 2024-2029 (%)
- 11.9 China - Market size and forecast 2024-2029
- Chart on China - Market size and forecast 2024-2029 ($ billion)
- Data Table on China - Market size and forecast 2024-2029 ($ billion)
- Chart on China - Year-over-year growth 2024-2029 (%)
- Data Table on China - Year-over-year growth 2024-2029 (%)
- 11.10 Japan - Market size and forecast 2024-2029
- Chart on Japan - Market size and forecast 2024-2029 ($ billion)
- Data Table on Japan - Market size and forecast 2024-2029 ($ billion)
- Chart on Japan - Year-over-year growth 2024-2029 (%)
- Data Table on Japan - Year-over-year growth 2024-2029 (%)
- 11.11 India - Market size and forecast 2024-2029
- Chart on India - Market size and forecast 2024-2029 ($ billion)
- Data Table on India - Market size and forecast 2024-2029 ($ billion)
- Chart on India - Year-over-year growth 2024-2029 (%)
- Data Table on India - Year-over-year growth 2024-2029 (%)
- 11.12 Germany - Market size and forecast 2024-2029
- Chart on Germany - Market size and forecast 2024-2029 ($ billion)
- Data Table on Germany - Market size and forecast 2024-2029 ($ billion)
- Chart on Germany - Year-over-year growth 2024-2029 (%)
- Data Table on Germany - Year-over-year growth 2024-2029 (%)
- 11.13 South Korea - Market size and forecast 2024-2029
- Chart on South Korea - Market size and forecast 2024-2029 ($ billion)
- Data Table on South Korea - Market size and forecast 2024-2029 ($ billion)
- Chart on South Korea - Year-over-year growth 2024-2029 (%)
- Data Table on South Korea - Year-over-year growth 2024-2029 (%)
- 11.14 France - Market size and forecast 2024-2029
- Chart on France - Market size and forecast 2024-2029 ($ billion)
- Data Table on France - Market size and forecast 2024-2029 ($ billion)
- Chart on France - Year-over-year growth 2024-2029 (%)
- Data Table on France - Year-over-year growth 2024-2029 (%)
- 11.15 Canada - Market size and forecast 2024-2029
- Chart on Canada - Market size and forecast 2024-2029 ($ billion)
- Data Table on Canada - Market size and forecast 2024-2029 ($ billion)
- Chart on Canada - Year-over-year growth 2024-2029 (%)
- Data Table on Canada - Year-over-year growth 2024-2029 (%)
- 11.16 UK - Market size and forecast 2024-2029
- Chart on UK - Market size and forecast 2024-2029 ($ billion)
- Data Table on UK - Market size and forecast 2024-2029 ($ billion)
- Chart on UK - Year-over-year growth 2024-2029 (%)
- Data Table on UK - Year-over-year growth 2024-2029 (%)
- 11.17 Australia - Market size and forecast 2024-2029
- Chart on Australia - Market size and forecast 2024-2029 ($ billion)
- Data Table on Australia - Market size and forecast 2024-2029 ($ billion)
- Chart on Australia - Year-over-year growth 2024-2029 (%)
- Data Table on Australia - Year-over-year growth 2024-2029 (%)
- 11.18 Market opportunity By Geographical Landscape
- Market opportunity By Geographical Landscape ($ billion)
- Data Tables on Market opportunity By Geographical Landscape ($ billion)
12 Drivers, Challenges, and Opportunity/Restraints
- 12.1 Market drivers
- 12.2 Market challenges
- 12.3 Impact of drivers and challenges
- Impact of drivers and challenges in 2024 and 2029
- 12.4 Market opportunities/restraints
13 Competitive Landscape
- 13.1 Overview
- 13.2 Competitive Landscape
- Overview on criticality of inputs and factors of differentiation
- 13.3 Landscape disruption
- Overview on factors of disruption
- 13.4 Industry risks
- Impact of key risks on business
14 Competitive Analysis
- 14.1 Companies profiled
- Companies covered
- 14.2 Company ranking index
- Company ranking index
- 14.3 Market positioning of companies
- Matrix on companies position and classification
- 14.4 ABM Industries Inc.
- ABM Industries Inc. - Overview
- ABM Industries Inc. - Business segments
- ABM Industries Inc. - Key offerings
- ABM Industries Inc. - Segment focus
- SWOT
- 14.5 Anago Cleaning Systems Inc.
- Anago Cleaning Systems Inc. - Overview
- Anago Cleaning Systems Inc. - Product / Service
- Anago Cleaning Systems Inc. - Key offerings
- SWOT
- 14.6 AVEX Building Solutions
- AVEX Building Solutions - Overview
- AVEX Building Solutions - Product / Service
- AVEX Building Solutions - Key offerings
- SWOT
- 14.7 Clean Co Systems
- Clean Co Systems - Overview
- Clean Co Systems - Product / Service
- Clean Co Systems - Key offerings
- SWOT
- 14.8 Ecoserv Group
- Ecoserv Group - Overview
- Ecoserv Group - Product / Service
- Ecoserv Group - Key offerings
- SWOT
- 14.9 EnviroVac
- EnviroVac - Overview
- EnviroVac - Product / Service
- EnviroVac - Key offerings
- SWOT
- 14.10 GDI Integrated Facility Services
- GDI Integrated Facility Services - Overview
- GDI Integrated Facility Services - Product / Service
- GDI Integrated Facility Services - Key offerings
- SWOT
- 14.11 Imperial Cleaning
- Imperial Cleaning - Overview
- Imperial Cleaning - Product / Service
- Imperial Cleaning - Key offerings
- SWOT
- 14.12 JAN PRO Franchising International Inc.
- JAN PRO Franchising International Inc. - Overview
- JAN PRO Franchising International Inc. - Product / Service
- JAN PRO Franchising International Inc. - Key offerings
- SWOT
- 14.13 Jani King International Inc.
- Jani King International Inc. - Overview
- Jani King International Inc. - Product / Service
- Jani King International Inc. - Key offerings
- SWOT
- 14.14 K2 Industrial Services Inc.
- K2 Industrial Services Inc. - Overview
- K2 Industrial Services Inc. - Product / Service
- K2 Industrial Services Inc. - Key offerings
- SWOT
- 14.15 OCS Group International Ltd.
- OCS Group International Ltd. - Overview
- OCS Group International Ltd. - Product / Service
- OCS Group International Ltd. - Key offerings
- SWOT
- 14.16 Servpro Industries LLC
- Servpro Industries LLC - Overview
- Servpro Industries LLC - Product / Service
- Servpro Industries LLC - Key offerings
- SWOT
- 14.17 The ServiceMaster Co. LLC
- The ServiceMaster Co. LLC - Overview
- The ServiceMaster Co. LLC - Product / Service
- The ServiceMaster Co. LLC - Key offerings
- SWOT
- 14.18 Vanguard Cleaning Systems Inc.
- Vanguard Cleaning Systems Inc. - Overview
- Vanguard Cleaning Systems Inc. - Product / Service
- Vanguard Cleaning Systems Inc. - Key offerings
- SWOT
15 Appendix
- 15.1 Scope of the report
- 15.2 Inclusions and exclusions checklist
- Inclusions checklist
- Exclusions checklist
- 15.3 Currency conversion rates for US$
- Currency conversion rates for US$
- 15.4 Research methodology
- Research methodology
- 15.5 Data procurement
- Information sources
- 15.6 Data validation
- Data validation
- 15.7 Validation techniques employed for market sizing
- Validation techniques employed for market sizing
- 15.8 Data synthesis
- Data synthesis
- 15.9 360 degree market analysis
- 360 degree market analysis
- 15.10 List of abbreviations
- List of abbreviations

