|
|
市場調査レポート
商品コード
1975406
ホームWi-Fiルーターの世界市場 2026年~2030年Global Home Wi-Fi Router Market 2026-2030 |
||||||
|
|||||||
カスタマイズ可能
|
|||||||

| ホームWi-Fiルーターの世界市場 2026年~2030年 |
|
出版日: 2026年03月09日
発行: TechNavio
ページ情報: 英文 295 Pages
納期: 即納可能
|

概要
世界の家庭用Wi-Fiルーター市場は、2025年から2030年にかけて23億5,970万米ドルの成長が見込まれ、予測期間中のCAGRは8.6%と予測されております。
本報告書では、世界の家庭用Wi-Fiルーター市場に関する包括的な分析、市場規模と予測、動向、成長要因、課題に加え、約25社のベンダー分析を提供しております。
本レポートは、現在の市場状況、最新の動向と促進要因、市場環境全般に関する最新の分析を提供します。市場は、デバイス密度の増加とスマートホーム統合、高帯域幅コンテンツと低遅延アプリケーションの消費急増、技術進歩、Wi-Fi規格の固有のアップグレードサイクルによって牽引されています。
本調査は、業界の主要関係者からの情報を含む、一次情報と二次情報の客観的な組み合わせを用いて実施されました。本レポートには、主要企業の分析に加え、包括的な市場規模データ、地域別分析を伴うセグメント、ベンダー情勢が含まれています。レポートには過去データと予測データが掲載されています。
| 市場範囲 | |
|---|---|
| 基準年 | 2026年 |
| 終了年 | 2030年 |
| 予測期間 | 2026-2030 |
| 成長モメンタム | 加速 |
| 前年比2026年 | 8% |
| CAGR | 8.6% |
| 増分額 | 23億5,970万米ドル |
本調査では、今後数年間における世界のホームWi-Fiルーター市場の成長を牽引する主要要因の一つとして、メッシュネットワークシステムの主流化を挙げております。また、ネットワークの自動化と最適化のための人工知能の統合、ならびにネットワークとセキュリティの統合サービスプラットフォームへの収束が、市場において相当な需要を生み出すものと見込まれます。
目次
第1章 エグゼクティブサマリー
第2章 Technavio分析
- 価格・ライフサイクル・顧客購入バスケット・採用率・購入基準の分析
- インプットの重要性と差別化の要因
- 混乱の要因
- 促進要因と課題の影響
第3章 市場情勢
- 市場エコシステム
- 市場の特徴
- バリューチェーン分析
第4章 市場規模
- 市場の定義
- 市場セグメント分析
- 市場規模 2025
- 市場の見通し 2025-2030
第5章 市場規模実績
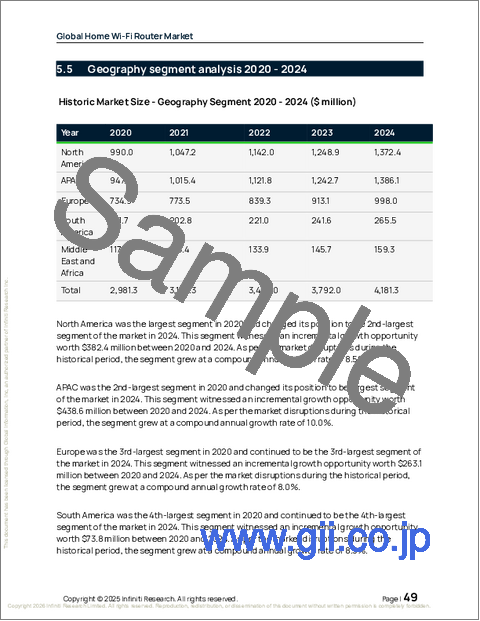
- ホームWi-Fiルーターの世界市場 2020-2024
- デバイスセグメント分析 2020-2024
- 流通チャネルセグメント分析 2020-2024
- 製品タイプセグメント分析 2020-2024
- 地域別セグメント分析 2020-2024
- 国別セグメント分析 2020-2024
第6章 定性分析
- AIの影響:ホームWi-Fiルーターの世界市場
- 地政学的紛争が及ぼす影響ホームWi-Fiルーターの世界市場
第7章 ファイブフォース分析
- ファイブフォースの要約
- 買い手の交渉力
- 供給企業の交渉力
- 新規参入業者の脅威
- 代替品の脅威
- 競争の脅威
- 市況
第8章 市場セグメンテーション:デバイス別
- 比較:デバイス別
- 固定Wi-Fiルーター
- モバイルWi-Fiルーター
- 市場機会:デバイス別
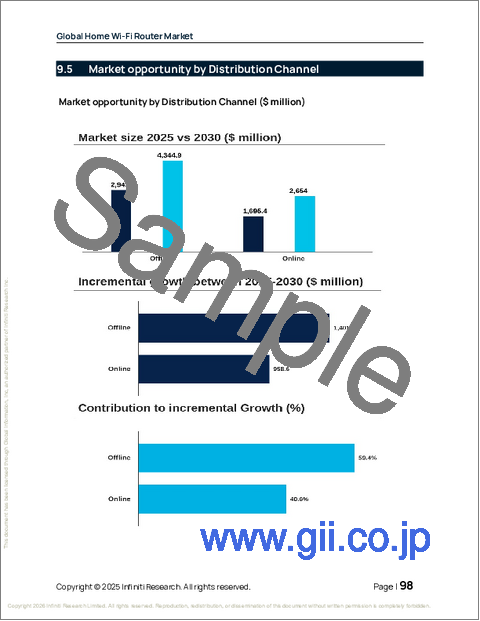
第9章 市場セグメンテーション:流通チャネル別
- 比較:流通チャネル別
- オフライン
- オンライン
- 市場機会:流通チャネル別
第10章 市場セグメンテーション:製品タイプ別
- 比較:製品タイプ別
- アップリンクポート
- 通常ポート
- 市場機会:製品タイプ別
第11章 顧客情勢
第12章 地域別情勢
- 地域別セグメンテーション
- 地域別比較
- アジア太平洋
- 中国
- 日本
- インド
- 韓国
- オーストラリア
- インドネシア
- 北米
- 米国
- カナダ
- メキシコ
- 欧州
- ドイツ
- 英国
- フランス
- イタリア
- スペイン
- オランダ
- 南米
- ブラジル
- アルゼンチン
- コロンビア
- 中東・アフリカ
- サウジアラビア
- アラブ首長国連邦
- 南アフリカ
- トルコ
- エジプト
- 市場機会:地域別
第13章 促進要因・課題・機会
- 市場促進要因
- 市場の課題
- 促進要因と課題の影響
- 市場機会
第14章 競合情勢
- 概要
- 競合情勢
- 混乱の状況
- 業界のリスク
第15章 競合分析
- 企業プロファイル
- 企業ランキング指標
- 企業の市場ポジショニング
- Amped Wireless
- ASUSTeK Computer Inc.
- Cisco Systems Inc.
- D Link Corp.
- Google LLC
- Hon Hai Precision. Ltd.
- Huawei Technologies Co. Ltd.
- Legrand SA
- NETGEAR Inc.
- Nokia Corp.
- Samsung Electronics Co. Ltd.
- TP Link Corp. Ltd.
- Ubiquiti Inc.
- Verizon Communications Inc.
- ZTE Corp.
