|
|
市場調査レポート
商品コード
1645584
コーディング・ブートキャンプの世界市場 2025~2029年Global Coding Bootcamp Market 2025-2029 |
||||||

|
|||||||
カスタマイズ可能
|
|||||||


| コーディング・ブートキャンプの世界市場 2025~2029年 |
|
出版日: 2025年01月22日
発行: TechNavio
ページ情報: 英文 217 Pages
納期: 即納可能
|

全表示
- 概要
- 図表
- 目次
コーディング・ブートキャンプ市場は2024~2029年に39億8,040万米ドル、予測期間中のCAGRは30.3%で成長すると予測されています。
この調査レポートは、コーディング・ブートキャンプ市場の全体分析、市場規模・予測、動向、成長促進要因、課題、約25のベンダーを網羅したベンダー分析などを掲載しています。
現在の市場シナリオ、最新動向と促進要因、市場環境全体に関する最新分析を提供しています。市場は、ソフトウェア開発者やIT専門家に対するニーズの高まり、技術産業における継続的な学習とスキルアップの必要性、従来の高等教育プログラムと比較してブートキャンプの受講料が手ごろであることなどが牽引しています。
| 市場範囲 | |
|---|---|
| 基準年 | 2025年 |
| 終了年 | 2029年 |
| 予測期間 | 2025~2029年 |
| 成長モメンタム | 加速 |
| 前年比[2025年] | 23.3% |
| CAGR | 30.3% |
| 増分額 | 39億8,040万米ドル |
本調査では、今後数年間のコーディング・ブートキャンプ市場の成長を促進する主要理由の1つとして、即戦力となるコーディングブートキャンプの増加を挙げています。また、コーディングスキルに対する需要の増加や、eラーニングの統合が進んでいることも、市場の大きな需要につながると考えられます。
目次
第1章 エグゼクティブサマリー
- 市場概要
第2章 Technavio分析
- 価格・ライフサイクル・顧客購入バスケット・採用率・購入基準の分析
- インプットの重要性と差別化の要因
- 混乱の要因
- 促進要因と課題の影響
第3章 市場情勢
- 市場エコシステム
- 市場の特徴
- バリューチェーン分析
第4章 市場規模
- 市場の定義
- 市場セグメント分析
- 市場規模 2024年
- 市場の展望 2024~2029年
第5章 市場規模実績
- コーディング・ブートキャンプの世界市場 2019~2023年
- エンドユーザー別セグメント分析 2019~2023年
- 言語セグメント分析 2019~2023年
- 配信モードセグメント分析 2019~2023年
- 地域別セグメント分析 2019~2023年
- 国別セグメント分析 2019~2023年
第6章 定性分析
- AIの影響-コーディング・ブートキャンプの世界市場
第7章 ファイブフォース分析
- ファイブフォースの要約
- 買い手の交渉力
- 供給企業の交渉力
- 新規参入業者の脅威
- 代替品の脅威
- 競争の脅威
- 市況
第8章 市場セグメンテーション:エンドユーザー別
- 市場セグメント
- 比較:エンドユーザー別
- 個人学習者:市場規模と予測 2024~2029年
- 組織学習者:市場規模と予測 2024~2029年
- 市場機会:エンドユーザー別
第9章 市場セグメンテーション言語別
- 市場セグメント
- 比較言語別
- Java:市場規模と予測 2024~2029年
- Python:市場規模と予測 2024~2029年
- .NET:市場規模と予測 2024~2029年
- Ruby:市場規模と予測 2024~2029年
- その他:市場規模と予測 2024~2029年
- 市場機会言語別
第10章 市場セグメンテーション:提供方法別
- 市場セグメント
- 比較:提供方法別
- フルタイムブートキャンプ:市場規模と予測 2024~2029年
- パートタイムブートキャンプ:市場規模と予測 2024~2029年
- 市場機会:提供方法別
第11章 顧客情勢
- 顧客情勢概要
第12章 地域別情勢
- 地域別セグメンテーション
- 比較:地域別
- 北米:市場規模と予測 2024~2029年
- アジア太平洋:市場規模と予測 2024~2029年
- 欧州:市場規模と予測 2024~2029年
- 南米:市場規模と予測 2024~2029年
- 中東・アフリカ:市場規模と予測 2024~2029年
- 米国:市場規模と予測 2024~2029年
- カナダ:市場規模と予測 2024~2029年
- ドイツ:市場規模と予測 2024~2029年
- 中国:市場規模と予測 2024~2029年
- 英国:市場規模と予測 2024~2029年
- インド:市場規模と予測 2024~2029年
- フランス:市場規模と予測 2024~2029年
- イタリア:市場規模と予測 2024~2029年
- 日本:市場規模と予測 2024~2029年
- 韓国:市場規模と予測 2024~2029年
- 地域情勢による市場機会
第13章 促進要因・課題・機会・抑制要因
- 市場促進要因
- 市場課題
- 促進要因と課題の影響
- 市場機会・抑制要因
第14章 競合情勢
- 概要
- 競合情勢
- 混乱の状況
- 産業のリスク
第15章 競合分析
- 企業プロファイル
- 企業ランキング指数
- 企業の市場ポジショニング
- Barcelona Code School
- Chegg Inc.
- Dataquest Labs Inc.
- Epicodus Inc.
- Flatiron School LLC
- Fullstack Academy LLC
- Hackwagon Academy Pte Ltd.
- LA LOCO SAS
- Launch School
- Nippon Telegraph and Telephone Corp.
- Skillcrush Inc.
- Stride Inc.
- Udacity Inc.
- Zip Code Wilmington
第16章 付録
Exhibits:
- Exhibits1: Executive Summary - Chart on Market Overview
- Exhibits2: Executive Summary - Data Table on Market Overview
- Exhibits3: Executive Summary - Chart on Global Market Characteristics
- Exhibits4: Executive Summary - Chart on Market By Geographical Landscape
- Exhibits5: Executive Summary - Chart on Market Segmentation by End-user
- Exhibits6: Executive Summary - Chart on Market Segmentation by Language
- Exhibits7: Executive Summary - Chart on Market Segmentation by Delivery Mode
- Exhibits8: Executive Summary - Chart on Incremental Growth
- Exhibits9: Executive Summary - Data Table on Incremental Growth
- Exhibits10: Executive Summary - Chart on Company Market Positioning
- Exhibits11: Analysis of price sensitivity, lifecycle, customer purchase basket, adoption rates, and purchase criteria
- Exhibits12: Overview on criticality of inputs and factors of differentiation
- Exhibits13: Overview on factors of disruption
- Exhibits14: Impact of drivers and challenges in 2024 and 2029
- Exhibits15: Parent Market
- Exhibits16: Data Table on - Parent Market
- Exhibits17: Market characteristics analysis
- Exhibits18: Value chain analysis
- Exhibits19: Offerings of companies included in the market definition
- Exhibits20: Market segments
- Exhibits21: Chart on Global - Market size and forecast 2024-2029 ($ million)
- Exhibits22: Data Table on Global - Market size and forecast 2024-2029 ($ million)
- Exhibits23: Chart on Global Market: Year-over-year growth 2024-2029 (%)
- Exhibits24: Data Table on Global Market: Year-over-year growth 2024-2029 (%)
- Exhibits25: Historic Market Size - Data Table on Global Coding Bootcamp Market 2019 - 2023 ($ million)
- Exhibits26: Historic Market Size - End-user Segment 2019 - 2023 ($ million)
- Exhibits27: Historic Market Size - Language Segment 2019 - 2023 ($ million)
- Exhibits28: Historic Market Size - Delivery Mode Segment 2019 - 2023 ($ million)
- Exhibits29: Historic Market Size - Geography Segment 2019 - 2023 ($ million)
- Exhibits30: Historic Market Size - Country Segment 2019 - 2023 ($ million)
- Exhibits31: Five forces analysis - Comparison between 2024 and 2029
- Exhibits32: Bargaining power of buyers - Impact of key factors 2024 and 2029
- Exhibits33: Bargaining power of suppliers - Impact of key factors in 2024 and 2029
- Exhibits34: Threat of new entrants - Impact of key factors in 2024 and 2029
- Exhibits35: Threat of substitutes - Impact of key factors in 2024 and 2029
- Exhibits36: Threat of rivalry - Impact of key factors in 2024 and 2029
- Exhibits37: Chart on Market condition - Five forces 2024 and 2029
- Exhibits38: Chart on End-user - Market share 2024-2029 (%)
- Exhibits39: Data Table on End-user - Market share 2024-2029 (%)
- Exhibits40: Chart on Comparison by End-user
- Exhibits41: Data Table on Comparison by End-user
- Exhibits42: Chart on Individual learners - Market size and forecast 2024-2029 ($ million)
- Exhibits43: Data Table on Individual learners - Market size and forecast 2024-2029 ($ million)
- Exhibits44: Chart on Individual learners - Year-over-year growth 2024-2029 (%)
- Exhibits45: Data Table on Individual learners - Year-over-year growth 2024-2029 (%)
- Exhibits46: Chart on Institutional learners - Market size and forecast 2024-2029 ($ million)
- Exhibits47: Data Table on Institutional learners - Market size and forecast 2024-2029 ($ million)
- Exhibits48: Chart on Institutional learners - Year-over-year growth 2024-2029 (%)
- Exhibits49: Data Table on Institutional learners - Year-over-year growth 2024-2029 (%)
- Exhibits50: Market opportunity by End-user ($ million)
- Exhibits51: Data Table on Market opportunity by End-user ($ million)
- Exhibits52: Chart on Language - Market share 2024-2029 (%)
- Exhibits53: Data Table on Language - Market share 2024-2029 (%)
- Exhibits54: Chart on Comparison by Language
- Exhibits55: Data Table on Comparison by Language
- Exhibits56: Chart on Java - Market size and forecast 2024-2029 ($ million)
- Exhibits57: Data Table on Java - Market size and forecast 2024-2029 ($ million)
- Exhibits58: Chart on Java - Year-over-year growth 2024-2029 (%)
- Exhibits59: Data Table on Java - Year-over-year growth 2024-2029 (%)
- Exhibits60: Chart on Python - Market size and forecast 2024-2029 ($ million)
- Exhibits61: Data Table on Python - Market size and forecast 2024-2029 ($ million)
- Exhibits62: Chart on Python - Year-over-year growth 2024-2029 (%)
- Exhibits63: Data Table on Python - Year-over-year growth 2024-2029 (%)
- Exhibits64: Chart on .NET - Market size and forecast 2024-2029 ($ million)
- Exhibits65: Data Table on .NET - Market size and forecast 2024-2029 ($ million)
- Exhibits66: Chart on .NET - Year-over-year growth 2024-2029 (%)
- Exhibits67: Data Table on .NET - Year-over-year growth 2024-2029 (%)
- Exhibits68: Chart on Ruby - Market size and forecast 2024-2029 ($ million)
- Exhibits69: Data Table on Ruby - Market size and forecast 2024-2029 ($ million)
- Exhibits70: Chart on Ruby - Year-over-year growth 2024-2029 (%)
- Exhibits71: Data Table on Ruby - Year-over-year growth 2024-2029 (%)
- Exhibits72: Chart on Others - Market size and forecast 2024-2029 ($ million)
- Exhibits73: Data Table on Others - Market size and forecast 2024-2029 ($ million)
- Exhibits74: Chart on Others - Year-over-year growth 2024-2029 (%)
- Exhibits75: Data Table on Others - Year-over-year growth 2024-2029 (%)
- Exhibits76: Market opportunity by Language ($ million)
- Exhibits77: Data Table on Market opportunity by Language ($ million)
- Exhibits78: Chart on Delivery Mode - Market share 2024-2029 (%)
- Exhibits79: Data Table on Delivery Mode - Market share 2024-2029 (%)
- Exhibits80: Chart on Comparison by Delivery Mode
- Exhibits81: Data Table on Comparison by Delivery Mode
- Exhibits82: Chart on Full-time bootcamps - Market size and forecast 2024-2029 ($ million)
- Exhibits83: Data Table on Full-time bootcamps - Market size and forecast 2024-2029 ($ million)
- Exhibits84: Chart on Full-time bootcamps - Year-over-year growth 2024-2029 (%)
- Exhibits85: Data Table on Full-time bootcamps - Year-over-year growth 2024-2029 (%)
- Exhibits86: Chart on Part-time bootcamps - Market size and forecast 2024-2029 ($ million)
- Exhibits87: Data Table on Part-time bootcamps - Market size and forecast 2024-2029 ($ million)
- Exhibits88: Chart on Part-time bootcamps - Year-over-year growth 2024-2029 (%)
- Exhibits89: Data Table on Part-time bootcamps - Year-over-year growth 2024-2029 (%)
- Exhibits90: Market opportunity by Delivery Mode ($ million)
- Exhibits91: Data Table on Market opportunity by Delivery Mode ($ million)
- Exhibits92: Analysis of price sensitivity, lifecycle, customer purchase basket, adoption rates, and purchase criteria
- Exhibits93: Chart on Market share By Geographical Landscape 2024-2029 (%)
- Exhibits94: Data Table on Market share By Geographical Landscape 2024-2029 (%)
- Exhibits95: Chart on Geographic comparison
- Exhibits96: Data Table on Geographic comparison
- Exhibits97: Chart on North America - Market size and forecast 2024-2029 ($ million)
- Exhibits98: Data Table on North America - Market size and forecast 2024-2029 ($ million)
- Exhibits99: Chart on North America - Year-over-year growth 2024-2029 (%)
- Exhibits100: Data Table on North America - Year-over-year growth 2024-2029 (%)
- Exhibits101: Chart on APAC - Market size and forecast 2024-2029 ($ million)
- Exhibits102: Data Table on APAC - Market size and forecast 2024-2029 ($ million)
- Exhibits103: Chart on APAC - Year-over-year growth 2024-2029 (%)
- Exhibits104: Data Table on APAC - Year-over-year growth 2024-2029 (%)
- Exhibits105: Chart on Europe - Market size and forecast 2024-2029 ($ million)
- Exhibits106: Data Table on Europe - Market size and forecast 2024-2029 ($ million)
- Exhibits107: Chart on Europe - Year-over-year growth 2024-2029 (%)
- Exhibits108: Data Table on Europe - Year-over-year growth 2024-2029 (%)
- Exhibits109: Chart on South America - Market size and forecast 2024-2029 ($ million)
- Exhibits110: Data Table on South America - Market size and forecast 2024-2029 ($ million)
- Exhibits111: Chart on South America - Year-over-year growth 2024-2029 (%)
- Exhibits112: Data Table on South America - Year-over-year growth 2024-2029 (%)
- Exhibits113: Chart on Middle East and Africa - Market size and forecast 2024-2029 ($ million)
- Exhibits114: Data Table on Middle East and Africa - Market size and forecast 2024-2029 ($ million)
- Exhibits115: Chart on Middle East and Africa - Year-over-year growth 2024-2029 (%)
- Exhibits116: Data Table on Middle East and Africa - Year-over-year growth 2024-2029 (%)
- Exhibits117: Chart on US - Market size and forecast 2024-2029 ($ million)
- Exhibits118: Data Table on US - Market size and forecast 2024-2029 ($ million)
- Exhibits119: Chart on US - Year-over-year growth 2024-2029 (%)
- Exhibits120: Data Table on US - Year-over-year growth 2024-2029 (%)
- Exhibits121: Chart on Canada - Market size and forecast 2024-2029 ($ million)
- Exhibits122: Data Table on Canada - Market size and forecast 2024-2029 ($ million)
- Exhibits123: Chart on Canada - Year-over-year growth 2024-2029 (%)
- Exhibits124: Data Table on Canada - Year-over-year growth 2024-2029 (%)
- Exhibits125: Chart on Germany - Market size and forecast 2024-2029 ($ million)
- Exhibits126: Data Table on Germany - Market size and forecast 2024-2029 ($ million)
- Exhibits127: Chart on Germany - Year-over-year growth 2024-2029 (%)
- Exhibits128: Data Table on Germany - Year-over-year growth 2024-2029 (%)
- Exhibits129: Chart on China - Market size and forecast 2024-2029 ($ million)
- Exhibits130: Data Table on China - Market size and forecast 2024-2029 ($ million)
- Exhibits131: Chart on China - Year-over-year growth 2024-2029 (%)
- Exhibits132: Data Table on China - Year-over-year growth 2024-2029 (%)
- Exhibits133: Chart on UK - Market size and forecast 2024-2029 ($ million)
- Exhibits134: Data Table on UK - Market size and forecast 2024-2029 ($ million)
- Exhibits135: Chart on UK - Year-over-year growth 2024-2029 (%)
- Exhibits136: Data Table on UK - Year-over-year growth 2024-2029 (%)
- Exhibits137: Chart on India - Market size and forecast 2024-2029 ($ million)
- Exhibits138: Data Table on India - Market size and forecast 2024-2029 ($ million)
- Exhibits139: Chart on India - Year-over-year growth 2024-2029 (%)
- Exhibits140: Data Table on India - Year-over-year growth 2024-2029 (%)
- Exhibits141: Chart on France - Market size and forecast 2024-2029 ($ million)
- Exhibits142: Data Table on France - Market size and forecast 2024-2029 ($ million)
- Exhibits143: Chart on France - Year-over-year growth 2024-2029 (%)
- Exhibits144: Data Table on France - Year-over-year growth 2024-2029 (%)
- Exhibits145: Chart on Italy - Market size and forecast 2024-2029 ($ million)
- Exhibits146: Data Table on Italy - Market size and forecast 2024-2029 ($ million)
- Exhibits147: Chart on Italy - Year-over-year growth 2024-2029 (%)
- Exhibits148: Data Table on Italy - Year-over-year growth 2024-2029 (%)
- Exhibits149: Chart on Japan - Market size and forecast 2024-2029 ($ million)
- Exhibits150: Data Table on Japan - Market size and forecast 2024-2029 ($ million)
- Exhibits151: Chart on Japan - Year-over-year growth 2024-2029 (%)
- Exhibits152: Data Table on Japan - Year-over-year growth 2024-2029 (%)
- Exhibits153: Chart on South Korea - Market size and forecast 2024-2029 ($ million)
- Exhibits154: Data Table on South Korea - Market size and forecast 2024-2029 ($ million)
- Exhibits155: Chart on South Korea - Year-over-year growth 2024-2029 (%)
- Exhibits156: Data Table on South Korea - Year-over-year growth 2024-2029 (%)
- Exhibits157: Market opportunity By Geographical Landscape ($ million)
- Exhibits158: Data Tables on Market opportunity By Geographical Landscape ($ million)
- Exhibits159: Impact of drivers and challenges in 2024 and 2029
- Exhibits160: Overview on criticality of inputs and factors of differentiation
- Exhibits161: Overview on factors of disruption
- Exhibits162: Impact of key risks on business
- Exhibits163: Companies covered
- Exhibits164: Company ranking index
- Exhibits165: Matrix on companies position and classification
- Exhibits166: 4Geeks Academy LLC - Overview
- Exhibits167: 4Geeks Academy LLC - Product / Service
- Exhibits168: 4Geeks Academy LLC - Key offerings
- Exhibits169: SWOT
- Exhibits170: Barcelona Code School - Overview
- Exhibits171: Barcelona Code School - Product / Service
- Exhibits172: Barcelona Code School - Key offerings
- Exhibits173: SWOT
- Exhibits174: Chegg Inc. - Overview
- Exhibits175: Chegg Inc. - Product / Service
- Exhibits176: Chegg Inc. - Key news
- Exhibits177: Chegg Inc. - Key offerings
- Exhibits178: SWOT
- Exhibits179: Dataquest Labs Inc. - Overview
- Exhibits180: Dataquest Labs Inc. - Product / Service
- Exhibits181: Dataquest Labs Inc. - Key offerings
- Exhibits182: SWOT
- Exhibits183: Epicodus Inc. - Overview
- Exhibits184: Epicodus Inc. - Product / Service
- Exhibits185: Epicodus Inc. - Key offerings
- Exhibits186: SWOT
- Exhibits187: Flatiron School LLC - Overview
- Exhibits188: Flatiron School LLC - Product / Service
- Exhibits189: Flatiron School LLC - Key offerings
- Exhibits190: SWOT
- Exhibits191: Fullstack Academy LLC - Overview
- Exhibits192: Fullstack Academy LLC - Product / Service
- Exhibits193: Fullstack Academy LLC - Key offerings
- Exhibits194: SWOT
- Exhibits195: Hackwagon Academy Pte Ltd. - Overview
- Exhibits196: Hackwagon Academy Pte Ltd. - Product / Service
- Exhibits197: Hackwagon Academy Pte Ltd. - Key offerings
- Exhibits198: SWOT
- Exhibits199: LA LOCO SAS - Overview
- Exhibits200: LA LOCO SAS - Product / Service
- Exhibits201: LA LOCO SAS - Key offerings
- Exhibits202: SWOT
- Exhibits203: Launch School - Overview
- Exhibits204: Launch School - Product / Service
- Exhibits205: Launch School - Key offerings
- Exhibits206: SWOT
- Exhibits207: Nippon Telegraph and Telephone Corp. - Overview
- Exhibits208: Nippon Telegraph and Telephone Corp. - Business segments
- Exhibits209: Nippon Telegraph and Telephone Corp. - Key news
- Exhibits210: Nippon Telegraph and Telephone Corp. - Key offerings
- Exhibits211: Nippon Telegraph and Telephone Corp. - Segment focus
- Exhibits212: SWOT
- Exhibits213: Skillcrush Inc. - Overview
- Exhibits214: Skillcrush Inc. - Product / Service
- Exhibits215: Skillcrush Inc. - Key offerings
- Exhibits216: SWOT
- Exhibits217: Stride Inc. - Overview
- Exhibits218: Stride Inc. - Product / Service
- Exhibits219: Stride Inc. - Key offerings
- Exhibits220: SWOT
- Exhibits221: Udacity Inc. - Overview
- Exhibits222: Udacity Inc. - Product / Service
- Exhibits223: Udacity Inc. - Key offerings
- Exhibits224: SWOT
- Exhibits225: Zip Code Wilmington - Overview
- Exhibits226: Zip Code Wilmington - Product / Service
- Exhibits227: Zip Code Wilmington - Key offerings
- Exhibits228: SWOT
- Exhibits229: Inclusions checklist
- Exhibits230: Exclusions checklist
- Exhibits231: Currency conversion rates for US$
- Exhibits232: Research methodology
- Exhibits233: Information sources
- Exhibits234: Data validation
- Exhibits235: Validation techniques employed for market sizing
- Exhibits236: Data synthesis
- Exhibits237: 360 degree market analysis
- Exhibits238: List of abbreviations
The coding bootcamp market is forecasted to grow by $ 3980.4 mn during 2024-2029, accelerating at a CAGR of 30.3% during the forecast period. The report on the coding bootcamp market provides a holistic analysis, market size and forecast, trends, growth drivers, and challenges, as well as vendor analysis covering around 25 vendors.
The report offers an up-to-date analysis regarding the current market scenario, the latest trends and drivers, and the overall market environment. The market is driven by increasing need for software developers and it professionals, need for continuous learning and upskilling in tech industry, and high affordability of bootcamps compared to traditional higher education programs.
| Market Scope | |
|---|---|
| Base Year | 2025 |
| End Year | 2029 |
| Series Year | 2025-2029 |
| Growth Momentum | Accelerate |
| YOY 2025 | 23.3% |
| CAGR | 30.3% |
| Incremental Value | $3980.4 mn |
Technavio's coding bootcamp market is segmented as below:
By End-user
- Individual learners
- Institutional learners
By Language
- Java
- Python
- .NET
- Ruby
- Others
By Delivery Mode
- Full-time bootcamps
- Part-time bootcamps
By Geographical Landscape
- North America
- APAC
- Europe
- South America
- Middle East and Africa
This study identifies the increasing ready-to-work coding bootcamps as one of the prime reasons driving the coding bootcamp market growth during the next few years. Also, increasing demand for coding skills and increasing integration of e-learning will lead to sizable demand in the market.
The report on the coding bootcamp market covers the following areas:
- Coding Bootcamp Market sizing
- Coding Bootcamp Market forecast
- Coding Bootcamp Market industry analysis
The robust vendor analysis is designed to help clients improve their market position, and in line with this, this report provides a detailed analysis of several leading coding bootcamp market vendors that include 4Geeks Academy LLC, Academia de Codigo, Barcelona Code School, Chegg Inc., Dataquest Labs Inc., Epicodus Inc., Flatiron School LLC, Fullstack Academy LLC, General Assembly Space Inc., Hackwagon Academy Pte Ltd., Hash Map Labs Inc., Ironhack Inc., LA LOCO SAS, Launch School, Makers Academy, Nippon Telegraph and Telephone Corp., Skillcrush Inc., Stride Inc., Udacity Inc., and Zip Code Wilmington. Also, the coding bootcamp market analysis report includes information on upcoming trends and challenges that will influence market growth. This is to help companies strategize and leverage all forthcoming growth opportunities.
The study was conducted using an objective combination of primary and secondary information including inputs from key participants in the industry. The report contains a comprehensive market and vendor landscape in addition to an analysis of the key vendors.
The publisher presents a detailed picture of the market by the way of study, synthesis, and summation of data from multiple sources by an analysis of key parameters such as profit, pricing, competition, and promotions. It presents various market facets by identifying the key industry influencers. The data presented is comprehensive, reliable, and a result of extensive primary and secondary research. The market research reports provide a complete competitive landscape and an in-depth vendor selection methodology and analysis using qualitative and quantitative research to forecast accurate market growth.
Table of Contents
1 Executive Summary
- 1.1 Market overview
- Executive Summary - Chart on Market Overview
- Executive Summary - Data Table on Market Overview
- Executive Summary - Chart on Global Market Characteristics
- Executive Summary - Chart on Market By Geographical Landscape
- Executive Summary - Chart on Market Segmentation by End-user
- Executive Summary - Chart on Market Segmentation by Language
- Executive Summary - Chart on Market Segmentation by Delivery Mode
- Executive Summary - Chart on Incremental Growth
- Executive Summary - Data Table on Incremental Growth
- Executive Summary - Chart on Company Market Positioning
2 Technavio Analysis
- 2.1 Analysis of price sensitivity, lifecycle, customer purchase basket, adoption rates, and purchase criteria
- Analysis of price sensitivity, lifecycle, customer purchase basket, adoption rates, and purchase criteria
- 2.2 Criticality of inputs and Factors of differentiation
- Overview on criticality of inputs and factors of differentiation
- 2.3 Factors of disruption
- Overview on factors of disruption
- 2.4 Impact of drivers and challenges
- Impact of drivers and challenges in 2024 and 2029
3 Market Landscape
- 3.1 Market ecosystem
- Parent Market
- Data Table on - Parent Market
- 3.2 Market characteristics
- Market characteristics analysis
- 3.3 Value chain analysis
- Value chain analysis
4 Market Sizing
- 4.1 Market definition
- Offerings of companies included in the market definition
- 4.2 Market segment analysis
- Market segments
- 4.3 Market size 2024
- 4.4 Market outlook: Forecast for 2024-2029
- Chart on Global - Market size and forecast 2024-2029 ($ million)
- Data Table on Global - Market size and forecast 2024-2029 ($ million)
- Chart on Global Market: Year-over-year growth 2024-2029 (%)
- Data Table on Global Market: Year-over-year growth 2024-2029 (%)
5 Historic Market Size
- 5.1 Global Coding Bootcamp Market 2019 - 2023
- Historic Market Size - Data Table on Global Coding Bootcamp Market 2019 - 2023 ($ million)
- 5.2 End-user segment analysis 2019 - 2023
- Historic Market Size - End-user Segment 2019 - 2023 ($ million)
- 5.3 Language segment analysis 2019 - 2023
- Historic Market Size - Language Segment 2019 - 2023 ($ million)
- 5.4 Delivery Mode segment analysis 2019 - 2023
- Historic Market Size - Delivery Mode Segment 2019 - 2023 ($ million)
- 5.5 Geography segment analysis 2019 - 2023
- Historic Market Size - Geography Segment 2019 - 2023 ($ million)
- 5.6 Country segment analysis 2019 - 2023
- Historic Market Size - Country Segment 2019 - 2023 ($ million)
6 Qualitative Analysis
- 6.1 Impact of AI on Global Coding Bootcamp Market
7 Five Forces Analysis
- 7.1 Five forces summary
- Five forces analysis - Comparison between 2024 and 2029
- 7.2 Bargaining power of buyers
- Bargaining power of buyers - Impact of key factors 2024 and 2029
- 7.3 Bargaining power of suppliers
- Bargaining power of suppliers - Impact of key factors in 2024 and 2029
- 7.4 Threat of new entrants
- Threat of new entrants - Impact of key factors in 2024 and 2029
- 7.5 Threat of substitutes
- Threat of substitutes - Impact of key factors in 2024 and 2029
- 7.6 Threat of rivalry
- Threat of rivalry - Impact of key factors in 2024 and 2029
- 7.7 Market condition
- Chart on Market condition - Five forces 2024 and 2029
8 Market Segmentation by End-user
- 8.1 Market segments
- Chart on End-user - Market share 2024-2029 (%)
- Data Table on End-user - Market share 2024-2029 (%)
- 8.2 Comparison by End-user
- Chart on Comparison by End-user
- Data Table on Comparison by End-user
- 8.3 Individual learners - Market size and forecast 2024-2029
- Chart on Individual learners - Market size and forecast 2024-2029 ($ million)
- Data Table on Individual learners - Market size and forecast 2024-2029 ($ million)
- Chart on Individual learners - Year-over-year growth 2024-2029 (%)
- Data Table on Individual learners - Year-over-year growth 2024-2029 (%)
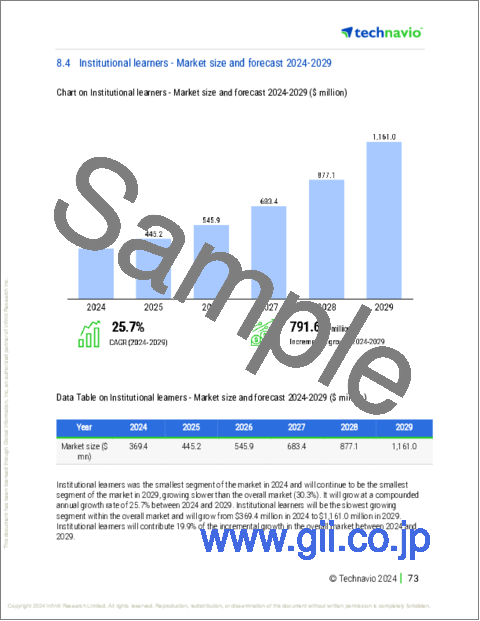
- 8.4 Institutional learners - Market size and forecast 2024-2029
- Chart on Institutional learners - Market size and forecast 2024-2029 ($ million)
- Data Table on Institutional learners - Market size and forecast 2024-2029 ($ million)
- Chart on Institutional learners - Year-over-year growth 2024-2029 (%)
- Data Table on Institutional learners - Year-over-year growth 2024-2029 (%)
- 8.5 Market opportunity by End-user
- Market opportunity by End-user ($ million)
- Data Table on Market opportunity by End-user ($ million)
9 Market Segmentation by Language
- 9.1 Market segments
- Chart on Language - Market share 2024-2029 (%)
- Data Table on Language - Market share 2024-2029 (%)
- 9.2 Comparison by Language
- Chart on Comparison by Language
- Data Table on Comparison by Language
- 9.3 Java - Market size and forecast 2024-2029
- Chart on Java - Market size and forecast 2024-2029 ($ million)
- Data Table on Java - Market size and forecast 2024-2029 ($ million)
- Chart on Java - Year-over-year growth 2024-2029 (%)
- Data Table on Java - Year-over-year growth 2024-2029 (%)
- 9.4 Python - Market size and forecast 2024-2029
- Chart on Python - Market size and forecast 2024-2029 ($ million)
- Data Table on Python - Market size and forecast 2024-2029 ($ million)
- Chart on Python - Year-over-year growth 2024-2029 (%)
- Data Table on Python - Year-over-year growth 2024-2029 (%)
- 9.5 .NET - Market size and forecast 2024-2029
- Chart on .NET - Market size and forecast 2024-2029 ($ million)
- Data Table on .NET - Market size and forecast 2024-2029 ($ million)
- Chart on .NET - Year-over-year growth 2024-2029 (%)
- Data Table on .NET - Year-over-year growth 2024-2029 (%)
- 9.6 Ruby - Market size and forecast 2024-2029
- Chart on Ruby - Market size and forecast 2024-2029 ($ million)
- Data Table on Ruby - Market size and forecast 2024-2029 ($ million)
- Chart on Ruby - Year-over-year growth 2024-2029 (%)
- Data Table on Ruby - Year-over-year growth 2024-2029 (%)
- 9.7 Others - Market size and forecast 2024-2029
- Chart on Others - Market size and forecast 2024-2029 ($ million)
- Data Table on Others - Market size and forecast 2024-2029 ($ million)
- Chart on Others - Year-over-year growth 2024-2029 (%)
- Data Table on Others - Year-over-year growth 2024-2029 (%)
- 9.8 Market opportunity by Language
- Market opportunity by Language ($ million)
- Data Table on Market opportunity by Language ($ million)
10 Market Segmentation by Delivery Mode
- 10.1 Market segments
- Chart on Delivery Mode - Market share 2024-2029 (%)
- Data Table on Delivery Mode - Market share 2024-2029 (%)
- 10.2 Comparison by Delivery Mode
- Chart on Comparison by Delivery Mode
- Data Table on Comparison by Delivery Mode
- 10.3 Full-time bootcamps - Market size and forecast 2024-2029
- Chart on Full-time bootcamps - Market size and forecast 2024-2029 ($ million)
- Data Table on Full-time bootcamps - Market size and forecast 2024-2029 ($ million)
- Chart on Full-time bootcamps - Year-over-year growth 2024-2029 (%)
- Data Table on Full-time bootcamps - Year-over-year growth 2024-2029 (%)
- 10.4 Part-time bootcamps - Market size and forecast 2024-2029
- Chart on Part-time bootcamps - Market size and forecast 2024-2029 ($ million)
- Data Table on Part-time bootcamps - Market size and forecast 2024-2029 ($ million)
- Chart on Part-time bootcamps - Year-over-year growth 2024-2029 (%)
- Data Table on Part-time bootcamps - Year-over-year growth 2024-2029 (%)
- 10.5 Market opportunity by Delivery Mode
- Market opportunity by Delivery Mode ($ million)
- Data Table on Market opportunity by Delivery Mode ($ million)
11 Customer Landscape
- 11.1 Customer landscape overview
- Analysis of price sensitivity, lifecycle, customer purchase basket, adoption rates, and purchase criteria
12 Geographic Landscape
- 12.1 Geographic segmentation
- Chart on Market share By Geographical Landscape 2024-2029 (%)
- Data Table on Market share By Geographical Landscape 2024-2029 (%)
- 12.2 Geographic comparison
- Chart on Geographic comparison
- Data Table on Geographic comparison
- 12.3 North America - Market size and forecast 2024-2029
- Chart on North America - Market size and forecast 2024-2029 ($ million)
- Data Table on North America - Market size and forecast 2024-2029 ($ million)
- Chart on North America - Year-over-year growth 2024-2029 (%)
- Data Table on North America - Year-over-year growth 2024-2029 (%)
- 12.4 APAC - Market size and forecast 2024-2029
- Chart on APAC - Market size and forecast 2024-2029 ($ million)
- Data Table on APAC - Market size and forecast 2024-2029 ($ million)
- Chart on APAC - Year-over-year growth 2024-2029 (%)
- Data Table on APAC - Year-over-year growth 2024-2029 (%)
- 12.5 Europe - Market size and forecast 2024-2029
- Chart on Europe - Market size and forecast 2024-2029 ($ million)
- Data Table on Europe - Market size and forecast 2024-2029 ($ million)
- Chart on Europe - Year-over-year growth 2024-2029 (%)
- Data Table on Europe - Year-over-year growth 2024-2029 (%)
- 12.6 South America - Market size and forecast 2024-2029
- Chart on South America - Market size and forecast 2024-2029 ($ million)
- Data Table on South America - Market size and forecast 2024-2029 ($ million)
- Chart on South America - Year-over-year growth 2024-2029 (%)
- Data Table on South America - Year-over-year growth 2024-2029 (%)
- 12.7 Middle East and Africa - Market size and forecast 2024-2029
- Chart on Middle East and Africa - Market size and forecast 2024-2029 ($ million)
- Data Table on Middle East and Africa - Market size and forecast 2024-2029 ($ million)
- Chart on Middle East and Africa - Year-over-year growth 2024-2029 (%)
- Data Table on Middle East and Africa - Year-over-year growth 2024-2029 (%)
- 12.8 US - Market size and forecast 2024-2029
- Chart on US - Market size and forecast 2024-2029 ($ million)
- Data Table on US - Market size and forecast 2024-2029 ($ million)
- Chart on US - Year-over-year growth 2024-2029 (%)
- Data Table on US - Year-over-year growth 2024-2029 (%)
- 12.9 Canada - Market size and forecast 2024-2029
- Chart on Canada - Market size and forecast 2024-2029 ($ million)
- Data Table on Canada - Market size and forecast 2024-2029 ($ million)
- Chart on Canada - Year-over-year growth 2024-2029 (%)
- Data Table on Canada - Year-over-year growth 2024-2029 (%)
- 12.10 Germany - Market size and forecast 2024-2029
- Chart on Germany - Market size and forecast 2024-2029 ($ million)
- Data Table on Germany - Market size and forecast 2024-2029 ($ million)
- Chart on Germany - Year-over-year growth 2024-2029 (%)
- Data Table on Germany - Year-over-year growth 2024-2029 (%)
- 12.11 China - Market size and forecast 2024-2029
- Chart on China - Market size and forecast 2024-2029 ($ million)
- Data Table on China - Market size and forecast 2024-2029 ($ million)
- Chart on China - Year-over-year growth 2024-2029 (%)
- Data Table on China - Year-over-year growth 2024-2029 (%)
- 12.12 UK - Market size and forecast 2024-2029
- Chart on UK - Market size and forecast 2024-2029 ($ million)
- Data Table on UK - Market size and forecast 2024-2029 ($ million)
- Chart on UK - Year-over-year growth 2024-2029 (%)
- Data Table on UK - Year-over-year growth 2024-2029 (%)
- 12.13 India - Market size and forecast 2024-2029
- Chart on India - Market size and forecast 2024-2029 ($ million)
- Data Table on India - Market size and forecast 2024-2029 ($ million)
- Chart on India - Year-over-year growth 2024-2029 (%)
- Data Table on India - Year-over-year growth 2024-2029 (%)
- 12.14 France - Market size and forecast 2024-2029
- Chart on France - Market size and forecast 2024-2029 ($ million)
- Data Table on France - Market size and forecast 2024-2029 ($ million)
- Chart on France - Year-over-year growth 2024-2029 (%)
- Data Table on France - Year-over-year growth 2024-2029 (%)
- 12.15 Italy - Market size and forecast 2024-2029
- Chart on Italy - Market size and forecast 2024-2029 ($ million)
- Data Table on Italy - Market size and forecast 2024-2029 ($ million)
- Chart on Italy - Year-over-year growth 2024-2029 (%)
- Data Table on Italy - Year-over-year growth 2024-2029 (%)
- 12.16 Japan - Market size and forecast 2024-2029
- Chart on Japan - Market size and forecast 2024-2029 ($ million)
- Data Table on Japan - Market size and forecast 2024-2029 ($ million)
- Chart on Japan - Year-over-year growth 2024-2029 (%)
- Data Table on Japan - Year-over-year growth 2024-2029 (%)
- 12.17 South Korea - Market size and forecast 2024-2029
- Chart on South Korea - Market size and forecast 2024-2029 ($ million)
- Data Table on South Korea - Market size and forecast 2024-2029 ($ million)
- Chart on South Korea - Year-over-year growth 2024-2029 (%)
- Data Table on South Korea - Year-over-year growth 2024-2029 (%)
- 12.18 Market opportunity By Geographical Landscape
- Market opportunity By Geographical Landscape ($ million)
- Data Tables on Market opportunity By Geographical Landscape ($ million)
13 Drivers, Challenges, and Opportunity/Restraints
- 13.1 Market drivers
- 13.2 Market challenges
- 13.3 Impact of drivers and challenges
- Impact of drivers and challenges in 2024 and 2029
- 13.4 Market opportunities/restraints
14 Competitive Landscape
- 14.1 Overview
- 14.2 Competitive Landscape
- Overview on criticality of inputs and factors of differentiation
- 14.3 Landscape disruption
- Overview on factors of disruption
- 14.4 Industry risks
- Impact of key risks on business
15 Competitive Analysis
- 15.1 Companies profiled
- Companies covered
- 15.2 Company ranking index
- Company ranking index
- 15.3 Market positioning of companies
- Matrix on companies position and classification
- 4Geeks Academy LLC
- 4Geeks Academy LLC - Overview
- 4Geeks Academy LLC - Product / Service
- 4Geeks Academy LLC - Key offerings
- SWOT
- 15.5 Barcelona Code School
- Barcelona Code School - Overview
- Barcelona Code School - Product / Service
- Barcelona Code School - Key offerings
- SWOT
- 15.6 Chegg Inc.
- Chegg Inc. - Overview
- Chegg Inc. - Product / Service
- Chegg Inc. - Key news
- Chegg Inc. - Key offerings
- SWOT
- 15.7 Dataquest Labs Inc.
- Dataquest Labs Inc. - Overview
- Dataquest Labs Inc. - Product / Service
- Dataquest Labs Inc. - Key offerings
- SWOT
- 15.8 Epicodus Inc.
- Epicodus Inc. - Overview
- Epicodus Inc. - Product / Service
- Epicodus Inc. - Key offerings
- SWOT
- 15.9 Flatiron School LLC
- Flatiron School LLC - Overview
- Flatiron School LLC - Product / Service
- Flatiron School LLC - Key offerings
- SWOT
- 15.10 Fullstack Academy LLC
- Fullstack Academy LLC - Overview
- Fullstack Academy LLC - Product / Service
- Fullstack Academy LLC - Key offerings
- SWOT
- 15.11 Hackwagon Academy Pte Ltd.
- Hackwagon Academy Pte Ltd. - Overview
- Hackwagon Academy Pte Ltd. - Product / Service
- Hackwagon Academy Pte Ltd. - Key offerings
- SWOT
- 15.12 LA LOCO SAS
- LA LOCO SAS - Overview
- LA LOCO SAS - Product / Service
- LA LOCO SAS - Key offerings
- SWOT
- 15.13 Launch School
- Launch School - Overview
- Launch School - Product / Service
- Launch School - Key offerings
- SWOT
- 15.14 Nippon Telegraph and Telephone Corp.
- Nippon Telegraph and Telephone Corp. - Overview
- Nippon Telegraph and Telephone Corp. - Business segments
- Nippon Telegraph and Telephone Corp. - Key news
- Nippon Telegraph and Telephone Corp. - Key offerings
- Nippon Telegraph and Telephone Corp. - Segment focus
- SWOT
- 15.15 Skillcrush Inc.
- Skillcrush Inc. - Overview
- Skillcrush Inc. - Product / Service
- Skillcrush Inc. - Key offerings
- SWOT
- 15.16 Stride Inc.
- Stride Inc. - Overview
- Stride Inc. - Product / Service
- Stride Inc. - Key offerings
- SWOT
- 15.17 Udacity Inc.
- Udacity Inc. - Overview
- Udacity Inc. - Product / Service
- Udacity Inc. - Key offerings
- SWOT
- 15.18 Zip Code Wilmington
- Zip Code Wilmington - Overview
- Zip Code Wilmington - Product / Service
- Zip Code Wilmington - Key offerings
- SWOT
16 Appendix
- 16.1 Scope of the report
- 16.2 Inclusions and exclusions checklist
- Inclusions checklist
- Exclusions checklist
- 16.3 Currency conversion rates for US$
- Currency conversion rates for US$
- 16.4 Research methodology
- Research methodology
- 16.5 Data procurement
- Information sources
- 16.6 Data validation
- Data validation
- 16.7 Validation techniques employed for market sizing
- Validation techniques employed for market sizing
- 16.8 Data synthesis
- Data synthesis
- 16.9 360 degree market analysis
- 360 degree market analysis
- 16.10 List of abbreviations
- List of abbreviations
