|
|
市場調査レポート
商品コード
1645581
エチレンアクリル酸コポリマーの世界市場、2025-2029年Global Ethylene Acrylic Acid Copolymer Market 2025-2029 |
||||||

|
|||||||
カスタマイズ可能
|
|||||||


| エチレンアクリル酸コポリマーの世界市場、2025-2029年 |
|
出版日: 2025年01月22日
発行: TechNavio
ページ情報: 英文 208 Pages
納期: 即納可能
|

全表示
- 概要
- 図表
- 目次
エチレンアクリル酸コポリマー市場は2024-2029年に2億9,980万米ドル、予測期間中のCAGRは11.4%で成長すると予測されています。
この調査レポートは、エチレンアクリル酸コポリマー市場の全体分析、市場規模・予測、動向、成長促進要因、課題、約25のベンダーを網羅したベンダー分析などを掲載しています。
現在の市場シナリオ、最新動向と促進要因、市場環境全体に関する最新分析を提供しています。市場は、食品包装業界の需要増加、コーティング需要の拡大、化粧品・パーソナルケア業界の成長によって牽引されています。
| 市場範囲 | |
|---|---|
| 基準年 | 2025 |
| 終了年 | 2029 |
| 予測期間 | 2025-2029 |
| 成長モメンタム | 加速 |
| 前年比2025年 | 9.9% |
| CAGR | 11.4% |
| 増分額 | 2億9,980万米ドル |
本調査では、今後数年間のエチレンアクリル酸コポリマー市場成長を牽引する主な要因の一つとして、バイオベースアクリル酸の需要増加を挙げています。また、フレキシブル液体包装用パウチの需要増加やアクリル系粉体塗料への嗜好性の高まりも、市場の大きな需要につながると思われます。
目次
第1章 エグゼクティブサマリー
- 市場概要
第2章 Technavio分析
- 価格・ライフサイクル・顧客購入バスケット・採用率・購入基準の分析
- インプットの重要性と差別化の要因
- 混乱の要因
- 促進要因と課題の影響
第3章 市場情勢
- 市場エコシステム
- 市場の特徴
- バリューチェーン分析
第4章 市場規模
- 市場の定義
- 市場セグメント分析
- 市場規模 2024
- 市場の見通し 2024-2029
第5章 市場規模実績
- エチレンアクリル酸コポリマーの世界市場 2019-2023
- 用途別セグメント分析 2019-2023
- タイプセグメント分析 2019-2023
- 地域別セグメント分析 2019-2023
- 国別セグメント分析 2019-2023
第6章 定性分析
- AIの影響:エチレンアクリル酸コポリマーの世界市場
第7章 ファイブフォース分析
- ファイブフォースの要約
- 買い手の交渉力
- 供給企業の交渉力
- 新規参入業者の脅威
- 代替品の脅威
- 競争の脅威
- 市況
第8章 市場セグメンテーション:用途別
- 市場セグメント
- 比較:用途別
- 接着剤:市場規模と予測 2024-2029
- バリアコーティング:市場規模と予測 2024-2029
- その他:市場規模と予測 2024-2029
- 市場機会:用途別
第9章 市場セグメンテーション:タイプ別
- 市場セグメント
- 比較:タイプ別
- 市場機会:タイプ別
第10章 顧客情勢
- 顧客情勢の概要
第11章 地域別情勢
- 地域別セグメンテーション
- 地域別比較
- アジア太平洋:市場規模と予測 2024-2029
- 北米:市場規模と予測 2024-2029
- 欧州:市場規模と予測 2024-2029
- 南米:市場規模と予測 2024-2029
- 中東・アフリカ:市場規模と予測 2024-2029
- 中国:市場規模と予測 2024-2029
- 米国:市場規模と予測 2024-2029
- ドイツ:市場規模と予測 2024-2029
- ブラジル:市場規模と予測 2024-2029
- 日本:市場規模と予測 2024-2029
- フランス:市場規模と予測 2024-2029
- インド:市場規模と予測 2024-2029
- カナダ:市場規模と予測 2024-2029
- 英国:市場規模と予測 2024-2029
- アラブ首長国連邦:市場規模と予測 2024-2029
- 市場機会:地域情勢別
第12章 促進要因・課題・機会・抑制要因
- 市場促進要因
- 市場の課題
- 促進要因と課題の影響
- 市場の機会・抑制要因
第13章 競合情勢
- 概要
- 競合情勢
- 混乱の状況
- 業界のリスク
第14章 競合分析
- 企業プロファイル
- 企業ランキング指数
- 企業の市場ポジショニング
- Arkema
- BYK Chemie GmbH
- Exxon Mobil Corp.
- Honeywell International Inc.
- Jiangsu Victory Chemical Co. Ltd.
- LyondellBasell Industries NV
- Michelman Inc.
- Nanjing Tianshi New Material Technology Co. Ltd.
- NIPPON SHOKUBAI CO. LTD
- Sigma Aldrich Chemicals Pvt. Ltd.
- SK Chemicals Co. Ltd.
- SNP Inc.
- Ter Group
- The Dow Chemical Co.
- Thermo Fisher Scientific Inc.
第15章 付録
Exhibits:
- Exhibits1: Executive Summary - Chart on Market Overview
- Exhibits2: Executive Summary - Data Table on Market Overview
- Exhibits3: Executive Summary - Chart on Global Market Characteristics
- Exhibits4: Executive Summary - Chart on Market By Geographical Landscape
- Exhibits5: Executive Summary - Chart on Market Segmentation by Application
- Exhibits6: Executive Summary - Chart on Market Segmentation by Type
- Exhibits7: Executive Summary - Chart on Incremental Growth
- Exhibits8: Executive Summary - Data Table on Incremental Growth
- Exhibits9: Executive Summary - Chart on Company Market Positioning
- Exhibits10: Analysis of price sensitivity, lifecycle, customer purchase basket, adoption rates, and purchase criteria
- Exhibits11: Overview on criticality of inputs and factors of differentiation
- Exhibits12: Overview on factors of disruption
- Exhibits13: Impact of drivers and challenges in 2024 and 2029
- Exhibits14: Parent Market
- Exhibits15: Data Table on - Parent Market
- Exhibits16: Market characteristics analysis
- Exhibits17: Value chain analysis
- Exhibits18: Offerings of companies included in the market definition
- Exhibits19: Market segments
- Exhibits20: Chart on Global - Market size and forecast 2024-2029 ($ million)
- Exhibits21: Data Table on Global - Market size and forecast 2024-2029 ($ million)
- Exhibits22: Chart on Global Market: Year-over-year growth 2024-2029 (%)
- Exhibits23: Data Table on Global Market: Year-over-year growth 2024-2029 (%)
- Exhibits24: Historic Market Size - Data Table on Global Ethylene Acrylic Acid Copolymer Market 2019 - 2023 ($ million)
- Exhibits25: Historic Market Size - Application Segment 2019 - 2023 ($ million)
- Exhibits26: Historic Market Size - Type Segment 2019 - 2023 ($ million)
- Exhibits27: Historic Market Size - Geography Segment 2019 - 2023 ($ million)
- Exhibits28: Historic Market Size - Country Segment 2019 - 2023 ($ million)
- Exhibits29: Five forces analysis - Comparison between 2024 and 2029
- Exhibits30: Bargaining power of buyers - Impact of key factors 2024 and 2029
- Exhibits31: Bargaining power of suppliers - Impact of key factors in 2024 and 2029
- Exhibits32: Threat of new entrants - Impact of key factors in 2024 and 2029
- Exhibits33: Threat of substitutes - Impact of key factors in 2024 and 2029
- Exhibits34: Threat of rivalry - Impact of key factors in 2024 and 2029
- Exhibits35: Chart on Market condition - Five forces 2024 and 2029
- Exhibits36: Chart on Application - Market share 2024-2029 (%)
- Exhibits37: Data Table on Application - Market share 2024-2029 (%)
- Exhibits38: Chart on Comparison by Application
- Exhibits39: Data Table on Comparison by Application
- Exhibits40: Chart on Adhesives - Market size and forecast 2024-2029 ($ million)
- Exhibits41: Data Table on Adhesives - Market size and forecast 2024-2029 ($ million)
- Exhibits42: Chart on Adhesives - Year-over-year growth 2024-2029 (%)
- Exhibits43: Data Table on Adhesives - Year-over-year growth 2024-2029 (%)
- Exhibits44: Chart on Barrier coating - Market size and forecast 2024-2029 ($ million)
- Exhibits45: Data Table on Barrier coating - Market size and forecast 2024-2029 ($ million)
- Exhibits46: Chart on Barrier coating - Year-over-year growth 2024-2029 (%)
- Exhibits47: Data Table on Barrier coating - Year-over-year growth 2024-2029 (%)
- Exhibits48: Chart on Others - Market size and forecast 2024-2029 ($ million)
- Exhibits49: Data Table on Others - Market size and forecast 2024-2029 ($ million)
- Exhibits50: Chart on Others - Year-over-year growth 2024-2029 (%)
- Exhibits51: Data Table on Others - Year-over-year growth 2024-2029 (%)
- Exhibits52: Market opportunity by Application ($ million)
- Exhibits53: Data Table on Market opportunity by Application ($ million)
- Exhibits54: Chart on Type - Market share 2024-2029 (%)
- Exhibits55: Data Table on Type - Market share 2024-2029 (%)
- Exhibits56: Chart on Comparison by Type
- Exhibits57: Data Table on Comparison by Type
- Exhibits58: Chart on 20wt percentage comonomer - Market size and forecast 2024-2029 ($ million)
- Exhibits59: Data Table on 20wt percentage comonomer - Market size and forecast 2024-2029 ($ million)
- Exhibits60: Chart on 20wt percentage comonomer - Year-over-year growth 2024-2029 (%)
- Exhibits61: Data Table on 20wt percentage comonomer - Year-over-year growth 2024-2029 (%)
- Exhibits62: Chart on 9wt percentage comonomer - Market size and forecast 2024-2029 ($ million)
- Exhibits63: Data Table on 9wt percentage comonomer - Market size and forecast 2024-2029 ($ million)
- Exhibits64: Chart on 9wt percentage comonomer - Year-over-year growth 2024-2029 (%)
- Exhibits65: Data Table on 9wt percentage comonomer - Year-over-year growth 2024-2029 (%)
- Exhibits66: Chart on 5wt percentage comonomer - Market size and forecast 2024-2029 ($ million)
- Exhibits67: Data Table on 5wt percentage comonomer - Market size and forecast 2024-2029 ($ million)
- Exhibits68: Chart on 5wt percentage comonomer - Year-over-year growth 2024-2029 (%)
- Exhibits69: Data Table on 5wt percentage comonomer - Year-over-year growth 2024-2029 (%)
- Exhibits70: Market opportunity by Type ($ million)
- Exhibits71: Data Table on Market opportunity by Type ($ million)
- Exhibits72: Analysis of price sensitivity, lifecycle, customer purchase basket, adoption rates, and purchase criteria
- Exhibits73: Chart on Market share By Geographical Landscape 2024-2029 (%)
- Exhibits74: Data Table on Market share By Geographical Landscape 2024-2029 (%)
- Exhibits75: Chart on Geographic comparison
- Exhibits76: Data Table on Geographic comparison
- Exhibits77: Chart on APAC - Market size and forecast 2024-2029 ($ million)
- Exhibits78: Data Table on APAC - Market size and forecast 2024-2029 ($ million)
- Exhibits79: Chart on APAC - Year-over-year growth 2024-2029 (%)
- Exhibits80: Data Table on APAC - Year-over-year growth 2024-2029 (%)
- Exhibits81: Chart on North America - Market size and forecast 2024-2029 ($ million)
- Exhibits82: Data Table on North America - Market size and forecast 2024-2029 ($ million)
- Exhibits83: Chart on North America - Year-over-year growth 2024-2029 (%)
- Exhibits84: Data Table on North America - Year-over-year growth 2024-2029 (%)
- Exhibits85: Chart on Europe - Market size and forecast 2024-2029 ($ million)
- Exhibits86: Data Table on Europe - Market size and forecast 2024-2029 ($ million)
- Exhibits87: Chart on Europe - Year-over-year growth 2024-2029 (%)
- Exhibits88: Data Table on Europe - Year-over-year growth 2024-2029 (%)
- Exhibits89: Chart on South America - Market size and forecast 2024-2029 ($ million)
- Exhibits90: Data Table on South America - Market size and forecast 2024-2029 ($ million)
- Exhibits91: Chart on South America - Year-over-year growth 2024-2029 (%)
- Exhibits92: Data Table on South America - Year-over-year growth 2024-2029 (%)
- Exhibits93: Chart on Middle East and Africa - Market size and forecast 2024-2029 ($ million)
- Exhibits94: Data Table on Middle East and Africa - Market size and forecast 2024-2029 ($ million)
- Exhibits95: Chart on Middle East and Africa - Year-over-year growth 2024-2029 (%)
- Exhibits96: Data Table on Middle East and Africa - Year-over-year growth 2024-2029 (%)
- Exhibits97: Chart on China - Market size and forecast 2024-2029 ($ million)
- Exhibits98: Data Table on China - Market size and forecast 2024-2029 ($ million)
- Exhibits99: Chart on China - Year-over-year growth 2024-2029 (%)
- Exhibits100: Data Table on China - Year-over-year growth 2024-2029 (%)
- Exhibits101: Chart on US - Market size and forecast 2024-2029 ($ million)
- Exhibits102: Data Table on US - Market size and forecast 2024-2029 ($ million)
- Exhibits103: Chart on US - Year-over-year growth 2024-2029 (%)
- Exhibits104: Data Table on US - Year-over-year growth 2024-2029 (%)
- Exhibits105: Chart on Germany - Market size and forecast 2024-2029 ($ million)
- Exhibits106: Data Table on Germany - Market size and forecast 2024-2029 ($ million)
- Exhibits107: Chart on Germany - Year-over-year growth 2024-2029 (%)
- Exhibits108: Data Table on Germany - Year-over-year growth 2024-2029 (%)
- Exhibits109: Chart on Brazil - Market size and forecast 2024-2029 ($ million)
- Exhibits110: Data Table on Brazil - Market size and forecast 2024-2029 ($ million)
- Exhibits111: Chart on Brazil - Year-over-year growth 2024-2029 (%)
- Exhibits112: Data Table on Brazil - Year-over-year growth 2024-2029 (%)
- Exhibits113: Chart on Japan - Market size and forecast 2024-2029 ($ million)
- Exhibits114: Data Table on Japan - Market size and forecast 2024-2029 ($ million)
- Exhibits115: Chart on Japan - Year-over-year growth 2024-2029 (%)
- Exhibits116: Data Table on Japan - Year-over-year growth 2024-2029 (%)
- Exhibits117: Chart on France - Market size and forecast 2024-2029 ($ million)
- Exhibits118: Data Table on France - Market size and forecast 2024-2029 ($ million)
- Exhibits119: Chart on France - Year-over-year growth 2024-2029 (%)
- Exhibits120: Data Table on France - Year-over-year growth 2024-2029 (%)
- Exhibits121: Chart on India - Market size and forecast 2024-2029 ($ million)
- Exhibits122: Data Table on India - Market size and forecast 2024-2029 ($ million)
- Exhibits123: Chart on India - Year-over-year growth 2024-2029 (%)
- Exhibits124: Data Table on India - Year-over-year growth 2024-2029 (%)
- Exhibits125: Chart on Canada - Market size and forecast 2024-2029 ($ million)
- Exhibits126: Data Table on Canada - Market size and forecast 2024-2029 ($ million)
- Exhibits127: Chart on Canada - Year-over-year growth 2024-2029 (%)
- Exhibits128: Data Table on Canada - Year-over-year growth 2024-2029 (%)
- Exhibits129: Chart on UK - Market size and forecast 2024-2029 ($ million)
- Exhibits130: Data Table on UK - Market size and forecast 2024-2029 ($ million)
- Exhibits131: Chart on UK - Year-over-year growth 2024-2029 (%)
- Exhibits132: Data Table on UK - Year-over-year growth 2024-2029 (%)
- Exhibits133: Chart on UAE - Market size and forecast 2024-2029 ($ million)
- Exhibits134: Data Table on UAE - Market size and forecast 2024-2029 ($ million)
- Exhibits135: Chart on UAE - Year-over-year growth 2024-2029 (%)
- Exhibits136: Data Table on UAE - Year-over-year growth 2024-2029 (%)
- Exhibits137: Market opportunity By Geographical Landscape ($ million)
- Exhibits138: Data Tables on Market opportunity By Geographical Landscape ($ million)
- Exhibits139: Impact of drivers and challenges in 2024 and 2029
- Exhibits140: Overview on criticality of inputs and factors of differentiation
- Exhibits141: Overview on factors of disruption
- Exhibits142: Impact of key risks on business
- Exhibits143: Companies covered
- Exhibits144: Company ranking index
- Exhibits145: Matrix on companies position and classification
- Exhibits146: Arkema - Overview
- Exhibits147: Arkema - Business segments
- Exhibits148: Arkema - Key news
- Exhibits149: Arkema - Key offerings
- Exhibits150: Arkema - Segment focus
- Exhibits151: SWOT
- Exhibits152: BYK Chemie GmbH - Overview
- Exhibits153: BYK Chemie GmbH - Product / Service
- Exhibits154: BYK Chemie GmbH - Key offerings
- Exhibits155: SWOT
- Exhibits156: Exxon Mobil Corp. - Overview
- Exhibits157: Exxon Mobil Corp. - Business segments
- Exhibits158: Exxon Mobil Corp. - Key news
- Exhibits159: Exxon Mobil Corp. - Key offerings
- Exhibits160: Exxon Mobil Corp. - Segment focus
- Exhibits161: SWOT
- Exhibits162: Honeywell International Inc. - Overview
- Exhibits163: Honeywell International Inc. - Business segments
- Exhibits164: Honeywell International Inc. - Key news
- Exhibits165: Honeywell International Inc. - Key offerings
- Exhibits166: Honeywell International Inc. - Segment focus
- Exhibits167: SWOT
- Exhibits168: Jiangsu Victory Chemical Co. Ltd. - Overview
- Exhibits169: Jiangsu Victory Chemical Co. Ltd. - Product / Service
- Exhibits170: Jiangsu Victory Chemical Co. Ltd. - Key offerings
- Exhibits171: SWOT
- Exhibits172: LyondellBasell Industries NV - Overview
- Exhibits173: LyondellBasell Industries NV - Business segments
- Exhibits174: LyondellBasell Industries NV - Key news
- Exhibits175: LyondellBasell Industries NV - Key offerings
- Exhibits176: LyondellBasell Industries NV - Segment focus
- Exhibits177: SWOT
- Exhibits178: Michelman Inc. - Overview
- Exhibits179: Michelman Inc. - Product / Service
- Exhibits180: Michelman Inc. - Key offerings
- Exhibits181: SWOT
- Exhibits182: Nanjing Tianshi New Material Technology Co. Ltd. - Overview
- Exhibits183: Nanjing Tianshi New Material Technology Co. Ltd. - Product / Service
- Exhibits184: Nanjing Tianshi New Material Technology Co. Ltd. - Key offerings
- Exhibits185: SWOT
- Exhibits186: NIPPON SHOKUBAI CO. LTD - Overview
- Exhibits187: NIPPON SHOKUBAI CO. LTD - Business segments
- Exhibits188: NIPPON SHOKUBAI CO. LTD - Key offerings
- Exhibits189: NIPPON SHOKUBAI CO. LTD - Segment focus
- Exhibits190: SWOT
- Exhibits191: Sigma Aldrich Chemicals Pvt. Ltd. - Overview
- Exhibits192: Sigma Aldrich Chemicals Pvt. Ltd. - Product / Service
- Exhibits193: Sigma Aldrich Chemicals Pvt. Ltd. - Key offerings
- Exhibits194: SWOT
- Exhibits195: SK Chemicals Co. Ltd. - Overview
- Exhibits196: SK Chemicals Co. Ltd. - Product / Service
- Exhibits197: SK Chemicals Co. Ltd. - Key news
- Exhibits198: SK Chemicals Co. Ltd. - Key offerings
- Exhibits199: SWOT
- Exhibits200: SNP Inc. - Overview
- Exhibits201: SNP Inc. - Product / Service
- Exhibits202: SNP Inc. - Key offerings
- Exhibits203: SWOT
- Exhibits204: Ter Group - Overview
- Exhibits205: Ter Group - Product / Service
- Exhibits206: Ter Group - Key offerings
- Exhibits207: SWOT
- Exhibits208: The Dow Chemical Co. - Overview
- Exhibits209: The Dow Chemical Co. - Business segments
- Exhibits210: The Dow Chemical Co. - Key news
- Exhibits211: The Dow Chemical Co. - Key offerings
- Exhibits212: The Dow Chemical Co. - Segment focus
- Exhibits213: SWOT
- Exhibits214: Thermo Fisher Scientific Inc. - Overview
- Exhibits215: Thermo Fisher Scientific Inc. - Business segments
- Exhibits216: Thermo Fisher Scientific Inc. - Key news
- Exhibits217: Thermo Fisher Scientific Inc. - Key offerings
- Exhibits218: Thermo Fisher Scientific Inc. - Segment focus
- Exhibits219: SWOT
- Exhibits220: Inclusions checklist
- Exhibits221: Exclusions checklist
- Exhibits222: Currency conversion rates for US$
- Exhibits223: Research methodology
- Exhibits224: Information sources
- Exhibits225: Data validation
- Exhibits226: Validation techniques employed for market sizing
- Exhibits227: Data synthesis
- Exhibits228: 360 degree market analysis
- Exhibits229: List of abbreviations
The ethylene acrylic acid copolymer market is forecasted to grow by $ 299.8 mn during 2024-2029, accelerating at a CAGR of 11.4% during the forecast period. The report on the ethylene acrylic acid copolymer market provides a holistic analysis, market size and forecast, trends, growth drivers, and challenges, as well as vendor analysis covering around 25 vendors.
The report offers an up-to-date analysis regarding the current market scenario, the latest trends and drivers, and the overall market environment. The market is driven by increasing demand in food packaging industry, growing demand for coatings, and growth of cosmetic and personal care industry.
| Market Scope | |
|---|---|
| Base Year | 2025 |
| End Year | 2029 |
| Series Year | 2025-2029 |
| Growth Momentum | Accelerate |
| YOY 2025 | 9.9% |
| CAGR | 11.4% |
| Incremental Value | $299.8 mn |
Technavio's ethylene acrylic acid copolymer market is segmented as below:
By Application
- Adhesives
- Barrier coating
- Others
By Type
- 20wt percentage comonomer
- 9wt percentage comonomer
- 5wt percentage comonomer
By Geographical Landscape
- APAC
- North America
- Europe
- South America
- Middle East and Africa
This study identifies the rise in demand for bio-based acrylic acid as one of the prime reasons driving the ethylene acrylic acid copolymer market growth during the next few years. Also, increasing demand for flexible liquid packaging pouches and increasing preference for acrylic-based powder coating will lead to sizable demand in the market.
The report on the ethylene acrylic acid copolymer market covers the following areas:
- Ethylene Acrylic Acid Copolymer Market sizing
- Ethylene Acrylic Acid Copolymer Market forecast
- Ethylene Acrylic Acid Copolymer Market industry analysis
The robust vendor analysis is designed to help clients improve their market position, and in line with this, this report provides a detailed analysis of several leading ethylene acrylic acid copolymer market vendors that include Angene International Ltd., Arkema, BYK Chemie GmbH, Exxon Mobil Corp., Honeywell International Inc., Jiangsu Victory Chemical Co. Ltd., LyondellBasell Industries NV, Michelman Inc., Nanjing Tianshi New Material Technology Co. Ltd., NIPPON SHOKUBAI CO. LTD, NSB Polymers GmbH, Parchem Fine and Specialty Chemicals Inc., Qingdao Hairuite Chemical Material Co. Ltd., Shanghai Songhan Plastic Technology Co. Ltd., Sigma Aldrich Chemicals Pvt. Ltd., SK Chemicals Co. Ltd., SNP Inc., Ter Group, The Dow Chemical Co., and Thermo Fisher Scientific Inc.. Also, the ethylene acrylic acid copolymer market analysis report includes information on upcoming trends and challenges that will influence market growth. This is to help companies strategize and leverage all forthcoming growth opportunities.
The study was conducted using an objective combination of primary and secondary information including inputs from key participants in the industry. The report contains a comprehensive market and vendor landscape in addition to an analysis of the key vendors.
The publisher presents a detailed picture of the market by the way of study, synthesis, and summation of data from multiple sources by an analysis of key parameters such as profit, pricing, competition, and promotions. It presents various market facets by identifying the key industry influencers. The data presented is comprehensive, reliable, and a result of extensive primary and secondary research. The market research reports provide a complete competitive landscape and an in-depth vendor selection methodology and analysis using qualitative and quantitative research to forecast accurate market growth.
Table of Contents
1 Executive Summary
- 1.1 Market overview
- Executive Summary - Chart on Market Overview
- Executive Summary - Data Table on Market Overview
- Executive Summary - Chart on Global Market Characteristics
- Executive Summary - Chart on Market By Geographical Landscape
- Executive Summary - Chart on Market Segmentation by Application
- Executive Summary - Chart on Market Segmentation by Type
- Executive Summary - Chart on Incremental Growth
- Executive Summary - Data Table on Incremental Growth
- Executive Summary - Chart on Company Market Positioning
2 Technavio Analysis
- 2.1 Analysis of price sensitivity, lifecycle, customer purchase basket, adoption rates, and purchase criteria
- Analysis of price sensitivity, lifecycle, customer purchase basket, adoption rates, and purchase criteria
- 2.2 Criticality of inputs and Factors of differentiation
- Overview on criticality of inputs and factors of differentiation
- 2.3 Factors of disruption
- Overview on factors of disruption
- 2.4 Impact of drivers and challenges
- Impact of drivers and challenges in 2024 and 2029
3 Market Landscape
- 3.1 Market ecosystem
- Parent Market
- Data Table on - Parent Market
- 3.2 Market characteristics
- Market characteristics analysis
- 3.3 Value chain analysis
- Value chain analysis
4 Market Sizing
- 4.1 Market definition
- Offerings of companies included in the market definition
- 4.2 Market segment analysis
- Market segments
- 4.3 Market size 2024
- 4.4 Market outlook: Forecast for 2024-2029
- Chart on Global - Market size and forecast 2024-2029 ($ million)
- Data Table on Global - Market size and forecast 2024-2029 ($ million)
- Chart on Global Market: Year-over-year growth 2024-2029 (%)
- Data Table on Global Market: Year-over-year growth 2024-2029 (%)
5 Historic Market Size
- 5.1 Global Ethylene Acrylic Acid Copolymer Market 2019 - 2023
- Historic Market Size - Data Table on Global Ethylene Acrylic Acid Copolymer Market 2019 - 2023 ($ million)
- 5.2 Application segment analysis 2019 - 2023
- Historic Market Size - Application Segment 2019 - 2023 ($ million)
- 5.3 Type segment analysis 2019 - 2023
- Historic Market Size - Type Segment 2019 - 2023 ($ million)
- 5.4 Geography segment analysis 2019 - 2023
- Historic Market Size - Geography Segment 2019 - 2023 ($ million)
- 5.5 Country segment analysis 2019 - 2023
- Historic Market Size - Country Segment 2019 - 2023 ($ million)
6 Qualitative Analysis
- 6.1 The AI impact on Global Ethylene Acrylic Acid Copolymer Market
7 Five Forces Analysis
- 7.1 Five forces summary
- Five forces analysis - Comparison between 2024 and 2029
- 7.2 Bargaining power of buyers
- Bargaining power of buyers - Impact of key factors 2024 and 2029
- 7.3 Bargaining power of suppliers
- Bargaining power of suppliers - Impact of key factors in 2024 and 2029
- 7.4 Threat of new entrants
- Threat of new entrants - Impact of key factors in 2024 and 2029
- 7.5 Threat of substitutes
- Threat of substitutes - Impact of key factors in 2024 and 2029
- 7.6 Threat of rivalry
- Threat of rivalry - Impact of key factors in 2024 and 2029
- 7.7 Market condition
- Chart on Market condition - Five forces 2024 and 2029
8 Market Segmentation by Application
- 8.1 Market segments
- Chart on Application - Market share 2024-2029 (%)
- Data Table on Application - Market share 2024-2029 (%)
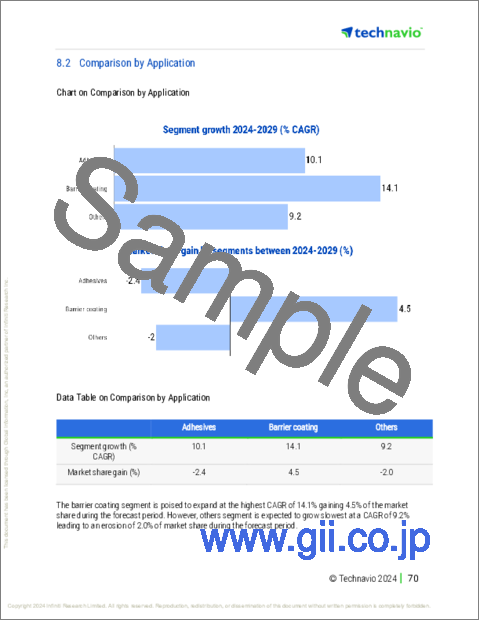
- 8.2 Comparison by Application
- Chart on Comparison by Application
- Data Table on Comparison by Application
- 8.3 Adhesives - Market size and forecast 2024-2029
- Chart on Adhesives - Market size and forecast 2024-2029 ($ million)
- Data Table on Adhesives - Market size and forecast 2024-2029 ($ million)
- Chart on Adhesives - Year-over-year growth 2024-2029 (%)
- Data Table on Adhesives - Year-over-year growth 2024-2029 (%)
- 8.4 Barrier coating - Market size and forecast 2024-2029
- Chart on Barrier coating - Market size and forecast 2024-2029 ($ million)
- Data Table on Barrier coating - Market size and forecast 2024-2029 ($ million)
- Chart on Barrier coating - Year-over-year growth 2024-2029 (%)
- Data Table on Barrier coating - Year-over-year growth 2024-2029 (%)
- 8.5 Others - Market size and forecast 2024-2029
- Chart on Others - Market size and forecast 2024-2029 ($ million)
- Data Table on Others - Market size and forecast 2024-2029 ($ million)
- Chart on Others - Year-over-year growth 2024-2029 (%)
- Data Table on Others - Year-over-year growth 2024-2029 (%)
- 8.6 Market opportunity by Application
- Market opportunity by Application ($ million)
- Data Table on Market opportunity by Application ($ million)
9 Market Segmentation by Type
- 9.1 Market segments
- Chart on Type - Market share 2024-2029 (%)
- Data Table on Type - Market share 2024-2029 (%)
- 9.2 Comparison by Type
- Chart on Comparison by Type
- Data Table on Comparison by Type
- 20wt percentage comonomer - Market size and forecast 2024-2029
- Chart on 20wt percentage comonomer - Market size and forecast 2024-2029 ($ million)
- Data Table on 20wt percentage comonomer - Market size and forecast 2024-2029 ($ million)
- Chart on 20wt percentage comonomer - Year-over-year growth 2024-2029 (%)
- Data Table on 20wt percentage comonomer - Year-over-year growth 2024-2029 (%)
- 9wt percentage comonomer - Market size and forecast 2024-2029
- Chart on 9wt percentage comonomer - Market size and forecast 2024-2029 ($ million)
- Data Table on 9wt percentage comonomer - Market size and forecast 2024-2029 ($ million)
- Chart on 9wt percentage comonomer - Year-over-year growth 2024-2029 (%)
- Data Table on 9wt percentage comonomer - Year-over-year growth 2024-2029 (%)
- 5wt percentage comonomer - Market size and forecast 2024-2029
- Chart on 5wt percentage comonomer - Market size and forecast 2024-2029 ($ million)
- Data Table on 5wt percentage comonomer - Market size and forecast 2024-2029 ($ million)
- Chart on 5wt percentage comonomer - Year-over-year growth 2024-2029 (%)
- Data Table on 5wt percentage comonomer - Year-over-year growth 2024-2029 (%)
- 9.6 Market opportunity by Type
- Market opportunity by Type ($ million)
- Data Table on Market opportunity by Type ($ million)
10 Customer Landscape
- 10.1 Customer landscape overview
- Analysis of price sensitivity, lifecycle, customer purchase basket, adoption rates, and purchase criteria
11 Geographic Landscape
- 11.1 Geographic segmentation
- Chart on Market share By Geographical Landscape 2024-2029 (%)
- Data Table on Market share By Geographical Landscape 2024-2029 (%)
- 11.2 Geographic comparison
- Chart on Geographic comparison
- Data Table on Geographic comparison
- 11.3 APAC - Market size and forecast 2024-2029
- Chart on APAC - Market size and forecast 2024-2029 ($ million)
- Data Table on APAC - Market size and forecast 2024-2029 ($ million)
- Chart on APAC - Year-over-year growth 2024-2029 (%)
- Data Table on APAC - Year-over-year growth 2024-2029 (%)
- 11.4 North America - Market size and forecast 2024-2029
- Chart on North America - Market size and forecast 2024-2029 ($ million)
- Data Table on North America - Market size and forecast 2024-2029 ($ million)
- Chart on North America - Year-over-year growth 2024-2029 (%)
- Data Table on North America - Year-over-year growth 2024-2029 (%)
- 11.5 Europe - Market size and forecast 2024-2029
- Chart on Europe - Market size and forecast 2024-2029 ($ million)
- Data Table on Europe - Market size and forecast 2024-2029 ($ million)
- Chart on Europe - Year-over-year growth 2024-2029 (%)
- Data Table on Europe - Year-over-year growth 2024-2029 (%)
- 11.6 South America - Market size and forecast 2024-2029
- Chart on South America - Market size and forecast 2024-2029 ($ million)
- Data Table on South America - Market size and forecast 2024-2029 ($ million)
- Chart on South America - Year-over-year growth 2024-2029 (%)
- Data Table on South America - Year-over-year growth 2024-2029 (%)
- 11.7 Middle East and Africa - Market size and forecast 2024-2029
- Chart on Middle East and Africa - Market size and forecast 2024-2029 ($ million)
- Data Table on Middle East and Africa - Market size and forecast 2024-2029 ($ million)
- Chart on Middle East and Africa - Year-over-year growth 2024-2029 (%)
- Data Table on Middle East and Africa - Year-over-year growth 2024-2029 (%)
- 11.8 China - Market size and forecast 2024-2029
- Chart on China - Market size and forecast 2024-2029 ($ million)
- Data Table on China - Market size and forecast 2024-2029 ($ million)
- Chart on China - Year-over-year growth 2024-2029 (%)
- Data Table on China - Year-over-year growth 2024-2029 (%)
- 11.9 US - Market size and forecast 2024-2029
- Chart on US - Market size and forecast 2024-2029 ($ million)
- Data Table on US - Market size and forecast 2024-2029 ($ million)
- Chart on US - Year-over-year growth 2024-2029 (%)
- Data Table on US - Year-over-year growth 2024-2029 (%)
- 11.10 Germany - Market size and forecast 2024-2029
- Chart on Germany - Market size and forecast 2024-2029 ($ million)
- Data Table on Germany - Market size and forecast 2024-2029 ($ million)
- Chart on Germany - Year-over-year growth 2024-2029 (%)
- Data Table on Germany - Year-over-year growth 2024-2029 (%)
- 11.11 Brazil - Market size and forecast 2024-2029
- Chart on Brazil - Market size and forecast 2024-2029 ($ million)
- Data Table on Brazil - Market size and forecast 2024-2029 ($ million)
- Chart on Brazil - Year-over-year growth 2024-2029 (%)
- Data Table on Brazil - Year-over-year growth 2024-2029 (%)
- 11.12 Japan - Market size and forecast 2024-2029
- Chart on Japan - Market size and forecast 2024-2029 ($ million)
- Data Table on Japan - Market size and forecast 2024-2029 ($ million)
- Chart on Japan - Year-over-year growth 2024-2029 (%)
- Data Table on Japan - Year-over-year growth 2024-2029 (%)
- 11.13 France - Market size and forecast 2024-2029
- Chart on France - Market size and forecast 2024-2029 ($ million)
- Data Table on France - Market size and forecast 2024-2029 ($ million)
- Chart on France - Year-over-year growth 2024-2029 (%)
- Data Table on France - Year-over-year growth 2024-2029 (%)
- 11.14 India - Market size and forecast 2024-2029
- Chart on India - Market size and forecast 2024-2029 ($ million)
- Data Table on India - Market size and forecast 2024-2029 ($ million)
- Chart on India - Year-over-year growth 2024-2029 (%)
- Data Table on India - Year-over-year growth 2024-2029 (%)
- 11.15 Canada - Market size and forecast 2024-2029
- Chart on Canada - Market size and forecast 2024-2029 ($ million)
- Data Table on Canada - Market size and forecast 2024-2029 ($ million)
- Chart on Canada - Year-over-year growth 2024-2029 (%)
- Data Table on Canada - Year-over-year growth 2024-2029 (%)
- 11.16 UK - Market size and forecast 2024-2029
- Chart on UK - Market size and forecast 2024-2029 ($ million)
- Data Table on UK - Market size and forecast 2024-2029 ($ million)
- Chart on UK - Year-over-year growth 2024-2029 (%)
- Data Table on UK - Year-over-year growth 2024-2029 (%)
- 11.17 UAE - Market size and forecast 2024-2029
- Chart on UAE - Market size and forecast 2024-2029 ($ million)
- Data Table on UAE - Market size and forecast 2024-2029 ($ million)
- Chart on UAE - Year-over-year growth 2024-2029 (%)
- Data Table on UAE - Year-over-year growth 2024-2029 (%)
- 11.18 Market opportunity By Geographical Landscape
- Market opportunity By Geographical Landscape ($ million)
- Data Tables on Market opportunity By Geographical Landscape ($ million)
12 Drivers, Challenges, and Opportunity/Restraints
- 12.1 Market drivers
- 12.2 Market challenges
- 12.3 Impact of drivers and challenges
- Impact of drivers and challenges in 2024 and 2029
- 12.4 Market opportunities/restraints
13 Competitive Landscape
- 13.1 Overview
- 13.2 Competitive Landscape
- Overview on criticality of inputs and factors of differentiation
- 13.3 Landscape disruption
- Overview on factors of disruption
- 13.4 Industry risks
- Impact of key risks on business
14 Competitive Analysis
- 14.1 Companies profiled
- Companies covered
- 14.2 Company ranking index
- Company ranking index
- 14.3 Market positioning of companies
- Matrix on companies position and classification
- 14.4 Arkema
- Arkema - Overview
- Arkema - Business segments
- Arkema - Key news
- Arkema - Key offerings
- Arkema - Segment focus
- SWOT
- 14.5 BYK Chemie GmbH
- ByK Chemie GmbH - Overview
- ByK Chemie GmbH - Product / Service
- ByK Chemie GmbH - Key offerings
- SWOT
- 14.6 Exxon Mobil Corp.
- Exxon Mobil Corp. - Overview
- Exxon Mobil Corp. - Business segments
- Exxon Mobil Corp. - Key news
- Exxon Mobil Corp. - Key offerings
- Exxon Mobil Corp. - Segment focus
- SWOT
- 14.7 Honeywell International Inc.
- Honeywell International Inc. - Overview
- Honeywell International Inc. - Business segments
- Honeywell International Inc. - Key news
- Honeywell International Inc. - Key offerings
- Honeywell International Inc. - Segment focus
- SWOT
- 14.8 Jiangsu Victory Chemical Co. Ltd.
- Jiangsu Victory Chemical Co. Ltd. - Overview
- Jiangsu Victory Chemical Co. Ltd. - Product / Service
- Jiangsu Victory Chemical Co. Ltd. - Key offerings
- SWOT
- 14.9 LyondellBasell Industries NV
- LyondellBasell Industries NV - Overview
- LyondellBasell Industries NV - Business segments
- LyondellBasell Industries NV - Key news
- LyondellBasell Industries NV - Key offerings
- LyondellBasell Industries NV - Segment focus
- SWOT
- 14.10 Michelman Inc.
- Michelman Inc. - Overview
- Michelman Inc. - Product / Service
- Michelman Inc. - Key offerings
- SWOT
- 14.11 Nanjing Tianshi New Material Technology Co. Ltd.
- Nanjing Tianshi New Material Technology Co. Ltd. - Overview
- Nanjing Tianshi New Material Technology Co. Ltd. - Product / Service
- Nanjing Tianshi New Material Technology Co. Ltd. - Key offerings
- SWOT
- 14.12 NIPPON SHOKUBAI CO. LTD
- NIPPON SHOKUBAI CO. LTD - Overview
- NIPPON SHOKUBAI CO. LTD - Business segments
- NIPPON SHOKUBAI CO. LTD - Key offerings
- NIPPON SHOKUBAI CO. LTD - Segment focus
- SWOT
- 14.13 Sigma Aldrich Chemicals Pvt. Ltd.
- Sigma Aldrich Chemicals Pvt. Ltd. - Overview
- Sigma Aldrich Chemicals Pvt. Ltd. - Product / Service
- Sigma Aldrich Chemicals Pvt. Ltd. - Key offerings
- SWOT
- 14.14 SK Chemicals Co. Ltd.
- SK Chemicals Co. Ltd. - Overview
- SK Chemicals Co. Ltd. - Product / Service
- SK Chemicals Co. Ltd. - Key news
- SK Chemicals Co. Ltd. - Key offerings
- SWOT
- 14.15 SNP Inc.
- SNP Inc. - Overview
- SNP Inc. - Product / Service
- SNP Inc. - Key offerings
- SWOT
- 14.16 Ter Group
- Ter Group - Overview
- Ter Group - Product / Service
- Ter Group - Key offerings
- SWOT
- 14.17 The Dow Chemical Co.
- The Dow Chemical Co. - Overview
- The Dow Chemical Co. - Business segments
- The Dow Chemical Co. - Key news
- The Dow Chemical Co. - Key offerings
- The Dow Chemical Co. - Segment focus
- SWOT
- 14.18 Thermo Fisher Scientific Inc.
- Thermo Fisher Scientific Inc. - Overview
- Thermo Fisher Scientific Inc. - Business segments
- Thermo Fisher Scientific Inc. - Key news
- Thermo Fisher Scientific Inc. - Key offerings
- Thermo Fisher Scientific Inc. - Segment focus
- SWOT
15 Appendix
- 15.1 Scope of the report
- 15.2 Inclusions and exclusions checklist
- Inclusions checklist
- Exclusions checklist
- 15.3 Currency conversion rates for US$
- Currency conversion rates for US$
- 15.4 Research methodology
- Research methodology
- 15.5 Data procurement
- Information sources
- 15.6 Data validation
- Data validation
- 15.7 Validation techniques employed for market sizing
- Validation techniques employed for market sizing
- 15.8 Data synthesis
- Data synthesis
- 15.9 360 degree market analysis
- 360 degree market analysis
- 15.10 List of abbreviations
- List of abbreviations
