|
|
市場調査レポート
商品コード
1634347
超音波装置の世界市場(2025年~2029年)Global Ultrasound Equipment Market 2025-2029 |
||||||
|
|||||||
カスタマイズ可能
|
|||||||


| 超音波装置の世界市場(2025年~2029年) |
|
出版日: 2025年01月08日
発行: TechNavio
ページ情報: 英文 203 Pages
納期: 即納可能
|

全表示
- 概要
- 図表
- 目次
超音波装置市場(2025年~2029年)
世界の超音波装置の市場規模は、2024年~2029年に32億6,960万米ドルに達し、予測期間中のCAGRは6.5%で成長すると予測されます。当レポートでは、超音波装置市場の全体的な分析、市場規模・予測、動向、成長促進要因、課題、約25のベンダーを網羅したベンダー分析などを掲載しています。
本レポートは、現在の市場シナリオ、最新動向と促進要因、市場環境全体に関する最新分析を提供しています。市場は、超音波装置の広範な応用、画質、体積超音波、新技術の進歩、早期診断と予防医療への注力によって牽引されています。
| 市場範囲 | |
|---|---|
| 基準年 | 2025年 |
| 終了年 | 2029年 |
| 予測期間 | 2025年~2029年 |
| 成長モメンタム | 加速 |
| 前年比2025年 | 6% |
| CAGR | 6.5% |
| 増分額 | 32億6,960万米ドル |
本調査では、今後数年間の超音波装置市場の成長を牽引する主な要因の1つとして、人工知能(AI)の超音波への統合を挙げています。また、ワイヤレス技術の強化や新製品の発売は、市場の大きな需要につながります。
目次
第1章 エグゼクティブサマリー
- 市場概要
第2章 Technavioの分析
- 価格感度・ライフサイクル・顧客購入バスケット・採用率・購入基準の分析
- インプットの重要性と差別化の要因
- ディスラプションの要因
- 促進要因と課題の影響
第3章 市場情勢
- 市場エコシステム
- 市場の特徴
- バリューチェーン分析
第4章 市場規模
- 市場の定義
- 市場セグメント分析
- 市場規模(2024年)
- 市場の見通し(2024年~2029年)
第5章 市場規模実績
- 超音波装置の世界市場(2019年~2023年)
- エンドユーザーセグメント分析(2019年~2023年)
- 製品タイプセグメント分析(2019年~2023年)
- 地域セグメント分析(2019年~2023年)
- 国セグメント分析(2019年~2023年)
第6章 定性分析
- AIの影響:超音波装置の世界市場
第7章 ファイブフォース分析
- ファイブフォースの要約
- 買い手の交渉力
- 供給企業の交渉力
- 新規参入業者の脅威
- 代替品の脅威
- 競争の脅威
- 市況
第8章 市場セグメンテーション:エンドユーザー別
- 市場セグメント
- 比較:エンドユーザー別
- 病院:市場規模と予測(2024年~2029年)
- 画像診断センター:市場規模と予測(2024年~2029年)
- 研究センター:市場規模と予測(2024年~2029年)
- その他:市場規模と予測(2024年~2029年)
- 市場機会:エンドユーザー別
第9章 市場セグメンテーション:製品タイプ別
- 市場セグメント
- 比較:製品タイプ別
- 据置型超音波装置:市場規模と予測(2024年~2029年)
- ポータブル超音波装置:市場規模と予測(2024年~2029年)
- 市場機会:製品タイプ別
第10章 顧客情勢
- 顧客情勢の概要
第11章 地域別情勢
- 地域別セグメンテーション
- 地域別比較
- 北米:市場規模と予測(2024年~2029年)
- 欧州:市場規模と予測(2024年~2029年)
- アジア:市場規模と予測(2024年~2029年)
- 世界のその他の地域:市場規模と予測(2024年~2029年)
- 米国:市場規模と予測(2024年~2029年)
- カナダ:市場規模と予測(2024年~2029年)
- ドイツ:市場規模と予測(2024年~2029年)
- 中国:市場規模と予測(2024年~2029年)
- 英国:市場規模と予測(2024年~2029年)
- 日本:市場規模と予測(2024年~2029年)
- フランス:市場規模と予測(2024年~2029年)
- インド:市場規模と予測(2024年~2029年)
- 韓国:市場規模と予測(2024年~2029年)
- イタリア:市場規模と予測(2024年~2029年)
- 市場機会:地域情勢別
第12章 促進要因・課題・機会・抑制要因
- 市場促進要因
- 市場の課題
- 促進要因と課題の影響
- 市場の機会・抑制要因
第13章 競合情勢
- 概要
- 競合情勢
- ディスラプションの状況
- 業界のリスク
第14章 競合分析
- 企業プロファイル
- 企業ランキング指数
- 企業の市場ポジショニング
- Boston Scientific Corp.
- Canon Inc.
- Carestream Health Inc.
- Chison Medical Technologies Co. Ltd.
- ContextVision AB
- Esaote Spa
- FUJIFILM Corp.
- GE Healthcare Technologies Inc.
- GlobalMedia Group LLC
- Hologic Inc.
- Konica Minolta Inc.
- Koninklijke Philips NV
- Samsung Electronics Co. Ltd.
- Shenzhen Mindray BioMedical Electronics Co. Ltd
- Siemens Healthineers AG
第15章 付録
Exhibits:
- Exhibits1: Executive Summary - Chart on Market Overview
- Exhibits2: Executive Summary - Data Table on Market Overview
- Exhibits3: Executive Summary - Chart on Global Market Characteristics
- Exhibits4: Executive Summary - Chart on Market By Geographical Landscape
- Exhibits5: Executive Summary - Chart on Market Segmentation by End-user
- Exhibits6: Executive Summary - Chart on Market Segmentation by Product Type
- Exhibits7: Executive Summary - Chart on Incremental Growth
- Exhibits8: Executive Summary - Data Table on Incremental Growth
- Exhibits9: Executive Summary - Chart on Company Market Positioning
- Exhibits10: Analysis of price sensitivity, lifecycle, customer purchase basket, adoption rates, and purchase criteria
- Exhibits11: Overview on criticality of inputs and factors of differentiation
- Exhibits12: Overview on factors of disruption
- Exhibits13: Impact of drivers and challenges in 2024 and 2029
- Exhibits14: Parent Market
- Exhibits15: Data Table on - Parent Market
- Exhibits16: Market characteristics analysis
- Exhibits17: Value chain analysis
- Exhibits18: Offerings of companies included in the market definition
- Exhibits19: Market segments
- Exhibits20: Chart on Global - Market size and forecast 2024-2029 ($ million)
- Exhibits21: Data Table on Global - Market size and forecast 2024-2029 ($ million)
- Exhibits22: Chart on Global Market: Year-over-year growth 2024-2029 (%)
- Exhibits23: Data Table on Global Market: Year-over-year growth 2024-2029 (%)
- Exhibits24: Historic Market Size - Data Table on Global Ultrasound Equipment Market 2019 - 2023 ($ million)
- Exhibits25: Historic Market Size - End-user Segment 2019 - 2023 ($ million)
- Exhibits26: Historic Market Size - Product Type Segment 2019 - 2023 ($ million)
- Exhibits27: Historic Market Size - Geography Segment 2019 - 2023 ($ million)
- Exhibits28: Historic Market Size - Country Segment 2019 - 2023 ($ million)
- Exhibits29: Five forces analysis - Comparison between 2024 and 2029
- Exhibits30: Bargaining power of buyers - Impact of key factors 2024 and 2029
- Exhibits31: Bargaining power of suppliers - Impact of key factors in 2024 and 2029
- Exhibits32: Threat of new entrants - Impact of key factors in 2024 and 2029
- Exhibits33: Threat of substitutes - Impact of key factors in 2024 and 2029
- Exhibits34: Threat of rivalry - Impact of key factors in 2024 and 2029
- Exhibits35: Chart on Market condition - Five forces 2024 and 2029
- Exhibits36: Chart on End-user - Market share 2024-2029 (%)
- Exhibits37: Data Table on End-user - Market share 2024-2029 (%)
- Exhibits38: Chart on Comparison by End-user
- Exhibits39: Data Table on Comparison by End-user
- Exhibits40: Chart on Hospitals - Market size and forecast 2024-2029 ($ million)
- Exhibits41: Data Table on Hospitals - Market size and forecast 2024-2029 ($ million)
- Exhibits42: Chart on Hospitals - Year-over-year growth 2024-2029 (%)
- Exhibits43: Data Table on Hospitals - Year-over-year growth 2024-2029 (%)
- Exhibits44: Chart on Imaging centers - Market size and forecast 2024-2029 ($ million)
- Exhibits45: Data Table on Imaging centers - Market size and forecast 2024-2029 ($ million)
- Exhibits46: Chart on Imaging centers - Year-over-year growth 2024-2029 (%)
- Exhibits47: Data Table on Imaging centers - Year-over-year growth 2024-2029 (%)
- Exhibits48: Chart on Research centers - Market size and forecast 2024-2029 ($ million)
- Exhibits49: Data Table on Research centers - Market size and forecast 2024-2029 ($ million)
- Exhibits50: Chart on Research centers - Year-over-year growth 2024-2029 (%)
- Exhibits51: Data Table on Research centers - Year-over-year growth 2024-2029 (%)
- Exhibits52: Chart on Others - Market size and forecast 2024-2029 ($ million)
- Exhibits53: Data Table on Others - Market size and forecast 2024-2029 ($ million)
- Exhibits54: Chart on Others - Year-over-year growth 2024-2029 (%)
- Exhibits55: Data Table on Others - Year-over-year growth 2024-2029 (%)
- Exhibits56: Market opportunity by End-user ($ million)
- Exhibits57: Data Table on Market opportunity by End-user ($ million)
- Exhibits58: Chart on Product Type - Market share 2024-2029 (%)
- Exhibits59: Data Table on Product Type - Market share 2024-2029 (%)
- Exhibits60: Chart on Comparison by Product Type
- Exhibits61: Data Table on Comparison by Product Type
- Exhibits62: Chart on Stationary ultrasound equipment - Market size and forecast 2024-2029 ($ million)
- Exhibits63: Data Table on Stationary ultrasound equipment - Market size and forecast 2024-2029 ($ million)
- Exhibits64: Chart on Stationary ultrasound equipment - Year-over-year growth 2024-2029 (%)
- Exhibits65: Data Table on Stationary ultrasound equipment - Year-over-year growth 2024-2029 (%)
- Exhibits66: Chart on Portable ultrasound equipment - Market size and forecast 2024-2029 ($ million)
- Exhibits67: Data Table on Portable ultrasound equipment - Market size and forecast 2024-2029 ($ million)
- Exhibits68: Chart on Portable ultrasound equipment - Year-over-year growth 2024-2029 (%)
- Exhibits69: Data Table on Portable ultrasound equipment - Year-over-year growth 2024-2029 (%)
- Exhibits70: Market opportunity by Product Type ($ million)
- Exhibits71: Data Table on Market opportunity by Product Type ($ million)
- Exhibits72: Analysis of price sensitivity, lifecycle, customer purchase basket, adoption rates, and purchase criteria
- Exhibits73: Chart on Market share By Geographical Landscape 2024-2029 (%)
- Exhibits74: Data Table on Market share By Geographical Landscape 2024-2029 (%)
- Exhibits75: Chart on Geographic comparison
- Exhibits76: Data Table on Geographic comparison
- Exhibits77: Chart on North America - Market size and forecast 2024-2029 ($ million)
- Exhibits78: Data Table on North America - Market size and forecast 2024-2029 ($ million)
- Exhibits79: Chart on North America - Year-over-year growth 2024-2029 (%)
- Exhibits80: Data Table on North America - Year-over-year growth 2024-2029 (%)
- Exhibits81: Chart on Europe - Market size and forecast 2024-2029 ($ million)
- Exhibits82: Data Table on Europe - Market size and forecast 2024-2029 ($ million)
- Exhibits83: Chart on Europe - Year-over-year growth 2024-2029 (%)
- Exhibits84: Data Table on Europe - Year-over-year growth 2024-2029 (%)
- Exhibits85: Chart on Asia - Market size and forecast 2024-2029 ($ million)
- Exhibits86: Data Table on Asia - Market size and forecast 2024-2029 ($ million)
- Exhibits87: Chart on Asia - Year-over-year growth 2024-2029 (%)
- Exhibits88: Data Table on Asia - Year-over-year growth 2024-2029 (%)
- Exhibits89: Chart on Rest of World (ROW) - Market size and forecast 2024-2029 ($ million)
- Exhibits90: Data Table on Rest of World (ROW) - Market size and forecast 2024-2029 ($ million)
- Exhibits91: Chart on Rest of World (ROW) - Year-over-year growth 2024-2029 (%)
- Exhibits92: Data Table on Rest of World (ROW) - Year-over-year growth 2024-2029 (%)
- Exhibits93: Chart on US - Market size and forecast 2024-2029 ($ million)
- Exhibits94: Data Table on US - Market size and forecast 2024-2029 ($ million)
- Exhibits95: Chart on US - Year-over-year growth 2024-2029 (%)
- Exhibits96: Data Table on US - Year-over-year growth 2024-2029 (%)
- Exhibits97: Chart on Canada - Market size and forecast 2024-2029 ($ million)
- Exhibits98: Data Table on Canada - Market size and forecast 2024-2029 ($ million)
- Exhibits99: Chart on Canada - Year-over-year growth 2024-2029 (%)
- Exhibits100: Data Table on Canada - Year-over-year growth 2024-2029 (%)
- Exhibits101: Chart on Germany - Market size and forecast 2024-2029 ($ million)
- Exhibits102: Data Table on Germany - Market size and forecast 2024-2029 ($ million)
- Exhibits103: Chart on Germany - Year-over-year growth 2024-2029 (%)
- Exhibits104: Data Table on Germany - Year-over-year growth 2024-2029 (%)
- Exhibits105: Chart on China - Market size and forecast 2024-2029 ($ million)
- Exhibits106: Data Table on China - Market size and forecast 2024-2029 ($ million)
- Exhibits107: Chart on China - Year-over-year growth 2024-2029 (%)
- Exhibits108: Data Table on China - Year-over-year growth 2024-2029 (%)
- Exhibits109: Chart on UK - Market size and forecast 2024-2029 ($ million)
- Exhibits110: Data Table on UK - Market size and forecast 2024-2029 ($ million)
- Exhibits111: Chart on UK - Year-over-year growth 2024-2029 (%)
- Exhibits112: Data Table on UK - Year-over-year growth 2024-2029 (%)
- Exhibits113: Chart on Japan - Market size and forecast 2024-2029 ($ million)
- Exhibits114: Data Table on Japan - Market size and forecast 2024-2029 ($ million)
- Exhibits115: Chart on Japan - Year-over-year growth 2024-2029 (%)
- Exhibits116: Data Table on Japan - Year-over-year growth 2024-2029 (%)
- Exhibits117: Chart on France - Market size and forecast 2024-2029 ($ million)
- Exhibits118: Data Table on France - Market size and forecast 2024-2029 ($ million)
- Exhibits119: Chart on France - Year-over-year growth 2024-2029 (%)
- Exhibits120: Data Table on France - Year-over-year growth 2024-2029 (%)
- Exhibits121: Chart on India - Market size and forecast 2024-2029 ($ million)
- Exhibits122: Data Table on India - Market size and forecast 2024-2029 ($ million)
- Exhibits123: Chart on India - Year-over-year growth 2024-2029 (%)
- Exhibits124: Data Table on India - Year-over-year growth 2024-2029 (%)
- Exhibits125: Chart on South Korea - Market size and forecast 2024-2029 ($ million)
- Exhibits126: Data Table on South Korea - Market size and forecast 2024-2029 ($ million)
- Exhibits127: Chart on South Korea - Year-over-year growth 2024-2029 (%)
- Exhibits128: Data Table on South Korea - Year-over-year growth 2024-2029 (%)
- Exhibits129: Chart on Italy - Market size and forecast 2024-2029 ($ million)
- Exhibits130: Data Table on Italy - Market size and forecast 2024-2029 ($ million)
- Exhibits131: Chart on Italy - Year-over-year growth 2024-2029 (%)
- Exhibits132: Data Table on Italy - Year-over-year growth 2024-2029 (%)
- Exhibits133: Market opportunity By Geographical Landscape ($ million)
- Exhibits134: Data Tables on Market opportunity By Geographical Landscape ($ million)
- Exhibits135: Impact of drivers and challenges in 2024 and 2029
- Exhibits136: Overview on criticality of inputs and factors of differentiation
- Exhibits137: Overview on factors of disruption
- Exhibits138: Impact of key risks on business
- Exhibits139: Companies covered
- Exhibits140: Company ranking index
- Exhibits141: Matrix on companies position and classification
- Exhibits142: Boston Scientific Corp. - Overview
- Exhibits143: Boston Scientific Corp. - Business segments
- Exhibits144: Boston Scientific Corp. - Key news
- Exhibits145: Boston Scientific Corp. - Key offerings
- Exhibits146: Boston Scientific Corp. - Segment focus
- Exhibits147: SWOT
- Exhibits148: Canon Inc. - Overview
- Exhibits149: Canon Inc. - Business segments
- Exhibits150: Canon Inc. - Key news
- Exhibits151: Canon Inc. - Key offerings
- Exhibits152: Canon Inc. - Segment focus
- Exhibits153: SWOT
- Exhibits154: Carestream Health Inc. - Overview
- Exhibits155: Carestream Health Inc. - Product / Service
- Exhibits156: Carestream Health Inc. - Key offerings
- Exhibits157: SWOT
- Exhibits158: Chison Medical Technologies Co. Ltd. - Overview
- Exhibits159: Chison Medical Technologies Co. Ltd. - Product / Service
- Exhibits160: Chison Medical Technologies Co. Ltd. - Key offerings
- Exhibits161: SWOT
- Exhibits162: ContextVision AB - Overview
- Exhibits163: ContextVision AB - Product / Service
- Exhibits164: ContextVision AB - Key offerings
- Exhibits165: SWOT
- Exhibits166: Esaote Spa - Overview
- Exhibits167: Esaote Spa - Product / Service
- Exhibits168: Esaote Spa - Key offerings
- Exhibits169: SWOT
- Exhibits170: FUJIFILM Corp. - Overview
- Exhibits171: FUJIFILM Corp. - Business segments
- Exhibits172: FUJIFILM Corp. - Key news
- Exhibits173: FUJIFILM Corp. - Key offerings
- Exhibits174: FUJIFILM Corp. - Segment focus
- Exhibits175: SWOT
- Exhibits176: GE Healthcare Technologies Inc. - Overview
- Exhibits177: GE Healthcare Technologies Inc. - Business segments
- Exhibits178: GE Healthcare Technologies Inc. - Key news
- Exhibits179: GE Healthcare Technologies Inc. - Key offerings
- Exhibits180: GE Healthcare Technologies Inc. - Segment focus
- Exhibits181: SWOT
- Exhibits182: GlobalMedia Group LLC - Overview
- Exhibits183: GlobalMedia Group LLC - Product / Service
- Exhibits184: GlobalMedia Group LLC - Key offerings
- Exhibits185: SWOT
- Exhibits186: Hologic Inc. - Overview
- Exhibits187: Hologic Inc. - Business segments
- Exhibits188: Hologic Inc. - Key news
- Exhibits189: Hologic Inc. - Key offerings
- Exhibits190: Hologic Inc. - Segment focus
- Exhibits191: SWOT
- Exhibits192: Konica Minolta Inc. - Overview
- Exhibits193: Konica Minolta Inc. - Business segments
- Exhibits194: Konica Minolta Inc. - Key news
- Exhibits195: Konica Minolta Inc. - Key offerings
- Exhibits196: Konica Minolta Inc. - Segment focus
- Exhibits197: SWOT
- Exhibits198: Koninklijke Philips NV - Overview
- Exhibits199: Koninklijke Philips NV - Business segments
- Exhibits200: Koninklijke Philips NV - Key news
- Exhibits201: Koninklijke Philips NV - Key offerings
- Exhibits202: Koninklijke Philips NV - Segment focus
- Exhibits203: SWOT
- Exhibits204: Samsung Electronics Co. Ltd. - Overview
- Exhibits205: Samsung Electronics Co. Ltd. - Business segments
- Exhibits206: Samsung Electronics Co. Ltd. - Key news
- Exhibits207: Samsung Electronics Co. Ltd. - Key offerings
- Exhibits208: Samsung Electronics Co. Ltd. - Segment focus
- Exhibits209: SWOT
- Exhibits210: Shenzhen Mindray BioMedical Electronics Co. Ltd - Overview
- Exhibits211: Shenzhen Mindray BioMedical Electronics Co. Ltd - Product / Service
- Exhibits212: Shenzhen Mindray BioMedical Electronics Co. Ltd - Key news
- Exhibits213: Shenzhen Mindray BioMedical Electronics Co. Ltd - Key offerings
- Exhibits214: SWOT
- Exhibits215: Siemens Healthineers AG - Overview
- Exhibits216: Siemens Healthineers AG - Business segments
- Exhibits217: Siemens Healthineers AG - Key news
- Exhibits218: Siemens Healthineers AG - Key offerings
- Exhibits219: Siemens Healthineers AG - Segment focus
- Exhibits220: SWOT
- Exhibits221: Inclusions checklist
- Exhibits222: Exclusions checklist
- Exhibits223: Currency conversion rates for US$
- Exhibits224: Research methodology
- Exhibits225: Information sources
- Exhibits226: Data validation
- Exhibits227: Validation techniques employed for market sizing
- Exhibits228: Data synthesis
- Exhibits229: 360 degree market analysis
- Exhibits230: List of abbreviations
Ultrasound Equipment Market 2025-2029
The ultrasound equipment market is forecasted to grow by USD 3269.6 mn during 2024-2029, accelerating at a CAGR of 6.5% during the forecast period. The report on the ultrasound equipment market provides a holistic analysis, market size and forecast, trends, growth drivers, and challenges, as well as vendor analysis covering around 25 vendors.
The report offers an up-to-date analysis regarding the current market scenario, the latest trends and drivers, and the overall market environment. The market is driven by broader applications of ultrasound equipment, advancements in image quality, volumetric ultrasound, and new technologies, and focus on early diagnosis and preventive medicine.
| Market Scope | |
|---|---|
| Base Year | 2025 |
| End Year | 2029 |
| Series Year | 2025-2029 |
| Growth Momentum | Accelerate |
| YOY 2025 | 6% |
| CAGR | 6.5% |
| Incremental Value | $3269.6 mn |
Technavio's ultrasound equipment market is segmented as below:
By End-user
- Hospitals
- Imaging centers
- Research centers
- Others
By Product Type
- Stationary ultrasound equipment
- Portable ultrasound equipment
By Geographical Landscape
- North America
- Europe
- Asia
- Rest of World (ROW)
This study identifies the integration of artificial intelligence (AI) into ultrasound as one of the prime reasons driving the ultrasound equipment market growth during the next few years. Also, enhancement of wireless technologies and launch of new products will lead to sizable demand in the market.
The report on the ultrasound equipment market covers the following areas:
- Ultrasound Equipment Market sizing
- Ultrasound Equipment Market forecast
- Ultrasound Equipment Market industry analysis
The robust vendor analysis is designed to help clients improve their market position, and in line with this, this report provides a detailed analysis of several leading ultrasound equipment market vendors that include Boston Scientific Corp., Canon Inc., Carestream Health Inc., Chison Medical Technologies Co. Ltd., ContextVision AB, Esaote Spa, FUJIFILM Corp., GE Healthcare Technologies Inc., GlobalMedia Group LLC, Healcerion Co. Ltd., Hitachi Ltd., Hologic Inc., Iljin Co. Ltd., Konica Minolta Inc., Koninklijke Philips NV, Samsung Electronics Co. Ltd., Shenzhen Bestman Instrument Co. Ltd., Shenzhen Mindray BioMedical Electronics Co. Ltd, Siemens Healthineers AG, SonoScape Medical Corp., Sonostar, and Telemed Ultrasound. Also, the ultrasound equipment market analysis report includes information on upcoming trends and challenges that will influence market growth. This is to help companies strategize and leverage all forthcoming growth opportunities.
The study was conducted using an objective combination of primary and secondary information including inputs from key participants in the industry. The report contains a comprehensive market and vendor landscape in addition to an analysis of the key vendors.
The publisher presents a detailed picture of the market by the way of study, synthesis, and summation of data from multiple sources by an analysis of key parameters such as profit, pricing, competition, and promotions. It presents various market facets by identifying the key industry influencers. The data presented is comprehensive, reliable, and a result of extensive primary and secondary research. The market research reports provide a complete competitive landscape and an in-depth vendor selection methodology and analysis using qualitative and quantitative research to forecast accurate market growth.
Table of Contents
1 Executive Summary
- 1.1 Market overview
- Executive Summary - Chart on Market Overview
- Executive Summary - Data Table on Market Overview
- Executive Summary - Chart on Global Market Characteristics
- Executive Summary - Chart on Market By Geographical Landscape
- Executive Summary - Chart on Market Segmentation by End-user
- Executive Summary - Chart on Market Segmentation by Product Type
- Executive Summary - Chart on Incremental Growth
- Executive Summary - Data Table on Incremental Growth
- Executive Summary - Chart on Company Market Positioning
2 Technavio Analysis
- 2.1 Analysis of price sensitivity, lifecycle, customer purchase basket, adoption rates, and purchase criteria
- Analysis of price sensitivity, lifecycle, customer purchase basket, adoption rates, and purchase criteria
- 2.2 Criticality of inputs and Factors of differentiation
- Overview on criticality of inputs and factors of differentiation
- 2.3 Factors of disruption
- Overview on factors of disruption
- 2.4 Impact of drivers and challenges
- Impact of drivers and challenges in 2024 and 2029
3 Market Landscape
- 3.1 Market ecosystem
- Parent Market
- Data Table on - Parent Market
- 3.2 Market characteristics
- Market characteristics analysis
- 3.3 Value chain analysis
- Value chain analysis
4 Market Sizing
- 4.1 Market definition
- Offerings of companies included in the market definition
- 4.2 Market segment analysis
- Market segments
- 4.3 Market size 2024
- 4.4 Market outlook: Forecast for 2024-2029
- Chart on Global - Market size and forecast 2024-2029 ($ million)
- Data Table on Global - Market size and forecast 2024-2029 ($ million)
- Chart on Global Market: Year-over-year growth 2024-2029 (%)
- Data Table on Global Market: Year-over-year growth 2024-2029 (%)
5 Historic Market Size
- 5.1 Global Ultrasound Equipment Market 2019 - 2023
- Historic Market Size - Data Table on Global Ultrasound Equipment Market 2019 - 2023 ($ million)
- 5.2 End-user segment analysis 2019 - 2023
- Historic Market Size - End-user Segment 2019 - 2023 ($ million)
- 5.3 Product Type segment analysis 2019 - 2023
- Historic Market Size - Product Type Segment 2019 - 2023 ($ million)
- 5.4 Geography segment analysis 2019 - 2023
- Historic Market Size - Geography Segment 2019 - 2023 ($ million)
- 5.5 Country segment analysis 2019 - 2023
- Historic Market Size - Country Segment 2019 - 2023 ($ million)
6 Qualitative Analysis
- 6.1 Impact of AI on the global ultrasound equipment market
7 Five Forces Analysis
- 7.1 Five forces summary
- Five forces analysis - Comparison between 2024 and 2029
- 7.2 Bargaining power of buyers
- Bargaining power of buyers - Impact of key factors 2024 and 2029
- 7.3 Bargaining power of suppliers
- Bargaining power of suppliers - Impact of key factors in 2024 and 2029
- 7.4 Threat of new entrants
- Threat of new entrants - Impact of key factors in 2024 and 2029
- 7.5 Threat of substitutes
- Threat of substitutes - Impact of key factors in 2024 and 2029
- 7.6 Threat of rivalry
- Threat of rivalry - Impact of key factors in 2024 and 2029
- 7.7 Market condition
- Chart on Market condition - Five forces 2024 and 2029
8 Market Segmentation by End-user
- 8.1 Market segments
- Chart on End-user - Market share 2024-2029 (%)
- Data Table on End-user - Market share 2024-2029 (%)
- 8.2 Comparison by End-user
- Chart on Comparison by End-user
- Data Table on Comparison by End-user
- 8.3 Hospitals - Market size and forecast 2024-2029
- Chart on Hospitals - Market size and forecast 2024-2029 ($ million)
- Data Table on Hospitals - Market size and forecast 2024-2029 ($ million)
- Chart on Hospitals - Year-over-year growth 2024-2029 (%)
- Data Table on Hospitals - Year-over-year growth 2024-2029 (%)
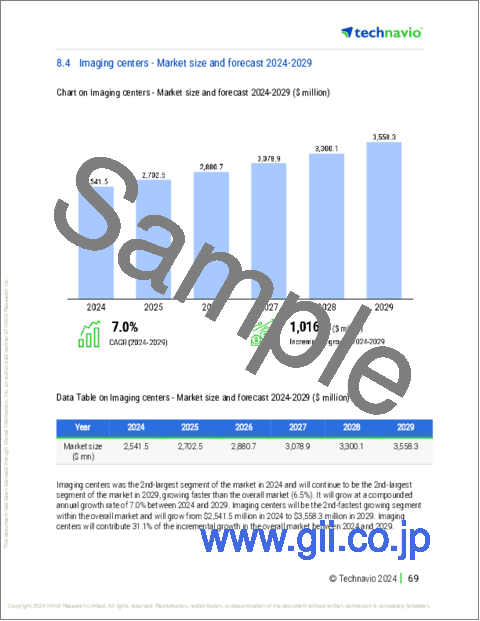
- 8.4 Imaging centers - Market size and forecast 2024-2029
- Chart on Imaging centers - Market size and forecast 2024-2029 ($ million)
- Data Table on Imaging centers - Market size and forecast 2024-2029 ($ million)
- Chart on Imaging centers - Year-over-year growth 2024-2029 (%)
- Data Table on Imaging centers - Year-over-year growth 2024-2029 (%)
- 8.5 Research centers - Market size and forecast 2024-2029
- Chart on Research centers - Market size and forecast 2024-2029 ($ million)
- Data Table on Research centers - Market size and forecast 2024-2029 ($ million)
- Chart on Research centers - Year-over-year growth 2024-2029 (%)
- Data Table on Research centers - Year-over-year growth 2024-2029 (%)
- 8.6 Others - Market size and forecast 2024-2029
- Chart on Others - Market size and forecast 2024-2029 ($ million)
- Data Table on Others - Market size and forecast 2024-2029 ($ million)
- Chart on Others - Year-over-year growth 2024-2029 (%)
- Data Table on Others - Year-over-year growth 2024-2029 (%)
- 8.7 Market opportunity by End-user
- Market opportunity by End-user ($ million)
- Data Table on Market opportunity by End-user ($ million)
9 Market Segmentation by Product Type
- 9.1 Market segments
- Chart on Product Type - Market share 2024-2029 (%)
- Data Table on Product Type - Market share 2024-2029 (%)
- 9.2 Comparison by Product Type
- Chart on Comparison by Product Type
- Data Table on Comparison by Product Type
- 9.3 Stationary ultrasound equipment - Market size and forecast 2024-2029
- Chart on Stationary ultrasound equipment - Market size and forecast 2024-2029 ($ million)
- Data Table on Stationary ultrasound equipment - Market size and forecast 2024-2029 ($ million)
- Chart on Stationary ultrasound equipment - Year-over-year growth 2024-2029 (%)
- Data Table on Stationary ultrasound equipment - Year-over-year growth 2024-2029 (%)
- 9.4 Portable ultrasound equipment - Market size and forecast 2024-2029
- Chart on Portable ultrasound equipment - Market size and forecast 2024-2029 ($ million)
- Data Table on Portable ultrasound equipment - Market size and forecast 2024-2029 ($ million)
- Chart on Portable ultrasound equipment - Year-over-year growth 2024-2029 (%)
- Data Table on Portable ultrasound equipment - Year-over-year growth 2024-2029 (%)
- 9.5 Market opportunity by Product Type
- Market opportunity by Product Type ($ million)
- Data Table on Market opportunity by Product Type ($ million)
10 Customer Landscape
- 10.1 Customer landscape overview
- Analysis of price sensitivity, lifecycle, customer purchase basket, adoption rates, and purchase criteria
11 Geographic Landscape
- 11.1 Geographic segmentation
- Chart on Market share By Geographical Landscape 2024-2029 (%)
- Data Table on Market share By Geographical Landscape 2024-2029 (%)
- 11.2 Geographic comparison
- Chart on Geographic comparison
- Data Table on Geographic comparison
- 11.3 North America - Market size and forecast 2024-2029
- Chart on North America - Market size and forecast 2024-2029 ($ million)
- Data Table on North America - Market size and forecast 2024-2029 ($ million)
- Chart on North America - Year-over-year growth 2024-2029 (%)
- Data Table on North America - Year-over-year growth 2024-2029 (%)
- 11.4 Europe - Market size and forecast 2024-2029
- Chart on Europe - Market size and forecast 2024-2029 ($ million)
- Data Table on Europe - Market size and forecast 2024-2029 ($ million)
- Chart on Europe - Year-over-year growth 2024-2029 (%)
- Data Table on Europe - Year-over-year growth 2024-2029 (%)
- 11.5 Asia - Market size and forecast 2024-2029
- Chart on Asia - Market size and forecast 2024-2029 ($ million)
- Data Table on Asia - Market size and forecast 2024-2029 ($ million)
- Chart on Asia - Year-over-year growth 2024-2029 (%)
- Data Table on Asia - Year-over-year growth 2024-2029 (%)
- 11.6 Rest of World (ROW) - Market size and forecast 2024-2029
- Chart on Rest of World (ROW) - Market size and forecast 2024-2029 ($ million)
- Data Table on Rest of World (ROW) - Market size and forecast 2024-2029 ($ million)
- Chart on Rest of World (ROW) - Year-over-year growth 2024-2029 (%)
- Data Table on Rest of World (ROW) - Year-over-year growth 2024-2029 (%)
- 11.7 US - Market size and forecast 2024-2029
- Chart on US - Market size and forecast 2024-2029 ($ million)
- Data Table on US - Market size and forecast 2024-2029 ($ million)
- Chart on US - Year-over-year growth 2024-2029 (%)
- Data Table on US - Year-over-year growth 2024-2029 (%)
- 11.8 Canada - Market size and forecast 2024-2029
- Chart on Canada - Market size and forecast 2024-2029 ($ million)
- Data Table on Canada - Market size and forecast 2024-2029 ($ million)
- Chart on Canada - Year-over-year growth 2024-2029 (%)
- Data Table on Canada - Year-over-year growth 2024-2029 (%)
- 11.9 Germany - Market size and forecast 2024-2029
- Chart on Germany - Market size and forecast 2024-2029 ($ million)
- Data Table on Germany - Market size and forecast 2024-2029 ($ million)
- Chart on Germany - Year-over-year growth 2024-2029 (%)
- Data Table on Germany - Year-over-year growth 2024-2029 (%)
- 11.10 China - Market size and forecast 2024-2029
- Chart on China - Market size and forecast 2024-2029 ($ million)
- Data Table on China - Market size and forecast 2024-2029 ($ million)
- Chart on China - Year-over-year growth 2024-2029 (%)
- Data Table on China - Year-over-year growth 2024-2029 (%)
- 11.11 UK - Market size and forecast 2024-2029
- Chart on UK - Market size and forecast 2024-2029 ($ million)
- Data Table on UK - Market size and forecast 2024-2029 ($ million)
- Chart on UK - Year-over-year growth 2024-2029 (%)
- Data Table on UK - Year-over-year growth 2024-2029 (%)
- 11.12 Japan - Market size and forecast 2024-2029
- Chart on Japan - Market size and forecast 2024-2029 ($ million)
- Data Table on Japan - Market size and forecast 2024-2029 ($ million)
- Chart on Japan - Year-over-year growth 2024-2029 (%)
- Data Table on Japan - Year-over-year growth 2024-2029 (%)
- 11.13 France - Market size and forecast 2024-2029
- Chart on France - Market size and forecast 2024-2029 ($ million)
- Data Table on France - Market size and forecast 2024-2029 ($ million)
- Chart on France - Year-over-year growth 2024-2029 (%)
- Data Table on France - Year-over-year growth 2024-2029 (%)
- 11.14 India - Market size and forecast 2024-2029
- Chart on India - Market size and forecast 2024-2029 ($ million)
- Data Table on India - Market size and forecast 2024-2029 ($ million)
- Chart on India - Year-over-year growth 2024-2029 (%)
- Data Table on India - Year-over-year growth 2024-2029 (%)
- 11.15 South Korea - Market size and forecast 2024-2029
- Chart on South Korea - Market size and forecast 2024-2029 ($ million)
- Data Table on South Korea - Market size and forecast 2024-2029 ($ million)
- Chart on South Korea - Year-over-year growth 2024-2029 (%)
- Data Table on South Korea - Year-over-year growth 2024-2029 (%)
- 11.16 Italy - Market size and forecast 2024-2029
- Chart on Italy - Market size and forecast 2024-2029 ($ million)
- Data Table on Italy - Market size and forecast 2024-2029 ($ million)
- Chart on Italy - Year-over-year growth 2024-2029 (%)
- Data Table on Italy - Year-over-year growth 2024-2029 (%)
- 11.17 Market opportunity By Geographical Landscape
- Market opportunity By Geographical Landscape ($ million)
- Data Tables on Market opportunity By Geographical Landscape ($ million)
12 Drivers, Challenges, and Opportunity/Restraints
- 12.1 Market drivers
- 12.2 Market challenges
- 12.3 Impact of drivers and challenges
- Impact of drivers and challenges in 2024 and 2029
- 12.4 Market opportunities/restraints
13 Competitive Landscape
- 13.1 Overview
- 13.2 Competitive Landscape
- Overview on criticality of inputs and factors of differentiation
- 13.3 Landscape disruption
- Overview on factors of disruption
- 13.4 Industry risks
- Impact of key risks on business
14 Competitive Analysis
- 14.1 Companies profiled
- Companies covered
- 14.2 Company ranking index
- Company ranking index
- 14.3 Market positioning of companies
- Matrix on companies position and classification
- 14.4 Boston Scientific Corp.
- Boston Scientific Corp. - Overview
- Boston Scientific Corp. - Business segments
- Boston Scientific Corp. - Key news
- Boston Scientific Corp. - Key offerings
- Boston Scientific Corp. - Segment focus
- SWOT
- 14.5 Canon Inc.
- Canon Inc. - Overview
- Canon Inc. - Business segments
- Canon Inc. - Key news
- Canon Inc. - Key offerings
- Canon Inc. - Segment focus
- SWOT
- 14.6 Carestream Health Inc.
- Carestream Health Inc. - Overview
- Carestream Health Inc. - Product / Service
- Carestream Health Inc. - Key offerings
- SWOT
- 14.7 Chison Medical Technologies Co. Ltd.
- Chison Medical Technologies Co. Ltd. - Overview
- Chison Medical Technologies Co. Ltd. - Product / Service
- Chison Medical Technologies Co. Ltd. - Key offerings
- SWOT
- 14.8 ContextVision AB
- ContextVision AB - Overview
- ContextVision AB - Product / Service
- ContextVision AB - Key offerings
- SWOT
- 14.9 Esaote Spa
- Esaote Spa - Overview
- Esaote Spa - Product / Service
- Esaote Spa - Key offerings
- SWOT
- 14.10 FUJIFILM Corp.
- FUJIFILM Corp. - Overview
- FUJIFILM Corp. - Business segments
- FUJIFILM Corp. - Key news
- FUJIFILM Corp. - Key offerings
- FUJIFILM Corp. - Segment focus
- SWOT
- 14.11 GE Healthcare Technologies Inc.
- GE Healthcare Technologies Inc. - Overview
- GE Healthcare Technologies Inc. - Business segments
- GE Healthcare Technologies Inc. - Key news
- GE Healthcare Technologies Inc. - Key offerings
- GE Healthcare Technologies Inc. - Segment focus
- SWOT
- 14.12 GlobalMedia Group LLC
- GlobalMedia Group LLC - Overview
- GlobalMedia Group LLC - Product / Service
- GlobalMedia Group LLC - Key offerings
- SWOT
- 14.13 Hologic Inc.
- Hologic Inc. - Overview
- Hologic Inc. - Business segments
- Hologic Inc. - Key news
- Hologic Inc. - Key offerings
- Hologic Inc. - Segment focus
- SWOT
- 14.14 Konica Minolta Inc.
- Konica Minolta Inc. - Overview
- Konica Minolta Inc. - Business segments
- Konica Minolta Inc. - Key news
- Konica Minolta Inc. - Key offerings
- Konica Minolta Inc. - Segment focus
- SWOT
- 14.15 Koninklijke Philips NV
- Koninklijke Philips NV - Overview
- Koninklijke Philips NV - Business segments
- Koninklijke Philips NV - Key news
- Koninklijke Philips NV - Key offerings
- Koninklijke Philips NV - Segment focus
- SWOT
- 14.16 Samsung Electronics Co. Ltd.
- Samsung Electronics Co. Ltd. - Overview
- Samsung Electronics Co. Ltd. - Business segments
- Samsung Electronics Co. Ltd. - Key news
- Samsung Electronics Co. Ltd. - Key offerings
- Samsung Electronics Co. Ltd. - Segment focus
- SWOT
- 14.17 Shenzhen Mindray BioMedical Electronics Co. Ltd
- Shenzhen Mindray BioMedical Electronics Co. Ltd - Overview
- Shenzhen Mindray BioMedical Electronics Co. Ltd - Product / Service
- Shenzhen Mindray BioMedical Electronics Co. Ltd - Key news
- Shenzhen Mindray BioMedical Electronics Co. Ltd - Key offerings
- SWOT
- 14.18 Siemens Healthineers AG
- Siemens Healthineers AG - Overview
- Siemens Healthineers AG - Business segments
- Siemens Healthineers AG - Key news
- Siemens Healthineers AG - Key offerings
- Siemens Healthineers AG - Segment focus
- SWOT
15 Appendix
- 15.1 Scope of the report
- 15.2 Inclusions and exclusions checklist
- Inclusions checklist
- Exclusions checklist
- 15.3 Currency conversion rates for US$
- Currency conversion rates for US$
- 15.4 Research methodology
- Research methodology
- 15.5 Data procurement
- Information sources
- 15.6 Data validation
- Data validation
- 15.7 Validation techniques employed for market sizing
- Validation techniques employed for market sizing
- 15.8 Data synthesis
- Data synthesis
- 15.9 360 degree market analysis
- 360 degree market analysis
- 15.10 List of abbreviations
- List of abbreviations

