|
|
市場調査レポート
商品コード
1634333
デジタルカメラの世界市場(2025年~2029年)Global Digital Camera Market 2025-2029 |
||||||

|
|||||||
カスタマイズ可能
|
|||||||


| デジタルカメラの世界市場(2025年~2029年) |
|
出版日: 2025年01月03日
発行: TechNavio
ページ情報: 英文 207 Pages
納期: 即納可能
|

全表示
- 概要
- 図表
- 目次
デジタルカメラ市場(2025年~2029年)
世界のデジタルカメラの市場規模は、2024年~2029年に17億3,950万米ドルに達し、予測期間中のCAGRは4.1%で成長すると予測されます。当レポートでは、デジタルカメラ市場の全体的な分析、市場規模・予測、動向、成長促進要因、課題、約25のベンダーを網羅したベンダー分析などを掲載しています。
本レポートは、現在の市場シナリオ、最新動向と促進要因、市場環境全体に関する最新分析を提供しています。市場は、デジタルカメラにおける様々な価格帯の入手可能性、高画質コンテンツの制作につながるソーシャルメディアの利用拡大、プロの写真家によるデジタルカメラの採用増加などが牽引しています。
| 市場範囲 | |
|---|---|
| 基準年 | 2025年 |
| 終了年 | 2029年 |
| 予測期間 | 2025年~2029年 |
| 成長モメンタム | 加速 |
| 前年比2025年 | 3.9% |
| CAGR | 4.1% |
| 増分額 | 17億3,950万米ドル |
本調査では、今後数年間のデジタルカメラ市場成長を牽引する主要因の1つとして、アクションカメラの使用増加を挙げています。また、デジタルカメラへの8K解像度の統合や360度デジタルカメラの導入は、市場の大きな需要につながります。
目次
第1章 エグゼクティブサマリー
- 市場概要
第2章 Technavioの分析
- 価格感度・ライフサイクル・顧客購入バスケット・採用率・購入基準の分析
- インプットの重要性と差別化の要因
- ディスラプションの要因
- 促進要因と課題の影響
第3章 市場情勢
- 市場エコシステム
- 市場の特徴
- バリューチェーン分析
第4章 市場規模
- 市場の定義
- 市場セグメント分析
- 市場規模(2024年)
- 市場の見通し(2024年~2029年)
第5章 市場規模実績
- デジタルカメラの世界市場(2019年~2023年)
- タイプセグメント分析(2019年~2023年)
- 流通チャネルセグメント分析(2019年~2023年)
- 地域セグメント分析(2019年~2023年)
- 国セグメント分析(2019年~2023年)
第6章 定性分析
- AIの影響:デジタルカメラの世界市場
第7章 ファイブフォース分析
- ファイブフォースの要約
- 買い手の交渉力
- 供給企業の交渉力
- 新規参入業者の脅威
- 代替品の脅威
- 競争の脅威
- 市況
第8章 市場セグメンテーション:タイプ別
- 市場セグメント
- 比較:タイプ別
- デジタル一眼レフカメラ:市場規模と予測(2024年~2029年)
- コンパクトデジタルカメラ:市場規模と予測(2024年~2029年)
- ミラーレス一眼カメラ:市場規模と予測(2024年~2029年)
- ブリッジコンパクトデジタルカメラ:市場規模と予測(2024年~2029年)
- 市場機会:タイプ別
第9章 市場セグメンテーション:流通チャネル別
- 市場セグメント
- 比較:流通チャネル別
- オフライン:市場規模と予測(2024年~2029年)
- オンライン:市場規模と予測(2024年~2029年)
- 市場機会:流通チャネル別
第10章 顧客情勢
- 顧客情勢の概要
第11章 地域別情勢
- 地域別セグメンテーション
- 地域別比較
- アジア太平洋:市場規模と予測(2024年~2029年)
- 北米:市場規模と予測(2024年~2029年)
- 欧州:市場規模と予測(2024年~2029年)
- 中東・アフリカ:市場規模と予測(2024年~2029年)
- 南米:市場規模と予測(2024年~2029年)
- 中国:市場規模と予測(2024年~2029年)
- 米国:市場規模と予測(2024年~2029年)
- 日本:市場規模と予測(2024年~2029年)
- ドイツ:市場規模と予測(2024年~2029年)
- カナダ:市場規模と予測(2024年~2029年)
- インド:市場規模と予測(2024年~2029年)
- 英国:市場規模と予測(2024年~2029年)
- フランス:市場規模と予測(2024年~2029年)
- ブラジル:市場規模と予測(2024年~2029年)
- 韓国:市場規模と予測(2024年~2029年)
- 市場機会:地域情勢別
第12章 促進要因・課題・機会・抑制要因
- 市場促進要因
- 市場の課題
- 促進要因と課題の影響
- 市場の機会・抑制要因
第13章 競合情勢
- 概要
- 競合情勢
- ディスラプションの状況
- 業界のリスク
第14章 競合分析
- 企業プロファイル
- 企業ランキング指数
- 企業の市場ポジショニング
- C and A Marketing Inc
- Canon Inc.
- Eastman Kodak Co.
- Elite Brands Inc.
- FUJIFILM Holdings Corp.
- GoPro Inc.
- HP Inc.
- Nikon Corp.
- OM Digital Solutions Corp.
- Panasonic Holdings Corp.
- Qisda Corp.
- Ricoh Co. Ltd.
- Samsung Electronics Co. Ltd.
- Sony Group Corp.
- Victor Hasselblad AB
第15章 付録
Exhibits:
- Exhibits1: Executive Summary - Chart on Market Overview
- Exhibits2: Executive Summary - Data Table on Market Overview
- Exhibits3: Executive Summary - Chart on Global Market Characteristics
- Exhibits4: Executive Summary - Chart on Market By Geographical Landscape
- Exhibits5: Executive Summary - Chart on Market Segmentation by Type
- Exhibits6: Executive Summary - Chart on Market Segmentation by Distribution Channel
- Exhibits7: Executive Summary - Chart on Incremental Growth
- Exhibits8: Executive Summary - Data Table on Incremental Growth
- Exhibits9: Executive Summary - Chart on Company Market Positioning
- Exhibits10: Analysis of price sensitivity, lifecycle, customer purchase basket, adoption rates, and purchase criteria
- Exhibits11: Overview on criticality of inputs and factors of differentiation
- Exhibits12: Overview on factors of disruption
- Exhibits13: Impact of drivers and challenges in 2024 and 2029
- Exhibits14: Parent Market
- Exhibits15: Data Table on - Parent Market
- Exhibits16: Market characteristics analysis
- Exhibits17: Value chain analysis
- Exhibits18: Offerings of companies included in the market definition
- Exhibits19: Market segments
- Exhibits20: Chart on Global - Market size and forecast 2024-2029 ($ million)
- Exhibits21: Data Table on Global - Market size and forecast 2024-2029 ($ million)
- Exhibits22: Chart on Global Market: Year-over-year growth 2024-2029 (%)
- Exhibits23: Data Table on Global Market: Year-over-year growth 2024-2029 (%)
- Exhibits24: Historic Market Size - Data Table on Global Digital Camera Market 2019 - 2023 ($ million)
- Exhibits25: Historic Market Size - Type Segment 2019 - 2023 ($ million)
- Exhibits26: Historic Market Size - Distribution Channel Segment 2019 - 2023 ($ million)
- Exhibits27: Historic Market Size - Geography Segment 2019 - 2023 ($ million)
- Exhibits28: Historic Market Size - Country Segment 2019 - 2023 ($ million)
- Exhibits29: Five forces analysis - Comparison between 2024 and 2029
- Exhibits30: Bargaining power of buyers - Impact of key factors 2024 and 2029
- Exhibits31: Bargaining power of suppliers - Impact of key factors in 2024 and 2029
- Exhibits32: Threat of new entrants - Impact of key factors in 2024 and 2029
- Exhibits33: Threat of substitutes - Impact of key factors in 2024 and 2029
- Exhibits34: Threat of rivalry - Impact of key factors in 2024 and 2029
- Exhibits35: Chart on Market condition - Five forces 2024 and 2029
- Exhibits36: Chart on Type - Market share 2024-2029 (%)
- Exhibits37: Data Table on Type - Market share 2024-2029 (%)
- Exhibits38: Chart on Comparison by Type
- Exhibits39: Data Table on Comparison by Type
- Exhibits40: Chart on Digital single-lens reflex (DSLR) cameras - Market size and forecast 2024-2029 ($ million)
- Exhibits41: Data Table on Digital single-lens reflex (DSLR) cameras - Market size and forecast 2024-2029 ($ million)
- Exhibits42: Chart on Digital single-lens reflex (DSLR) cameras - Year-over-year growth 2024-2029 (%)
- Exhibits43: Data Table on Digital single-lens reflex (DSLR) cameras - Year-over-year growth 2024-2029 (%)
- Exhibits44: Chart on Compact digital cameras - Market size and forecast 2024-2029 ($ million)
- Exhibits45: Data Table on Compact digital cameras - Market size and forecast 2024-2029 ($ million)
- Exhibits46: Chart on Compact digital cameras - Year-over-year growth 2024-2029 (%)
- Exhibits47: Data Table on Compact digital cameras - Year-over-year growth 2024-2029 (%)
- Exhibits48: Chart on Mirrorless interchangeable lens cameras - Market size and forecast 2024-2029 ($ million)
- Exhibits49: Data Table on Mirrorless interchangeable lens cameras - Market size and forecast 2024-2029 ($ million)
- Exhibits50: Chart on Mirrorless interchangeable lens cameras - Year-over-year growth 2024-2029 (%)
- Exhibits51: Data Table on Mirrorless interchangeable lens cameras - Year-over-year growth 2024-2029 (%)
- Exhibits52: Chart on Bridge compact digital cameras - Market size and forecast 2024-2029 ($ million)
- Exhibits53: Data Table on Bridge compact digital cameras - Market size and forecast 2024-2029 ($ million)
- Exhibits54: Chart on Bridge compact digital cameras - Year-over-year growth 2024-2029 (%)
- Exhibits55: Data Table on Bridge compact digital cameras - Year-over-year growth 2024-2029 (%)
- Exhibits56: Market opportunity by Type ($ million)
- Exhibits57: Data Table on Market opportunity by Type ($ million)
- Exhibits58: Chart on Distribution Channel - Market share 2024-2029 (%)
- Exhibits59: Data Table on Distribution Channel - Market share 2024-2029 (%)
- Exhibits60: Chart on Comparison by Distribution Channel
- Exhibits61: Data Table on Comparison by Distribution Channel
- Exhibits62: Chart on Offline - Market size and forecast 2024-2029 ($ million)
- Exhibits63: Data Table on Offline - Market size and forecast 2024-2029 ($ million)
- Exhibits64: Chart on Offline - Year-over-year growth 2024-2029 (%)
- Exhibits65: Data Table on Offline - Year-over-year growth 2024-2029 (%)
- Exhibits66: Chart on Online - Market size and forecast 2024-2029 ($ million)
- Exhibits67: Data Table on Online - Market size and forecast 2024-2029 ($ million)
- Exhibits68: Chart on Online - Year-over-year growth 2024-2029 (%)
- Exhibits69: Data Table on Online - Year-over-year growth 2024-2029 (%)
- Exhibits70: Market opportunity by Distribution Channel ($ million)
- Exhibits71: Data Table on Market opportunity by Distribution Channel ($ million)
- Exhibits72: Analysis of price sensitivity, lifecycle, customer purchase basket, adoption rates, and purchase criteria
- Exhibits73: Chart on Market share By Geographical Landscape 2024-2029 (%)
- Exhibits74: Data Table on Market share By Geographical Landscape 2024-2029 (%)
- Exhibits75: Chart on Geographic comparison
- Exhibits76: Data Table on Geographic comparison
- Exhibits77: Chart on APAC - Market size and forecast 2024-2029 ($ million)
- Exhibits78: Data Table on APAC - Market size and forecast 2024-2029 ($ million)
- Exhibits79: Chart on APAC - Year-over-year growth 2024-2029 (%)
- Exhibits80: Data Table on APAC - Year-over-year growth 2024-2029 (%)
- Exhibits81: Chart on North America - Market size and forecast 2024-2029 ($ million)
- Exhibits82: Data Table on North America - Market size and forecast 2024-2029 ($ million)
- Exhibits83: Chart on North America - Year-over-year growth 2024-2029 (%)
- Exhibits84: Data Table on North America - Year-over-year growth 2024-2029 (%)
- Exhibits85: Chart on Europe - Market size and forecast 2024-2029 ($ million)
- Exhibits86: Data Table on Europe - Market size and forecast 2024-2029 ($ million)
- Exhibits87: Chart on Europe - Year-over-year growth 2024-2029 (%)
- Exhibits88: Data Table on Europe - Year-over-year growth 2024-2029 (%)
- Exhibits89: Chart on Middle East and Africa - Market size and forecast 2024-2029 ($ million)
- Exhibits90: Data Table on Middle East and Africa - Market size and forecast 2024-2029 ($ million)
- Exhibits91: Chart on Middle East and Africa - Year-over-year growth 2024-2029 (%)
- Exhibits92: Data Table on Middle East and Africa - Year-over-year growth 2024-2029 (%)
- Exhibits93: Chart on South America - Market size and forecast 2024-2029 ($ million)
- Exhibits94: Data Table on South America - Market size and forecast 2024-2029 ($ million)
- Exhibits95: Chart on South America - Year-over-year growth 2024-2029 (%)
- Exhibits96: Data Table on South America - Year-over-year growth 2024-2029 (%)
- Exhibits97: Chart on China - Market size and forecast 2024-2029 ($ million)
- Exhibits98: Data Table on China - Market size and forecast 2024-2029 ($ million)
- Exhibits99: Chart on China - Year-over-year growth 2024-2029 (%)
- Exhibits100: Data Table on China - Year-over-year growth 2024-2029 (%)
- Exhibits101: Chart on US - Market size and forecast 2024-2029 ($ million)
- Exhibits102: Data Table on US - Market size and forecast 2024-2029 ($ million)
- Exhibits103: Chart on US - Year-over-year growth 2024-2029 (%)
- Exhibits104: Data Table on US - Year-over-year growth 2024-2029 (%)
- Exhibits105: Chart on Japan - Market size and forecast 2024-2029 ($ million)
- Exhibits106: Data Table on Japan - Market size and forecast 2024-2029 ($ million)
- Exhibits107: Chart on Japan - Year-over-year growth 2024-2029 (%)
- Exhibits108: Data Table on Japan - Year-over-year growth 2024-2029 (%)
- Exhibits109: Chart on Germany - Market size and forecast 2024-2029 ($ million)
- Exhibits110: Data Table on Germany - Market size and forecast 2024-2029 ($ million)
- Exhibits111: Chart on Germany - Year-over-year growth 2024-2029 (%)
- Exhibits112: Data Table on Germany - Year-over-year growth 2024-2029 (%)
- Exhibits113: Chart on Canada - Market size and forecast 2024-2029 ($ million)
- Exhibits114: Data Table on Canada - Market size and forecast 2024-2029 ($ million)
- Exhibits115: Chart on Canada - Year-over-year growth 2024-2029 (%)
- Exhibits116: Data Table on Canada - Year-over-year growth 2024-2029 (%)
- Exhibits117: Chart on India - Market size and forecast 2024-2029 ($ million)
- Exhibits118: Data Table on India - Market size and forecast 2024-2029 ($ million)
- Exhibits119: Chart on India - Year-over-year growth 2024-2029 (%)
- Exhibits120: Data Table on India - Year-over-year growth 2024-2029 (%)
- Exhibits121: Chart on UK - Market size and forecast 2024-2029 ($ million)
- Exhibits122: Data Table on UK - Market size and forecast 2024-2029 ($ million)
- Exhibits123: Chart on UK - Year-over-year growth 2024-2029 (%)
- Exhibits124: Data Table on UK - Year-over-year growth 2024-2029 (%)
- Exhibits125: Chart on France - Market size and forecast 2024-2029 ($ million)
- Exhibits126: Data Table on France - Market size and forecast 2024-2029 ($ million)
- Exhibits127: Chart on France - Year-over-year growth 2024-2029 (%)
- Exhibits128: Data Table on France - Year-over-year growth 2024-2029 (%)
- Exhibits129: Chart on Brazil - Market size and forecast 2024-2029 ($ million)
- Exhibits130: Data Table on Brazil - Market size and forecast 2024-2029 ($ million)
- Exhibits131: Chart on Brazil - Year-over-year growth 2024-2029 (%)
- Exhibits132: Data Table on Brazil - Year-over-year growth 2024-2029 (%)
- Exhibits133: Chart on South Korea - Market size and forecast 2024-2029 ($ million)
- Exhibits134: Data Table on South Korea - Market size and forecast 2024-2029 ($ million)
- Exhibits135: Chart on South Korea - Year-over-year growth 2024-2029 (%)
- Exhibits136: Data Table on South Korea - Year-over-year growth 2024-2029 (%)
- Exhibits137: Market opportunity By Geographical Landscape ($ million)
- Exhibits138: Data Tables on Market opportunity By Geographical Landscape ($ million)
- Exhibits139: Impact of drivers and challenges in 2024 and 2029
- Exhibits140: Overview on criticality of inputs and factors of differentiation
- Exhibits141: Overview on factors of disruption
- Exhibits142: Impact of key risks on business
- Exhibits143: Companies covered
- Exhibits144: Company ranking index
- Exhibits145: Matrix on companies position and classification
- Exhibits146: C and A Marketing Inc - Overview
- Exhibits147: C and A Marketing Inc - Product / Service
- Exhibits148: C and A Marketing Inc - Key offerings
- Exhibits149: SWOT
- Exhibits150: Canon Inc. - Overview
- Exhibits151: Canon Inc. - Business segments
- Exhibits152: Canon Inc. - Key news
- Exhibits153: Canon Inc. - Key offerings
- Exhibits154: Canon Inc. - Segment focus
- Exhibits155: SWOT
- Exhibits156: Eastman Kodak Co. - Overview
- Exhibits157: Eastman Kodak Co. - Business segments
- Exhibits158: Eastman Kodak Co. - Key news
- Exhibits159: Eastman Kodak Co. - Key offerings
- Exhibits160: Eastman Kodak Co. - Segment focus
- Exhibits161: SWOT
- Exhibits162: Elite Brands Inc. - Overview
- Exhibits163: Elite Brands Inc. - Product / Service
- Exhibits164: Elite Brands Inc. - Key offerings
- Exhibits165: SWOT
- Exhibits166: FUJIFILM Holdings Corp. - Overview
- Exhibits167: FUJIFILM Holdings Corp. - Business segments
- Exhibits168: FUJIFILM Holdings Corp. - Key news
- Exhibits169: FUJIFILM Holdings Corp. - Key offerings
- Exhibits170: FUJIFILM Holdings Corp. - Segment focus
- Exhibits171: SWOT
- Exhibits172: GoPro Inc. - Overview
- Exhibits173: GoPro Inc. - Product / Service
- Exhibits174: GoPro Inc. - Key news
- Exhibits175: GoPro Inc. - Key offerings
- Exhibits176: SWOT
- Exhibits177: HP Inc. - Overview
- Exhibits178: HP Inc. - Business segments
- Exhibits179: HP Inc. - Key news
- Exhibits180: HP Inc. - Key offerings
- Exhibits181: HP Inc. - Segment focus
- Exhibits182: SWOT
- Exhibits183: Nikon Corp. - Overview
- Exhibits184: Nikon Corp. - Business segments
- Exhibits185: Nikon Corp. - Key offerings
- Exhibits186: Nikon Corp. - Segment focus
- Exhibits187: SWOT
- Exhibits188: OM Digital Solutions Corp. - Overview
- Exhibits189: OM Digital Solutions Corp. - Product / Service
- Exhibits190: OM Digital Solutions Corp. - Key offerings
- Exhibits191: SWOT
- Exhibits192: Panasonic Holdings Corp. - Overview
- Exhibits193: Panasonic Holdings Corp. - Product / Service
- Exhibits194: Panasonic Holdings Corp. - Key news
- Exhibits195: Panasonic Holdings Corp. - Key offerings
- Exhibits196: SWOT
- Exhibits197: Qisda Corp. - Overview
- Exhibits198: Qisda Corp. - Product / Service
- Exhibits199: Qisda Corp. - Key offerings
- Exhibits200: SWOT
- Exhibits201: Ricoh Co. Ltd. - Overview
- Exhibits202: Ricoh Co. Ltd. - Business segments
- Exhibits203: Ricoh Co. Ltd. - Key news
- Exhibits204: Ricoh Co. Ltd. - Key offerings
- Exhibits205: Ricoh Co. Ltd. - Segment focus
- Exhibits206: SWOT
- Exhibits207: Samsung Electronics Co. Ltd. - Overview
- Exhibits208: Samsung Electronics Co. Ltd. - Business segments
- Exhibits209: Samsung Electronics Co. Ltd. - Key news
- Exhibits210: Samsung Electronics Co. Ltd. - Key offerings
- Exhibits211: Samsung Electronics Co. Ltd. - Segment focus
- Exhibits212: SWOT
- Exhibits213: Sony Group Corp. - Overview
- Exhibits214: Sony Group Corp. - Business segments
- Exhibits215: Sony Group Corp. - Key offerings
- Exhibits216: Sony Group Corp. - Segment focus
- Exhibits217: SWOT
- Exhibits218: Victor Hasselblad AB - Overview
- Exhibits219: Victor Hasselblad AB - Product / Service
- Exhibits220: Victor Hasselblad AB - Key offerings
- Exhibits221: SWOT
- Exhibits222: Inclusions checklist
- Exhibits223: Exclusions checklist
- Exhibits224: Currency conversion rates for US$
- Exhibits225: Research methodology
- Exhibits226: Information sources
- Exhibits227: Data validation
- Exhibits228: Validation techniques employed for market sizing
- Exhibits229: Data synthesis
- Exhibits230: 360 degree market analysis
- Exhibits231: List of abbreviations
Digital Camera Market 2025-2029
The digital camera market is forecasted to grow by USD 1739.5 mn during 2024-2029, accelerating at a CAGR of 4.1% during the forecast period. The report on the digital camera market provides a holistic analysis, market size and forecast, trends, growth drivers, and challenges, as well as vendor analysis covering around 25 vendors.
The report offers an up-to-date analysis regarding the current market scenario, the latest trends and drivers, and the overall market environment. The market is driven by availability of various price ranges in digital cameras, growing social media use leading to production of high-quality content, and rising adoption of digital cameras by professional photographers.
| Market Scope | |
|---|---|
| Base Year | 2025 |
| End Year | 2029 |
| Series Year | 2025-2029 |
| Growth Momentum | Accelerate |
| YOY 2025 | 3.9% |
| CAGR | 4.1% |
| Incremental Value | $1739.5 mn |
Technavio's digital camera market is segmented as below:
By Type
- Digital single-lens reflex (DSLR) cameras
- Compact digital cameras
- Mirrorless interchangeable lens cameras
- Bridge compact digital cameras
By Distribution Channel
- Offline
- Online
By Geographical Landscape
- APAC
- North America
- Europe
- Middle East and Africa
- South America
This study identifies the increase in use of action cameras as one of the prime reasons driving the digital camera market growth during the next few years. Also, integration of 8k resolution into digital cameras and introduction of 360-degree digital cameras will lead to sizable demand in the market.
The report on the digital camera market covers the following areas:
- Digital Camera Market sizing
- Digital Camera Market forecast
- Digital Camera Market industry analysis
The robust vendor analysis is designed to help clients improve their market position, and in line with this, this report provides a detailed analysis of several leading digital camera market vendors that include Blackmagic Design Pty. Ltd., C and A Marketing Inc, Canon Inc., Eastman Kodak Co., Elite Brands Inc., FUJIFILM Holdings Corp., GoPro Inc., HP Inc., JMM Lee Properties LLC, KYOCERA Corp., Leica Camera AG, Nikon Corp., OM Digital Solutions Corp., Panasonic Holdings Corp., Qisda Corp., RED Digital Cinema LLC, Ricoh Co. Ltd., Samsung Electronics Co. Ltd., Sharp Corp., SIGMA Corp., Sony Group Corp., and Victor Hasselblad AB. Also, the digital camera market analysis report includes information on upcoming trends and challenges that will influence market growth. This is to help companies strategize and leverage all forthcoming growth opportunities.
The study was conducted using an objective combination of primary and secondary information including inputs from key participants in the industry. The report contains a comprehensive market and vendor landscape in addition to an analysis of the key vendors.
The publisher presents a detailed picture of the market by the way of study, synthesis, and summation of data from multiple sources by an analysis of key parameters such as profit, pricing, competition, and promotions. It presents various market facets by identifying the key industry influencers. The data presented is comprehensive, reliable, and a result of extensive primary and secondary research. The market research reports provide a complete competitive landscape and an in-depth vendor selection methodology and analysis using qualitative and quantitative research to forecast accurate market growth.
Table of Contents
1 Executive Summary
- 1.1 Market overview
- Executive Summary - Chart on Market Overview
- Executive Summary - Data Table on Market Overview
- Executive Summary - Chart on Global Market Characteristics
- Executive Summary - Chart on Market By Geographical Landscape
- Executive Summary - Chart on Market Segmentation by Type
- Executive Summary - Chart on Market Segmentation by Distribution Channel
- Executive Summary - Chart on Incremental Growth
- Executive Summary - Data Table on Incremental Growth
- Executive Summary - Chart on Company Market Positioning
2 Technavio Analysis
- 2.1 Analysis of price sensitivity, lifecycle, customer purchase basket, adoption rates, and purchase criteria
- Analysis of price sensitivity, lifecycle, customer purchase basket, adoption rates, and purchase criteria
- 2.2 Criticality of inputs and Factors of differentiation
- Overview on criticality of inputs and factors of differentiation
- 2.3 Factors of disruption
- Overview on factors of disruption
- 2.4 Impact of drivers and challenges
- Impact of drivers and challenges in 2024 and 2029
3 Market Landscape
- 3.1 Market ecosystem
- Parent Market
- Data Table on - Parent Market
- 3.2 Market characteristics
- Market characteristics analysis
- 3.3 Value chain analysis
- Value chain analysis
4 Market Sizing
- 4.1 Market definition
- Offerings of companies included in the market definition
- 4.2 Market segment analysis
- Market segments
- 4.3 Market size 2024
- 4.4 Market outlook: Forecast for 2024-2029
- Chart on Global - Market size and forecast 2024-2029 ($ million)
- Data Table on Global - Market size and forecast 2024-2029 ($ million)
- Chart on Global Market: Year-over-year growth 2024-2029 (%)
- Data Table on Global Market: Year-over-year growth 2024-2029 (%)
5 Historic Market Size
- 5.1 Global Digital Camera Market 2019 - 2023
- Historic Market Size - Data Table on Global Digital Camera Market 2019 - 2023 ($ million)
- 5.2 Type segment analysis 2019 - 2023
- Historic Market Size - Type Segment 2019 - 2023 ($ million)
- 5.3 Distribution Channel segment analysis 2019 - 2023
- Historic Market Size - Distribution Channel Segment 2019 - 2023 ($ million)
- 5.4 Geography segment analysis 2019 - 2023
- Historic Market Size - Geography Segment 2019 - 2023 ($ million)
- 5.5 Country segment analysis 2019 - 2023
- Historic Market Size - Country Segment 2019 - 2023 ($ million)
6 Qualitative Analysis
- 6.1 Impact of AI on the Global Digital Camera Market
7 Five Forces Analysis
- 7.1 Five forces summary
- Five forces analysis - Comparison between 2024 and 2029
- 7.2 Bargaining power of buyers
- Bargaining power of buyers - Impact of key factors 2024 and 2029
- 7.3 Bargaining power of suppliers
- Bargaining power of suppliers - Impact of key factors in 2024 and 2029
- 7.4 Threat of new entrants
- Threat of new entrants - Impact of key factors in 2024 and 2029
- 7.5 Threat of substitutes
- Threat of substitutes - Impact of key factors in 2024 and 2029
- 7.6 Threat of rivalry
- Threat of rivalry - Impact of key factors in 2024 and 2029
- 7.7 Market condition
- Chart on Market condition - Five forces 2024 and 2029
8 Market Segmentation by Type
- 8.1 Market segments
- Chart on Type - Market share 2024-2029 (%)
- Data Table on Type - Market share 2024-2029 (%)
- 8.2 Comparison by Type
- Chart on Comparison by Type
- Data Table on Comparison by Type
- 8.3 Digital single-lens reflex (DSLR) cameras - Market size and forecast 2024-2029
- Chart on Digital single-lens reflex (DSLR) cameras - Market size and forecast 2024-2029 ($ million)
- Data Table on Digital single-lens reflex (DSLR) cameras - Market size and forecast 2024-2029 ($ million)
- Chart on Digital single-lens reflex (DSLR) cameras - Year-over-year growth 2024-2029 (%)
- Data Table on Digital single-lens reflex (DSLR) cameras - Year-over-year growth 2024-2029 (%)
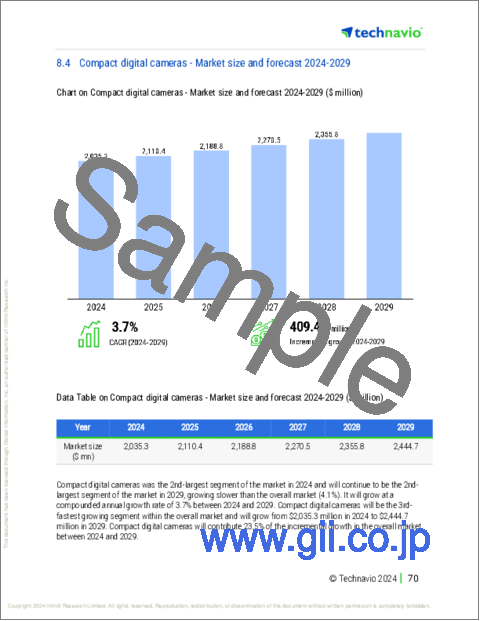
- 8.4 Compact digital cameras - Market size and forecast 2024-2029
- Chart on Compact digital cameras - Market size and forecast 2024-2029 ($ million)
- Data Table on Compact digital cameras - Market size and forecast 2024-2029 ($ million)
- Chart on Compact digital cameras - Year-over-year growth 2024-2029 (%)
- Data Table on Compact digital cameras - Year-over-year growth 2024-2029 (%)
- 8.5 Mirrorless interchangeable lens cameras - Market size and forecast 2024-2029
- Chart on Mirrorless interchangeable lens cameras - Market size and forecast 2024-2029 ($ million)
- Data Table on Mirrorless interchangeable lens cameras - Market size and forecast 2024-2029 ($ million)
- Chart on Mirrorless interchangeable lens cameras - Year-over-year growth 2024-2029 (%)
- Data Table on Mirrorless interchangeable lens cameras - Year-over-year growth 2024-2029 (%)
- 8.6 Bridge compact digital cameras - Market size and forecast 2024-2029
- Chart on Bridge compact digital cameras - Market size and forecast 2024-2029 ($ million)
- Data Table on Bridge compact digital cameras - Market size and forecast 2024-2029 ($ million)
- Chart on Bridge compact digital cameras - Year-over-year growth 2024-2029 (%)
- Data Table on Bridge compact digital cameras - Year-over-year growth 2024-2029 (%)
- 8.7 Market opportunity by Type
- Market opportunity by Type ($ million)
- Data Table on Market opportunity by Type ($ million)
9 Market Segmentation by Distribution Channel
- 9.1 Market segments
- Chart on Distribution Channel - Market share 2024-2029 (%)
- Data Table on Distribution Channel - Market share 2024-2029 (%)
- 9.2 Comparison by Distribution Channel
- Chart on Comparison by Distribution Channel
- Data Table on Comparison by Distribution Channel
- 9.3 Offline - Market size and forecast 2024-2029
- Chart on Offline - Market size and forecast 2024-2029 ($ million)
- Data Table on Offline - Market size and forecast 2024-2029 ($ million)
- Chart on Offline - Year-over-year growth 2024-2029 (%)
- Data Table on Offline - Year-over-year growth 2024-2029 (%)
- 9.4 Online - Market size and forecast 2024-2029
- Chart on Online - Market size and forecast 2024-2029 ($ million)
- Data Table on Online - Market size and forecast 2024-2029 ($ million)
- Chart on Online - Year-over-year growth 2024-2029 (%)
- Data Table on Online - Year-over-year growth 2024-2029 (%)
- 9.5 Market opportunity by Distribution Channel
- Market opportunity by Distribution Channel ($ million)
- Data Table on Market opportunity by Distribution Channel ($ million)
10 Customer Landscape
- 10.1 Customer landscape overview
- Analysis of price sensitivity, lifecycle, customer purchase basket, adoption rates, and purchase criteria
11 Geographic Landscape
- 11.1 Geographic segmentation
- Chart on Market share By Geographical Landscape 2024-2029 (%)
- Data Table on Market share By Geographical Landscape 2024-2029 (%)
- 11.2 Geographic comparison
- Chart on Geographic comparison
- Data Table on Geographic comparison
- 11.3 APAC - Market size and forecast 2024-2029
- Chart on APAC - Market size and forecast 2024-2029 ($ million)
- Data Table on APAC - Market size and forecast 2024-2029 ($ million)
- Chart on APAC - Year-over-year growth 2024-2029 (%)
- Data Table on APAC - Year-over-year growth 2024-2029 (%)
- 11.4 North America - Market size and forecast 2024-2029
- Chart on North America - Market size and forecast 2024-2029 ($ million)
- Data Table on North America - Market size and forecast 2024-2029 ($ million)
- Chart on North America - Year-over-year growth 2024-2029 (%)
- Data Table on North America - Year-over-year growth 2024-2029 (%)
- 11.5 Europe - Market size and forecast 2024-2029
- Chart on Europe - Market size and forecast 2024-2029 ($ million)
- Data Table on Europe - Market size and forecast 2024-2029 ($ million)
- Chart on Europe - Year-over-year growth 2024-2029 (%)
- Data Table on Europe - Year-over-year growth 2024-2029 (%)
- 11.6 Middle East and Africa - Market size and forecast 2024-2029
- Chart on Middle East and Africa - Market size and forecast 2024-2029 ($ million)
- Data Table on Middle East and Africa - Market size and forecast 2024-2029 ($ million)
- Chart on Middle East and Africa - Year-over-year growth 2024-2029 (%)
- Data Table on Middle East and Africa - Year-over-year growth 2024-2029 (%)
- 11.7 South America - Market size and forecast 2024-2029
- Chart on South America - Market size and forecast 2024-2029 ($ million)
- Data Table on South America - Market size and forecast 2024-2029 ($ million)
- Chart on South America - Year-over-year growth 2024-2029 (%)
- Data Table on South America - Year-over-year growth 2024-2029 (%)
- 11.8 China - Market size and forecast 2024-2029
- Chart on China - Market size and forecast 2024-2029 ($ million)
- Data Table on China - Market size and forecast 2024-2029 ($ million)
- Chart on China - Year-over-year growth 2024-2029 (%)
- Data Table on China - Year-over-year growth 2024-2029 (%)
- 11.9 US - Market size and forecast 2024-2029
- Chart on US - Market size and forecast 2024-2029 ($ million)
- Data Table on US - Market size and forecast 2024-2029 ($ million)
- Chart on US - Year-over-year growth 2024-2029 (%)
- Data Table on US - Year-over-year growth 2024-2029 (%)
- 11.10 Japan - Market size and forecast 2024-2029
- Chart on Japan - Market size and forecast 2024-2029 ($ million)
- Data Table on Japan - Market size and forecast 2024-2029 ($ million)
- Chart on Japan - Year-over-year growth 2024-2029 (%)
- Data Table on Japan - Year-over-year growth 2024-2029 (%)
- 11.11 Germany - Market size and forecast 2024-2029
- Chart on Germany - Market size and forecast 2024-2029 ($ million)
- Data Table on Germany - Market size and forecast 2024-2029 ($ million)
- Chart on Germany - Year-over-year growth 2024-2029 (%)
- Data Table on Germany - Year-over-year growth 2024-2029 (%)
- 11.12 Canada - Market size and forecast 2024-2029
- Chart on Canada - Market size and forecast 2024-2029 ($ million)
- Data Table on Canada - Market size and forecast 2024-2029 ($ million)
- Chart on Canada - Year-over-year growth 2024-2029 (%)
- Data Table on Canada - Year-over-year growth 2024-2029 (%)
- 11.13 India - Market size and forecast 2024-2029
- Chart on India - Market size and forecast 2024-2029 ($ million)
- Data Table on India - Market size and forecast 2024-2029 ($ million)
- Chart on India - Year-over-year growth 2024-2029 (%)
- Data Table on India - Year-over-year growth 2024-2029 (%)
- 11.14 UK - Market size and forecast 2024-2029
- Chart on UK - Market size and forecast 2024-2029 ($ million)
- Data Table on UK - Market size and forecast 2024-2029 ($ million)
- Chart on UK - Year-over-year growth 2024-2029 (%)
- Data Table on UK - Year-over-year growth 2024-2029 (%)
- 11.15 France - Market size and forecast 2024-2029
- Chart on France - Market size and forecast 2024-2029 ($ million)
- Data Table on France - Market size and forecast 2024-2029 ($ million)
- Chart on France - Year-over-year growth 2024-2029 (%)
- Data Table on France - Year-over-year growth 2024-2029 (%)
- 11.16 Brazil - Market size and forecast 2024-2029
- Chart on Brazil - Market size and forecast 2024-2029 ($ million)
- Data Table on Brazil - Market size and forecast 2024-2029 ($ million)
- Chart on Brazil - Year-over-year growth 2024-2029 (%)
- Data Table on Brazil - Year-over-year growth 2024-2029 (%)
- 11.17 South Korea - Market size and forecast 2024-2029
- Chart on South Korea - Market size and forecast 2024-2029 ($ million)
- Data Table on South Korea - Market size and forecast 2024-2029 ($ million)
- Chart on South Korea - Year-over-year growth 2024-2029 (%)
- Data Table on South Korea - Year-over-year growth 2024-2029 (%)
- 11.18 Market opportunity By Geographical Landscape
- Market opportunity By Geographical Landscape ($ million)
- Data Tables on Market opportunity By Geographical Landscape ($ million)
12 Drivers, Challenges, and Opportunity/Restraints
- 12.1 Market drivers
- 12.2 Market challenges
- 12.3 Impact of drivers and challenges
- Impact of drivers and challenges in 2024 and 2029
- 12.4 Market opportunities/restraints
13 Competitive Landscape
- 13.1 Overview
- 13.2 Competitive Landscape
- Overview on criticality of inputs and factors of differentiation
- 13.3 Landscape disruption
- Overview on factors of disruption
- 13.4 Industry risks
- Impact of key risks on business
14 Competitive Analysis
- 14.1 Companies profiled
- Companies covered
- 14.2 Company ranking index
- Company ranking index
- 14.3 Market positioning of companies
- Matrix on companies position and classification
- 14.4 C and A Marketing Inc
- C and A Marketing Inc - Overview
- C and A Marketing Inc - Product / Service
- C and A Marketing Inc - Key offerings
- SWOT
- 14.5 Canon Inc.
- Canon Inc. - Overview
- Canon Inc. - Business segments
- Canon Inc. - Key news
- Canon Inc. - Key offerings
- Canon Inc. - Segment focus
- SWOT
- 14.6 Eastman Kodak Co.
- Eastman Kodak Co. - Overview
- Eastman Kodak Co. - Business segments
- Eastman Kodak Co. - Key news
- Eastman Kodak Co. - Key offerings
- Eastman Kodak Co. - Segment focus
- SWOT
- 14.7 Elite Brands Inc.
- Elite Brands Inc. - Overview
- Elite Brands Inc. - Product / Service
- Elite Brands Inc. - Key offerings
- SWOT
- 14.8 FUJIFILM Holdings Corp.
- FUJIFILM Holdings Corp. - Overview
- FUJIFILM Holdings Corp. - Business segments
- FUJIFILM Holdings Corp. - Key news
- FUJIFILM Holdings Corp. - Key offerings
- FUJIFILM Holdings Corp. - Segment focus
- SWOT
- 14.9 GoPro Inc.
- GoPro Inc. - Overview
- GoPro Inc. - Product / Service
- GoPro Inc. - Key news
- GoPro Inc. - Key offerings
- SWOT
- 14.10 HP Inc.
- HP Inc. - Overview
- HP Inc. - Business segments
- HP Inc. - Key news
- HP Inc. - Key offerings
- HP Inc. - Segment focus
- SWOT
- 14.11 Nikon Corp.
- Nikon Corp. - Overview
- Nikon Corp. - Business segments
- Nikon Corp. - Key offerings
- Nikon Corp. - Segment focus
- SWOT
- 14.12 OM Digital Solutions Corp.
- OM Digital Solutions Corp. - Overview
- OM Digital Solutions Corp. - Product / Service
- OM Digital Solutions Corp. - Key offerings
- SWOT
- 14.13 Panasonic Holdings Corp.
- Panasonic Holdings Corp. - Overview
- Panasonic Holdings Corp. - Product / Service
- Panasonic Holdings Corp. - Key news
- Panasonic Holdings Corp. - Key offerings
- SWOT
- 14.14 Qisda Corp.
- Qisda Corp. - Overview
- Qisda Corp. - Product / Service
- Qisda Corp. - Key offerings
- SWOT
- 14.15 Ricoh Co. Ltd.
- Ricoh Co. Ltd. - Overview
- Ricoh Co. Ltd. - Business segments
- Ricoh Co. Ltd. - Key news
- Ricoh Co. Ltd. - Key offerings
- Ricoh Co. Ltd. - Segment focus
- SWOT
- 14.16 Samsung Electronics Co. Ltd.
- Samsung Electronics Co. Ltd. - Overview
- Samsung Electronics Co. Ltd. - Business segments
- Samsung Electronics Co. Ltd. - Key news
- Samsung Electronics Co. Ltd. - Key offerings
- Samsung Electronics Co. Ltd. - Segment focus
- SWOT
- 14.17 Sony Group Corp.
- Sony Group Corp. - Overview
- Sony Group Corp. - Business segments
- Sony Group Corp. - Key offerings
- Sony Group Corp. - Segment focus
- SWOT
- 14.18 Victor Hasselblad AB
- Victor Hasselblad AB - Overview
- Victor Hasselblad AB - Product / Service
- Victor Hasselblad AB - Key offerings
- SWOT
15 Appendix
- 15.1 Scope of the report
- 15.2 Inclusions and exclusions checklist
- Inclusions checklist
- Exclusions checklist
- 15.3 Currency conversion rates for US$
- Currency conversion rates for US$
- 15.4 Research methodology
- Research methodology
- 15.5 Data procurement
- Information sources
- 15.6 Data validation
- Data validation
- 15.7 Validation techniques employed for market sizing
- Validation techniques employed for market sizing
- 15.8 Data synthesis
- Data synthesis
- 15.9 360 degree market analysis
- 360 degree market analysis
- 15.10 List of abbreviations
- List of abbreviations

