|
|
市場調査レポート
商品コード
1626973
オリーブ葉エキスの世界市場 2024-2028年Global Olive Leaf Extract Market 2024-2028 |
||||||
|
|||||||
カスタマイズ可能
|
|||||||


| オリーブ葉エキスの世界市場 2024-2028年 |
|
出版日: 2024年07月31日
発行: TechNavio
ページ情報: 英文 161 Pages
納期: 即納可能
|

全表示
- 概要
- 図表
- 目次
オリーブ葉エキス市場 2024-2028年
オリーブ葉エキス市場は2023-2028年に4億9,690万米ドル、予測期間中のCAGRは4.36%で成長すると予測されます。当レポートでは、オリーブ葉エキス市場の全体的な分析、市場規模・予測、動向、成長促進要因、課題、約25のベンダーを網羅したベンダー分析などを掲載しています。
現在の市場シナリオ、最新動向と促進要因、市場環境全体に関する最新分析を提供しています。世界の地中海食への嗜好の高まり、オリーブ葉エキスの利点に対する意識の高まり、慢性疾患の罹患率の増加などが市場を牽引しています。
| 市場範囲 | |
|---|---|
| 基準年 | 2024 |
| 終了年 | 2028 |
| 予測期間 | 2024-2028 |
| 成長モメンタム | 加速 |
| 前年比2024年 | 4.11% |
| CAGR | 4.36% |
| 増分額 | 4億9,690万米ドル |
本調査では、今後数年間のオリーブ葉エキス市場成長を牽引する主な要因の1つとして、オーガニックオリーブ葉エキスに対する需要の高まりを挙げています。また、オンライン流通チャネルの台頭とエンドユーザー産業からの需要の高まりは、市場の大きな需要につながります。
目次
第1章 エグゼクティブサマリー
- 市場概要
第2章 市場情勢
- 市場エコシステム
- 市場の特徴
- バリューチェーン分析
第3章 市場規模
- 市場の定義
- 市場セグメント分析
- 市場規模 2023
- 市場の見通し 2023-2028
第4章 市場規模実績
- オリーブ葉エキスの世界市場 2018-2022
- 製品別セグメント分析 2018-2022
- タイプ別セグメント分析 2018-2022
- 地域別セグメント分析 2018-2022
- 国別セグメント分析 2018-2022
第5章 ファイブフォース分析
- ファイブフォースの要約
- 買い手の交渉力
- 供給企業の交渉力
- 新規参入業者の脅威
- 代替品の脅威
- 競争の脅威
- 市況
第6章 市場セグメンテーション:製品別
- 市場セグメント
- 比較:製品別
- 従来型:市場規模と予測 2023-2028
- オーガニック:市場規模と予測 2023-2028
- 市場機会:製品別
第7章 市場セグメンテーション:タイプ別
- 市場セグメント
- 比較:タイプ別
- 液体:市場規模と予測 2023-2028
- 固体:市場規模と予測 2023-2028
- 市場機会:タイプ別
第8章 顧客情勢
- 顧客情勢の概要
第9章 地域別情勢
- 地域別セグメンテーション
- 地域別比較
- 欧州:市場規模と予測 2023-2028
- 中東・アフリカ:市場規模と予測 2023-2028
- 北米:市場規模と予測 2023-2028
- アジア太平洋:市場規模と予測 2023-2028
- 南米:市場規模と予測 2023-2028
- スペイン:市場規模と予測 2023-2028
- イタリア:市場規模と予測 2023-2028
- 米国:市場規模と予測 2023-2028
- トルコ:市場規模と予測 2023-2028
- ポルトガル:市場規模と予測 2023-2028
- 市場機会:地域情勢別
第10章 促進要因・課題・機会・抑制要因
- 市場促進要因
- 市場の課題
- 促進要因と課題の影響
- 市場の機会・抑制要因
第11章 競合情勢
- 概要
- 競合情勢
- 混乱の状況
- 業界のリスク
第12章 競合分析
- 企業プロファイル
- 企業の市場ポジショニング
- Barleans Organic Oils LLC
- Comvita Ltd.
- Dohler GmbH
- Dr. Willmar Schwabe GmbH and Co. KG
- Evergreen Life Products Srl
- Gaia Herbs Inc.
- Grupo Natac S.L.U.
- International Flavors and Fragrances Inc.
- Medikonda Nutrients
- Nanjing NutriHerb BioTech Co. Ltd.
- NOW Health Group Inc.
- Olivus Inc.
- Select Botanical S.L.
- Simple Life Nutrition
- Starwest Botanicals.com Inc.
第13章 付録
Exhibits:
- Exhibits1: Executive Summary - Chart on Market Overview
- Exhibits2: Executive Summary - Data Table on Market Overview
- Exhibits3: Executive Summary - Chart on Global Market Characteristics
- Exhibits4: Executive Summary - Chart on Market By Geographical Landscape
- Exhibits5: Executive Summary - Chart on Market Segmentation by Product
- Exhibits6: Executive Summary - Chart on Market Segmentation by Type
- Exhibits7: Executive Summary - Chart on Incremental Growth
- Exhibits8: Executive Summary - Data Table on Incremental Growth
- Exhibits9: Executive Summary - Chart on Company Market Positioning
- Exhibits10: Parent Market
- Exhibits11: Data Table on - Parent Market
- Exhibits12: Market characteristics analysis
- Exhibits13: Value Chain Analysis
- Exhibits14: Offerings of companies included in the market definition
- Exhibits15: Market segments
- Exhibits16: Chart on Global - Market size and forecast 2023-2028 ($ million)
- Exhibits17: Data Table on Global - Market size and forecast 2023-2028 ($ million)
- Exhibits18: Chart on Global Market: Year-over-year growth 2023-2028 (%)
- Exhibits19: Data Table on Global Market: Year-over-year growth 2023-2028 (%)
- Exhibits20: Historic Market Size - Data Table on Global Olive Leaf Extract Market 2018 - 2022 ($ million)
- Exhibits21: Historic Market Size - Product Segment 2018 - 2022 ($ million)
- Exhibits22: Historic Market Size - Type Segment 2018 - 2022 ($ million)
- Exhibits23: Historic Market Size - Geography Segment 2018 - 2022 ($ million)
- Exhibits24: Historic Market Size - Country Segment 2018 - 2022 ($ million)
- Exhibits25: Five forces analysis - Comparison between 2023 and 2028
- Exhibits26: Bargaining power of buyers - Impact of key factors 2023 and 2028
- Exhibits27: Bargaining power of suppliers - Impact of key factors in 2023 and 2028
- Exhibits28: Threat of new entrants - Impact of key factors in 2023 and 2028
- Exhibits29: Threat of substitutes - Impact of key factors in 2023 and 2028
- Exhibits30: Threat of rivalry - Impact of key factors in 2023 and 2028
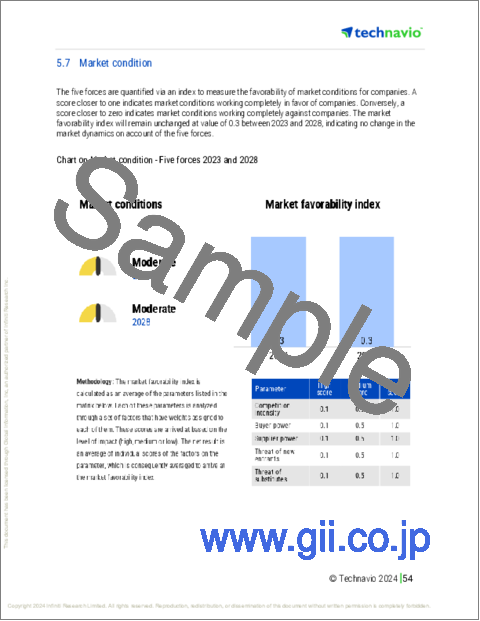
- Exhibits31: Chart on Market condition - Five forces 2023 and 2028
- Exhibits32: Chart on Product - Market share 2023-2028 (%)
- Exhibits33: Data Table on Product - Market share 2023-2028 (%)
- Exhibits34: Chart on Comparison by Product
- Exhibits35: Data Table on Comparison by Product
- Exhibits36: Chart on Conventional - Market size and forecast 2023-2028 ($ million)
- Exhibits37: Data Table on Conventional - Market size and forecast 2023-2028 ($ million)
- Exhibits38: Chart on Conventional - Year-over-year growth 2023-2028 (%)
- Exhibits39: Data Table on Conventional - Year-over-year growth 2023-2028 (%)
- Exhibits40: Chart on Organic - Market size and forecast 2023-2028 ($ million)
- Exhibits41: Data Table on Organic - Market size and forecast 2023-2028 ($ million)
- Exhibits42: Chart on Organic - Year-over-year growth 2023-2028 (%)
- Exhibits43: Data Table on Organic - Year-over-year growth 2023-2028 (%)
- Exhibits44: Market opportunity by Product ($ million)
- Exhibits45: Data Table on Market opportunity by Product ($ million)
- Exhibits46: Chart on Type - Market share 2023-2028 (%)
- Exhibits47: Data Table on Type - Market share 2023-2028 (%)
- Exhibits48: Chart on Comparison by Type
- Exhibits49: Data Table on Comparison by Type
- Exhibits50: Chart on Liquid - Market size and forecast 2023-2028 ($ million)
- Exhibits51: Data Table on Liquid - Market size and forecast 2023-2028 ($ million)
- Exhibits52: Chart on Liquid - Year-over-year growth 2023-2028 (%)
- Exhibits53: Data Table on Liquid - Year-over-year growth 2023-2028 (%)
- Exhibits54: Chart on Solid - Market size and forecast 2023-2028 ($ million)
- Exhibits55: Data Table on Solid - Market size and forecast 2023-2028 ($ million)
- Exhibits56: Chart on Solid - Year-over-year growth 2023-2028 (%)
- Exhibits57: Data Table on Solid - Year-over-year growth 2023-2028 (%)
- Exhibits58: Market opportunity by Type ($ million)
- Exhibits59: Data Table on Market opportunity by Type ($ million)
- Exhibits60: Analysis of price sensitivity, lifecycle, customer purchase basket, adoption rates, and purchase criteria
- Exhibits61: Chart on Market share By Geographical Landscape 2023-2028 (%)
- Exhibits62: Data Table on Market share By Geographical Landscape 2023-2028 (%)
- Exhibits63: Chart on Geographic comparison
- Exhibits64: Data Table on Geographic comparison
- Exhibits65: Chart on Europe - Market size and forecast 2023-2028 ($ million)
- Exhibits66: Data Table on Europe - Market size and forecast 2023-2028 ($ million)
- Exhibits67: Chart on Europe - Year-over-year growth 2023-2028 (%)
- Exhibits68: Data Table on Europe - Year-over-year growth 2023-2028 (%)
- Exhibits69: Chart on Middle East and Africa - Market size and forecast 2023-2028 ($ million)
- Exhibits70: Data Table on Middle East and Africa - Market size and forecast 2023-2028 ($ million)
- Exhibits71: Chart on Middle East and Africa - Year-over-year growth 2023-2028 (%)
- Exhibits72: Data Table on Middle East and Africa - Year-over-year growth 2023-2028 (%)
- Exhibits73: Chart on North America - Market size and forecast 2023-2028 ($ million)
- Exhibits74: Data Table on North America - Market size and forecast 2023-2028 ($ million)
- Exhibits75: Chart on North America - Year-over-year growth 2023-2028 (%)
- Exhibits76: Data Table on North America - Year-over-year growth 2023-2028 (%)
- Exhibits77: Chart on APAC - Market size and forecast 2023-2028 ($ million)
- Exhibits78: Data Table on APAC - Market size and forecast 2023-2028 ($ million)
- Exhibits79: Chart on APAC - Year-over-year growth 2023-2028 (%)
- Exhibits80: Data Table on APAC - Year-over-year growth 2023-2028 (%)
- Exhibits81: Chart on South America - Market size and forecast 2023-2028 ($ million)
- Exhibits82: Data Table on South America - Market size and forecast 2023-2028 ($ million)
- Exhibits83: Chart on South America - Year-over-year growth 2023-2028 (%)
- Exhibits84: Data Table on South America - Year-over-year growth 2023-2028 (%)
- Exhibits85: Chart on Spain - Market size and forecast 2023-2028 ($ million)
- Exhibits86: Data Table on Spain - Market size and forecast 2023-2028 ($ million)
- Exhibits87: Chart on Spain - Year-over-year growth 2023-2028 (%)
- Exhibits88: Data Table on Spain - Year-over-year growth 2023-2028 (%)
- Exhibits89: Chart on Italy - Market size and forecast 2023-2028 ($ million)
- Exhibits90: Data Table on Italy - Market size and forecast 2023-2028 ($ million)
- Exhibits91: Chart on Italy - Year-over-year growth 2023-2028 (%)
- Exhibits92: Data Table on Italy - Year-over-year growth 2023-2028 (%)
- Exhibits93: Chart on US - Market size and forecast 2023-2028 ($ million)
- Exhibits94: Data Table on US - Market size and forecast 2023-2028 ($ million)
- Exhibits95: Chart on US - Year-over-year growth 2023-2028 (%)
- Exhibits96: Data Table on US - Year-over-year growth 2023-2028 (%)
- Exhibits97: Chart on Turkey - Market size and forecast 2023-2028 ($ million)
- Exhibits98: Data Table on Turkey - Market size and forecast 2023-2028 ($ million)
- Exhibits99: Chart on Turkey - Year-over-year growth 2023-2028 (%)
- Exhibits100: Data Table on Turkey - Year-over-year growth 2023-2028 (%)
- Exhibits101: Chart on Portugal - Market size and forecast 2023-2028 ($ million)
- Exhibits102: Data Table on Portugal - Market size and forecast 2023-2028 ($ million)
- Exhibits103: Chart on Portugal - Year-over-year growth 2023-2028 (%)
- Exhibits104: Data Table on Portugal - Year-over-year growth 2023-2028 (%)
- Exhibits105: Market opportunity By Geographical Landscape ($ million)
- Exhibits106: Data Tables on Market opportunity By Geographical Landscape ($ million)
- Exhibits107: Impact of drivers and challenges in 2023 and 2028
- Exhibits108: Overview on criticality of inputs and factors of differentiation
- Exhibits109: Overview on factors of disruption
- Exhibits110: Impact of key risks on business
- Exhibits111: Companies covered
- Exhibits112: Matrix on companies position and classification
- Exhibits113: Barleans Organic Oils LLC - Overview
- Exhibits114: Barleans Organic Oils LLC - Product / Service
- Exhibits115: Barleans Organic Oils LLC - Key offerings
- Exhibits116: Comvita Ltd. - Overview
- Exhibits117: Comvita Ltd. - Business segments
- Exhibits118: Comvita Ltd. - Key offerings
- Exhibits119: Comvita Ltd. - Segment focus
- Exhibits120: Dohler GmbH - Overview
- Exhibits121: Dohler GmbH - Product / Service
- Exhibits122: Dohler GmbH - Key offerings
- Exhibits123: Dr. Willmar Schwabe GmbH and Co. KG - Overview
- Exhibits124: Dr. Willmar Schwabe GmbH and Co. KG - Product / Service
- Exhibits125: Dr. Willmar Schwabe GmbH and Co. KG - Key offerings
- Exhibits126: Evergreen Life Products Srl - Overview
- Exhibits127: Evergreen Life Products Srl - Product / Service
- Exhibits128: Evergreen Life Products Srl - Key offerings
- Exhibits129: Gaia Herbs Inc. - Overview
- Exhibits130: Gaia Herbs Inc. - Product / Service
- Exhibits131: Gaia Herbs Inc. - Key offerings
- Exhibits132: Grupo Natac S.L.U. - Overview
- Exhibits133: Grupo Natac S.L.U. - Product / Service
- Exhibits134: Grupo Natac S.L.U. - Key offerings
- Exhibits135: International Flavors and Fragrances Inc. - Overview
- Exhibits136: International Flavors and Fragrances Inc. - Business segments
- Exhibits137: International Flavors and Fragrances Inc. - Key news
- Exhibits138: International Flavors and Fragrances Inc. - Key offerings
- Exhibits139: International Flavors and Fragrances Inc. - Segment focus
- Exhibits140: Medikonda Nutrients - Overview
- Exhibits141: Medikonda Nutrients - Product / Service
- Exhibits142: Medikonda Nutrients - Key offerings
- Exhibits143: Nanjing NutriHerb BioTech Co. Ltd. - Overview
- Exhibits144: Nanjing NutriHerb BioTech Co. Ltd. - Product / Service
- Exhibits145: Nanjing NutriHerb BioTech Co. Ltd. - Key offerings
- Exhibits146: NOW Health Group Inc. - Overview
- Exhibits147: NOW Health Group Inc. - Product / Service
- Exhibits148: NOW Health Group Inc. - Key offerings
- Exhibits149: Olivus Inc. - Overview
- Exhibits150: Olivus Inc. - Product / Service
- Exhibits151: Olivus Inc. - Key offerings
- Exhibits152: Select Botanical S.L. - Overview
- Exhibits153: Select Botanical S.L. - Product / Service
- Exhibits154: Select Botanical S.L. - Key offerings
- Exhibits155: Simple Life Nutrition - Overview
- Exhibits156: Simple Life Nutrition - Product / Service
- Exhibits157: Simple Life Nutrition - Key offerings
- Exhibits158: Starwest Botanicals.com Inc. - Overview
- Exhibits159: Starwest Botanicals.com Inc. - Product / Service
- Exhibits160: Starwest Botanicals.com Inc. - Key offerings
- Exhibits161: Inclusions checklist
- Exhibits162: Exclusions checklist
- Exhibits163: Currency conversion rates for US$
- Exhibits164: Research methodology
- Exhibits165: Information sources
- Exhibits166: Data validation
- Exhibits167: Validation techniques employed for market sizing
- Exhibits168: Data synthesis
- Exhibits169: 360 degree market analysis
- Exhibits170: List of abbreviations
Olive Leaf Extract Market 2024-2028
The olive leaf extract market is forecasted to grow by USD 496.9 mn during 2023-2028, accelerating at a CAGR of 4.36% during the forecast period. The report on the olive leaf extract market provides a holistic analysis, market size and forecast, trends, growth drivers, and challenges, as well as vendor analysis covering around 25 vendors.
The report offers an up-to-date analysis regarding the current market scenario, the latest trends and drivers, and the overall market environment. The market is driven by increasing preference for mediterranean diet globally, rising awareness of benefits of olive leaf extract, and increasing incidence of chronic diseases.
| Market Scope | |
|---|---|
| Base Year | 2024 |
| End Year | 2028 |
| Series Year | 2024-2028 |
| Growth Momentum | Accelerate |
| YOY 2024 | 4.11% |
| CAGR | 4.36% |
| Incremental Value | $496.9 mn |
Technavio's olive leaf extract market is segmented as below:
By Product
- Conventional
- Organic
By Type
- Liquid
- Solid
By Geographical Landscape
- Europe
- Middle East and Africa
- North America
- APAC
- South America
This study identifies the growing demand for organic olive leaf extract as one of the prime reasons driving the olive leaf extract market growth during the next few years. Also, rising prominence of online distribution channel and growing demand from end-user industries will lead to sizable demand in the market.
The report on the olive leaf extract market covers the following areas:
- Olive Leaf Extract Market sizing
- Olive Leaf Extract Market forecast
- Olive Leaf Extract Market industry analysis
The robust vendor analysis is designed to help clients improve their market position, and in line with this, this report provides a detailed analysis of several leading olive leaf extract market vendors that include Barleans Organic Oils LLC, Comvita Ltd., Creative Enzymes, Dohler GmbH, Dr. Willmar Schwabe GmbH and Co. KG, Evergreen Life Products Srl, Gaia Herbs Inc., Grupo Natac S.L.U., Healthy Hey LLP Research, International Flavors and Fragrances Inc., Medikonda Nutrients, Nanjing NutriHerb BioTech Co. Ltd., NOW Health Group Inc., Olivus Inc., Select Botanical S.L., Simple Life Nutrition, Stakich Inc., Starwest Botanicals.com Inc., The Naked Pharmacy Ltd., and Vabori. Also, the olive leaf extract market analysis report includes information on upcoming trends and challenges that will influence market growth. This is to help companies strategize and leverage all forthcoming growth opportunities.
The study was conducted using an objective combination of primary and secondary information including inputs from key participants in the industry. The report contains a comprehensive market and vendor landscape in addition to an analysis of the key vendors.
The publisher presents a detailed picture of the market by the way of study, synthesis, and summation of data from multiple sources by an analysis of key parameters such as profit, pricing, competition, and promotions. It presents various market facets by identifying the key industry influencers. The data presented is comprehensive, reliable, and a result of extensive primary and secondary research. The market research reports provide a complete competitive landscape and an in-depth vendor selection methodology and analysis using qualitative and quantitative research to forecast accurate market growth.
Table of Contents
1 Executive Summary
- 1.1 Market overview
- Executive Summary - Chart on Market Overview
- Executive Summary - Data Table on Market Overview
- Executive Summary - Chart on Global Market Characteristics
- Executive Summary - Chart on Market By Geographical Landscape
- Executive Summary - Chart on Market Segmentation by Product
- Executive Summary - Chart on Market Segmentation by Type
- Executive Summary - Chart on Incremental Growth
- Executive Summary - Data Table on Incremental Growth
- Executive Summary - Chart on Company Market Positioning
2 Market Landscape
- 2.1 Market ecosystem
- Parent Market
- Data Table on - Parent Market
- 2.2 Market characteristics
- Market characteristics analysis
- 2.3 Value chain analysis
- Value Chain Analysis
3 Market Sizing
- 3.1 Market definition
- Offerings of companies included in the market definition
- 3.2 Market segment analysis
- Market segments
- 3.3 Market size 2023
- 3.4 Market outlook: Forecast for 2023-2028
- Chart on Global - Market size and forecast 2023-2028 ($ million)
- Data Table on Global - Market size and forecast 2023-2028 ($ million)
- Chart on Global Market: Year-over-year growth 2023-2028 (%)
- Data Table on Global Market: Year-over-year growth 2023-2028 (%)
4 Historic Market Size
- 4.1 Global Olive Leaf Extract Market 2018 - 2022
- Historic Market Size - Data Table on Global Olive Leaf Extract Market 2018 - 2022 ($ million)
- 4.2 Product segment analysis 2018 - 2022
- Historic Market Size - Product Segment 2018 - 2022 ($ million)
- 4.3 Type segment analysis 2018 - 2022
- Historic Market Size - Type Segment 2018 - 2022 ($ million)
- 4.4 Geography segment analysis 2018 - 2022
- Historic Market Size - Geography Segment 2018 - 2022 ($ million)
- 4.5 Country segment analysis 2018 - 2022
- Historic Market Size - Country Segment 2018 - 2022 ($ million)
5 Five Forces Analysis
- 5.1 Five forces summary
- Five forces analysis - Comparison between 2023 and 2028
- 5.2 Bargaining power of buyers
- Bargaining power of buyers - Impact of key factors 2023 and 2028
- 5.3 Bargaining power of suppliers
- Bargaining power of suppliers - Impact of key factors in 2023 and 2028
- 5.4 Threat of new entrants
- Threat of new entrants - Impact of key factors in 2023 and 2028
- 5.5 Threat of substitutes
- Threat of substitutes - Impact of key factors in 2023 and 2028
- 5.6 Threat of rivalry
- Threat of rivalry - Impact of key factors in 2023 and 2028
- 5.7 Market condition
- Chart on Market condition - Five forces 2023 and 2028
6 Market Segmentation by Product
- 6.1 Market segments
- Chart on Product - Market share 2023-2028 (%)
- Data Table on Product - Market share 2023-2028 (%)
- 6.2 Comparison by Product
- Chart on Comparison by Product
- Data Table on Comparison by Product
- 6.3 Conventional - Market size and forecast 2023-2028
- Chart on Conventional - Market size and forecast 2023-2028 ($ million)
- Data Table on Conventional - Market size and forecast 2023-2028 ($ million)
- Chart on Conventional - Year-over-year growth 2023-2028 (%)
- Data Table on Conventional - Year-over-year growth 2023-2028 (%)
- 6.4 Organic - Market size and forecast 2023-2028
- Chart on Organic - Market size and forecast 2023-2028 ($ million)
- Data Table on Organic - Market size and forecast 2023-2028 ($ million)
- Chart on Organic - Year-over-year growth 2023-2028 (%)
- Data Table on Organic - Year-over-year growth 2023-2028 (%)
- 6.5 Market opportunity by Product
- Market opportunity by Product ($ million)
- Data Table on Market opportunity by Product ($ million)
7 Market Segmentation by Type
- 7.1 Market segments
- Chart on Type - Market share 2023-2028 (%)
- Data Table on Type - Market share 2023-2028 (%)
- 7.2 Comparison by Type
- Chart on Comparison by Type
- Data Table on Comparison by Type
- 7.3 Liquid - Market size and forecast 2023-2028
- Chart on Liquid - Market size and forecast 2023-2028 ($ million)
- Data Table on Liquid - Market size and forecast 2023-2028 ($ million)
- Chart on Liquid - Year-over-year growth 2023-2028 (%)
- Data Table on Liquid - Year-over-year growth 2023-2028 (%)
- 7.4 Solid - Market size and forecast 2023-2028
- Chart on Solid - Market size and forecast 2023-2028 ($ million)
- Data Table on Solid - Market size and forecast 2023-2028 ($ million)
- Chart on Solid - Year-over-year growth 2023-2028 (%)
- Data Table on Solid - Year-over-year growth 2023-2028 (%)
- 7.5 Market opportunity by Type
- Market opportunity by Type ($ million)
- Data Table on Market opportunity by Type ($ million)
8 Customer Landscape
- 8.1 Customer landscape overview
- Analysis of price sensitivity, lifecycle, customer purchase basket, adoption rates, and purchase criteria
9 Geographic Landscape
- 9.1 Geographic segmentation
- Chart on Market share By Geographical Landscape 2023-2028 (%)
- Data Table on Market share By Geographical Landscape 2023-2028 (%)
- 9.2 Geographic comparison
- Chart on Geographic comparison
- Data Table on Geographic comparison
- 9.3 Europe - Market size and forecast 2023-2028
- Chart on Europe - Market size and forecast 2023-2028 ($ million)
- Data Table on Europe - Market size and forecast 2023-2028 ($ million)
- Chart on Europe - Year-over-year growth 2023-2028 (%)
- Data Table on Europe - Year-over-year growth 2023-2028 (%)
- 9.4 Middle East and Africa - Market size and forecast 2023-2028
- Chart on Middle East and Africa - Market size and forecast 2023-2028 ($ million)
- Data Table on Middle East and Africa - Market size and forecast 2023-2028 ($ million)
- Chart on Middle East and Africa - Year-over-year growth 2023-2028 (%)
- Data Table on Middle East and Africa - Year-over-year growth 2023-2028 (%)
- 9.5 North America - Market size and forecast 2023-2028
- Chart on North America - Market size and forecast 2023-2028 ($ million)
- Data Table on North America - Market size and forecast 2023-2028 ($ million)
- Chart on North America - Year-over-year growth 2023-2028 (%)
- Data Table on North America - Year-over-year growth 2023-2028 (%)
- 9.6 APAC - Market size and forecast 2023-2028
- Chart on APAC - Market size and forecast 2023-2028 ($ million)
- Data Table on APAC - Market size and forecast 2023-2028 ($ million)
- Chart on APAC - Year-over-year growth 2023-2028 (%)
- Data Table on APAC - Year-over-year growth 2023-2028 (%)
- 9.7 South America - Market size and forecast 2023-2028
- Chart on South America - Market size and forecast 2023-2028 ($ million)
- Data Table on South America - Market size and forecast 2023-2028 ($ million)
- Chart on South America - Year-over-year growth 2023-2028 (%)
- Data Table on South America - Year-over-year growth 2023-2028 (%)
- 9.8 Spain - Market size and forecast 2023-2028
- Chart on Spain - Market size and forecast 2023-2028 ($ million)
- Data Table on Spain - Market size and forecast 2023-2028 ($ million)
- Chart on Spain - Year-over-year growth 2023-2028 (%)
- Data Table on Spain - Year-over-year growth 2023-2028 (%)
- 9.9 Italy - Market size and forecast 2023-2028
- Chart on Italy - Market size and forecast 2023-2028 ($ million)
- Data Table on Italy - Market size and forecast 2023-2028 ($ million)
- Chart on Italy - Year-over-year growth 2023-2028 (%)
- Data Table on Italy - Year-over-year growth 2023-2028 (%)
- 9.10 US - Market size and forecast 2023-2028
- Chart on US - Market size and forecast 2023-2028 ($ million)
- Data Table on US - Market size and forecast 2023-2028 ($ million)
- Chart on US - Year-over-year growth 2023-2028 (%)
- Data Table on US - Year-over-year growth 2023-2028 (%)
- 9.11 Turkey - Market size and forecast 2023-2028
- Chart on Turkey - Market size and forecast 2023-2028 ($ million)
- Data Table on Turkey - Market size and forecast 2023-2028 ($ million)
- Chart on Turkey - Year-over-year growth 2023-2028 (%)
- Data Table on Turkey - Year-over-year growth 2023-2028 (%)
- 9.12 Portugal - Market size and forecast 2023-2028
- Chart on Portugal - Market size and forecast 2023-2028 ($ million)
- Data Table on Portugal - Market size and forecast 2023-2028 ($ million)
- Chart on Portugal - Year-over-year growth 2023-2028 (%)
- Data Table on Portugal - Year-over-year growth 2023-2028 (%)
- 9.13 Market opportunity By Geographical Landscape
- Market opportunity By Geographical Landscape ($ million)
- Data Tables on Market opportunity By Geographical Landscape ($ million)
10 Drivers, Challenges, and Opportunity/Restraints
- 10.1 Market drivers
- 10.2 Market challenges
- 10.3 Impact of drivers and challenges
- Impact of drivers and challenges in 2023 and 2028
- 10.4 Market opportunities/restraints
11 Competitive Landscape
- 11.1 Overview
- 11.2 Competitive Landscape
- Overview on criticality of inputs and factors of differentiation
- 11.3 Landscape disruption
- Overview on factors of disruption
- 11.4 Industry risks
- Impact of key risks on business
12 Competitive Analysis
- 12.1 Companies profiled
- Companies covered
- 12.2 Market positioning of companies
- Matrix on companies position and classification
- 12.3 Barleans Organic Oils LLC
- Barleans Organic Oils LLC - Overview
- Barleans Organic Oils LLC - Product / Service
- Barleans Organic Oils LLC - Key offerings
- 12.4 Comvita Ltd.
- Comvita Ltd. - Overview
- Comvita Ltd. - Business segments
- Comvita Ltd. - Key offerings
- Comvita Ltd. - Segment focus
- 12.5 Dohler GmbH
- Dohler GmbH - Overview
- Dohler GmbH - Product / Service
- Dohler GmbH - Key offerings
- 12.6 Dr. Willmar Schwabe GmbH and Co. KG
- Dr. Willmar Schwabe GmbH and Co. KG - Overview
- Dr. Willmar Schwabe GmbH and Co. KG - Product / Service
- Dr. Willmar Schwabe GmbH and Co. KG - Key offerings
- 12.7 Evergreen Life Products Srl
- Evergreen Life Products Srl - Overview
- Evergreen Life Products Srl - Product / Service
- Evergreen Life Products Srl - Key offerings
- 12.8 Gaia Herbs Inc.
- Gaia Herbs Inc. - Overview
- Gaia Herbs Inc. - Product / Service
- Gaia Herbs Inc. - Key offerings
- 12.9 Grupo Natac S.L.U.
- Grupo Natac S.L.U. - Overview
- Grupo Natac S.L.U. - Product / Service
- Grupo Natac S.L.U. - Key offerings
- 12.10 International Flavors and Fragrances Inc.
- International Flavors and Fragrances Inc. - Overview
- International Flavors and Fragrances Inc. - Business segments
- International Flavors and Fragrances Inc. - Key news
- International Flavors and Fragrances Inc. - Key offerings
- International Flavors and Fragrances Inc. - Segment focus
- 12.11 Medikonda Nutrients
- Medikonda Nutrients - Overview
- Medikonda Nutrients - Product / Service
- Medikonda Nutrients - Key offerings
- 12.12 Nanjing NutriHerb BioTech Co. Ltd.
- Nanjing NutriHerb BioTech Co. Ltd. - Overview
- Nanjing NutriHerb BioTech Co. Ltd. - Product / Service
- Nanjing NutriHerb BioTech Co. Ltd. - Key offerings
- 12.13 NOW Health Group Inc.
- NOW Health Group Inc. - Overview
- NOW Health Group Inc. - Product / Service
- NOW Health Group Inc. - Key offerings
- 12.14 Olivus Inc.
- Olivus Inc. - Overview
- Olivus Inc. - Product / Service
- Olivus Inc. - Key offerings
- 12.15 Select Botanical S.L.
- Select Botanical S.L. - Overview
- Select Botanical S.L. - Product / Service
- Select Botanical S.L. - Key offerings
- 12.16 Simple Life Nutrition
- Simple Life Nutrition - Overview
- Simple Life Nutrition - Product / Service
- Simple Life Nutrition - Key offerings
- 12.17 Starwest Botanicals.com Inc.
- Starwest Botanicals.com Inc. - Overview
- Starwest Botanicals.com Inc. - Product / Service
- Starwest Botanicals.com Inc. - Key offerings
13 Appendix
- 13.1 Scope of the report
- 13.2 Inclusions and exclusions checklist
- Inclusions checklist
- Exclusions checklist
- 13.3 Currency conversion rates for US$
- Currency conversion rates for US$
- 13.4 Research methodology
- Research methodology
- 13.5 Data procurement
- Information sources
- 13.6 Data validation
- Data validation
- 13.7 Validation techniques employed for market sizing
- Validation techniques employed for market sizing
- 13.8 Data synthesis
- Data synthesis
- 360 degree market analysis
- 360 degree market analysis
- 13.10 List of abbreviations
- List of abbreviations
