|
|
市場調査レポート
商品コード
1910979
臭素の世界市場、2026年~2030年Global Bromine Market 2026-2030 |
||||||
|
|||||||
カスタマイズ可能
|
|||||||

| 臭素の世界市場、2026年~2030年 |
|
出版日: 2026年01月14日
発行: TechNavio
ページ情報: 英文 305 Pages
納期: 即納可能
|

概要
世界の臭素市場は、2025年から2030年にかけて9億2,060万米ドルの成長が見込まれ、予測期間中のCAGRは3.5%と予測されています。
本世界の臭素市場に関するレポートでは、包括的な分析、市場規模と予測、動向、成長要因、課題に加え、約25社のベンダーを網羅したベンダー分析を提供しています。
本レポートは、現在の市場状況、最新の動向と促進要因、市場環境全般に関する最新の分析を提供します。市場の成長は、石油・ガス産業の拡大、難燃剤への需要増加、新興経済国における臭素需要の増加によって牽引されています。
本調査は、業界の主要関係者からの情報をはじめとする一次情報と二次情報を客観的に組み合わせて実施されました。本レポートには、主要企業の分析に加え、包括的な市場規模データ、地域別分析を伴うセグメント、ベンダー情勢が含まれています。レポートには過去データと予測データが記載されています。
| 市場範囲 | |
|---|---|
| 基準年 | 2026年 |
| 終了年 | 2030年 |
| 予測期間 | 2026年~2030年 |
| 成長モメンタム | 加速 |
| 前年比2026年 | 3.4% |
| CAGR | 3.5% |
| 増分額 | 9億2,060万米ドル |
本調査では、水銀排出規制の強化が今後数年間における世界の臭素市場成長を牽引する主要な要因の一つであると特定しています。また、海水塩水抽出技術の拡大と電気自動車(EV)の需要増加が、市場において相当な需要を生み出す見込みです。
目次
第1章 エグゼクティブサマリー
第2章 Technavio分析
- 価格反応性・ライフサイクル・顧客購入バスケット・採用率・購入基準の分析
- インプットの重要性と差別化の要因
- 混乱の要因
- 促進要因と課題の影響
第3章 市場情勢
- 市場エコシステム
- 市場の特徴
- バリューチェーン分析
第4章 市場規模
- 市場の定義
- 市場セグメント分析
- 市場規模、2025年
- 市場の見通し、2025年~2030年
第5章 市場規模実績
- 世界の臭素市場、2020年~2024年
- 派生製品タイプセグメント分析、2020年~2024年
- 用途別セグメント分析、2020年~2024年
- グレードタイプセグメント分析、2020年~2024年
- 地域別セグメント分析、2020年~2024年
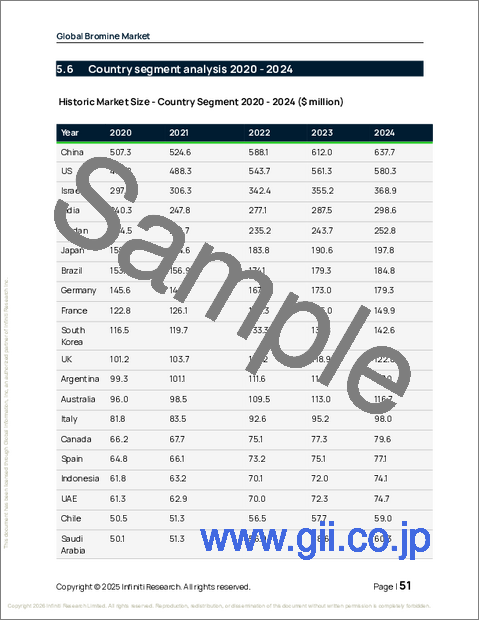
- 国別セグメント分析、2020年~2024年
第6章 定性分析
- AIの影響:世界の臭素市場
第7章 ファイブフォース分析
- ファイブフォースの要約
- 買い手の交渉力
- 供給企業の交渉力
- 新規参入業者の脅威
- 代替品の脅威
- 競争の脅威
- 市況
第8章 市場セグメンテーション:派生タイプ別
- 比較:派生タイプ別
- 臭化水素
- 有機臭素化合物
- 臭素系液体
- その他
- 市場機会:派生タイプ別
第9章 市場セグメンテーション:用途別
- 比較:用途別
- 難燃剤
- 掘削流体
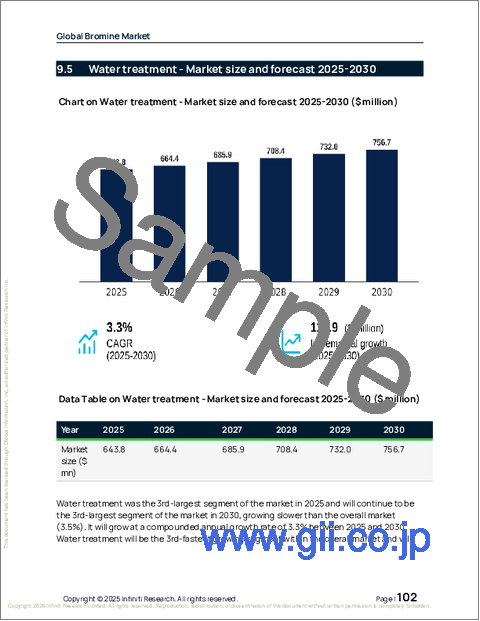
- 水処理
- 農業
- その他
- 市場機会:用途別
第10章 市場セグメンテーション:グレードタイプ別
- 比較:グレードタイプ別
- テクニカルグレード
- 標準グレード
- 高純度グレード
- 市場機会:グレードタイプ別
第11章 顧客情勢
第12章 地域別情勢
- 地域別セグメンテーション
- 地域別比較
- アジア太平洋地域
- 中国
- インド
- 日本
- 韓国
- オーストラリア
- インドネシア
- 中東・アフリカ
- イスラエル
- ヨルダン
- UAE
- サウジアラビア
- 南アフリカ
- 欧州
- ドイツ
- フランス
- イギリス
- イタリア
- スペイン
- オランダ
- 北米
- 米国
- カナダ
- メキシコ
- 南米
- ブラジル
- アルゼンチン
- チリ
- 市場機会:地域別
第13章 促進要因、課題、機会
- 市場促進要因
- 市場の課題
- 促進要因と課題の影響
- 市場機会
第14章 競合情勢
- 概要
- 競合情勢
- 混乱の状況
- 業界のリスク
第15章 競合分析
- 企業プロファイル
- 企業ランキング指標
- 企業の市場ポジショニング
- Agrocel Industries Pvt. Ltd.
- Albemarle Corp.
- Archean Chemical Industries
- Dhruv Chem Industries
- Gulf Resources Inc.
- Honeywell International Inc.
- Israel Chemicals Ltd.
- Lanxess AG
- Mody Chemi Pharma Ltd.
- Morre Tec Industries Inc.
- Pacific Organics Pvt. Ltd.
- Solaris Chemtech
- Tata Chemicals Ltd.
- Tosoh Corp.
- Yogi Intermediates Pvt. Ltd.

