|
|
市場調査レポート
商品コード
1625965
住宅用屋根材の世界市場 (2025~2029年)Global Residential Roofing Market 2025-2029 |
||||||

|
|||||||
カスタマイズ可能
|
|||||||


| 住宅用屋根材の世界市場 (2025~2029年) |
|
出版日: 2024年11月28日
発行: TechNavio
ページ情報: 英文 210 Pages
納期: 即納可能
|

全表示
- 概要
- 図表
- 目次
住宅用屋根材市場 (2025~2029年)
住宅用屋根材市場は2024年から2029年に2,760万米ドル分拡大し、予測期間中に5.6%のCAGRで成長すると予測されます。当レポートでは、住宅用屋根材市場の全体的な分析、市場規模・予測、動向、成長促進要因、課題、約25社のベンダーを網羅したベンダー分析などを掲載しています。
当レポートでは、現在の市場シナリオ、最新動向と促進要因、市場環境全体に関する最新分析を提供しています。当市場は、住宅建設の増加、急速な都市化、政府のイニシアチブによって牽引されています。
| 市場範囲 | |
|---|---|
| 基準年 | 2025年 |
| 終了年 | 2029年 |
| 予測期間 | 2025~2029年 |
| 成長モメンタム | 加速 |
| 前年比 (2025年) | 4.2% |
| CAGR | 5.6% |
| 増分額 | 2,760万米ドル |
当レポートでは、今後数年間の住宅用屋根材の市場成長を牽引する主要因の一つとして、戦略的パートナーシップを挙げています。また、製品イノベーションと持続可能な住宅用屋根材の採用は、市場の大きな需要につながります。
目次
第1章 エグゼクティブサマリー
- 市場概要
第2章 Technavioによる分析
- 価格感応度・ライフサイクル・顧客購入バスケット・採用率・購入基準の分析
- インプットの重要性と差別化の要因
- 混乱の要因
- 促進要因と課題の影響
第3章 市場情勢
- 市場エコシステム
- 市場の特徴
- バリューチェーン分析
第4章 市場規模の評価
- 市場の定義
- 市場セグメント分析
- 市場規模 (2024年)
- 市場の見通し (2024~2029年)
第5章 市場規模実績
- 世界の住宅用屋根材市場 (2019~2023年)
- 種類別分析 (2019~2023年)
- 製品別分析 (2019~2023年)
- 地域別分析 (2019~2023年)
- 国別分析 (2019~2023年)
第6章 定性分析
- AIの影響:世界の住宅用屋根材市場
第7章 ファイブフォース分析
- ファイブフォースの要約
- 買い手の交渉力
- 供給企業の交渉力
- 新規参入業者の脅威
- 代替品の脅威
- 競争の脅威
- 市況
第8章 市場区分:種類別
- 市場区分
- 比較:種類別
- 屋根葺き替え:市場規模と予測 (2024~2029年)
- 新築:市場規模と予測 (2024~2029年)
- 市場機会:種類別
第9章 市場セグメンテーション:製品別
- 市場セグメント
- 比較:製品別
- アスファルトシングル:市場規模と予測 (2024~2029年)
- 金属屋根:市場規模と予測 (2024~2029年)
- 陶磁器・コンクリートタイル:市場規模と予測 (2024~2029年)
- ソーラータイル:市場規模と予測 (2024~2029年)
- その他:市場規模と予測 (2024~2029年)
- 市場機会:製品別
第10章 顧客情勢
- 顧客情勢の概要
第11章 地域別情勢
- 地域別区分
- 地域別比較
- 北米:市場規模と予測 (2024~2029年)
- アジア太平洋:市場規模と予測 (2024~2029年)
- 欧州:市場規模と予測 (2024~2029年)
- 南米:市場規模と予測 (2024~2029年)
- 中東・アフリカ:市場規模と予測 (2024~2029年)
- 米国:市場規模と予測 (2024~2029年)
- 中国:市場規模と予測 (2024~2029年)
- ドイツ:市場規模と予測 (2024~2029年)
- インド:市場規模と予測 (2024~2029年)
- 英国:市場規模と予測 (2024~2029年)
- カナダ:市場規模と予測 (2024~2029年)
- フランス:市場規模と予測 (2024~2029年)
- 日本:市場規模と予測 (2024~2029年)
- ブラジル:市場規模と予測 (2024~2029年)
- オーストラリア:市場規模と予測 (2024~2029年)
- 市場機会:地域情勢別
第12章 促進要因・課題・機会・抑制要因
- 市場促進要因
- 市場の課題
- 促進要因と課題の影響
- 市場の機会・抑制要因
第13章 競合情勢
- 概要
- 競合情勢
- 混乱の状況
- 業界のリスク
第14章 競合分析
- 企業プロファイル
- 企業ランキング指数
- 企業の市場ポジショニング
- Atlas Roofing Corp.
- BEACON ROOFING SUPPLY INC.
- BMI Group Holdings UK Ltd.
- Boral Ltd.
- Carlisle Companies Inc.
- Compagnie de Saint-Gobain SA
- Duro Last Inc.
- Etex NV
- GAF Materials LLC
- IKO Industries Ltd.
- Kingspan Group
- Owens Corning
- Sika AG
- SOPREMA SAS
- TAMKO Building Products LLC
第15章 付録
Exhibits:
- Exhibits1: Executive Summary - Chart on Market Overview
- Exhibits2: Executive Summary - Data Table on Market Overview
- Exhibits3: Executive Summary - Chart on Global Market Characteristics
- Exhibits4: Executive Summary - Chart on Market By Geographical Landscape
- Exhibits5: Executive Summary - Chart on Market Segmentation by Type
- Exhibits6: Executive Summary - Chart on Market Segmentation by Product
- Exhibits7: Executive Summary - Chart on Incremental Growth
- Exhibits8: Executive Summary - Data Table on Incremental Growth
- Exhibits9: Executive Summary - Chart on Company Market Positioning
- Exhibits10: Analysis of price sensitivity, lifecycle, customer purchase basket, adoption rates, and purchase criteria
- Exhibits11: Overview on criticality of inputs and factors of differentiation
- Exhibits12: Overview on factors of disruption
- Exhibits13: Impact of drivers and challenges in 2024 and 2029
- Exhibits14: Parent Market
- Exhibits15: Data Table on - Parent Market
- Exhibits16: Market characteristics analysis
- Exhibits17: Value chain analysis
- Exhibits18: Offerings of companies included in the market definition
- Exhibits19: Market segments
- Exhibits20: Chart on Global - Market size and forecast 2024-2029 ($ million)
- Exhibits21: Data Table on Global - Market size and forecast 2024-2029 ($ million)
- Exhibits22: Chart on Global Market: Year-over-year growth 2024-2029 (%)
- Exhibits23: Data Table on Global Market: Year-over-year growth 2024-2029 (%)
- Exhibits24: Historic Market Size - Data Table on Global Residential Roofing Market 2019 - 2023 ($ million)
- Exhibits25: Historic Market Size - Type Segment 2019 - 2023 ($ million)
- Exhibits26: Historic Market Size - Product Segment 2019 - 2023 ($ million)
- Exhibits27: Historic Market Size - Geography Segment 2019 - 2023 ($ million)
- Exhibits28: Historic Market Size - Country Segment 2019 - 2023 ($ million)
- Exhibits29: Five forces analysis - Comparison between 2024 and 2029
- Exhibits30: Bargaining power of buyers - Impact of key factors 2024 and 2029
- Exhibits31: Bargaining power of suppliers - Impact of key factors in 2024 and 2029
- Exhibits32: Threat of new entrants - Impact of key factors in 2024 and 2029
- Exhibits33: Threat of substitutes - Impact of key factors in 2024 and 2029
- Exhibits34: Threat of rivalry - Impact of key factors in 2024 and 2029
- Exhibits35: Chart on Market condition - Five forces 2024 and 2029
- Exhibits36: Chart on Type - Market share 2024-2029 (%)
- Exhibits37: Data Table on Type - Market share 2024-2029 (%)
- Exhibits38: Chart on Comparison by Type
- Exhibits39: Data Table on Comparison by Type
- Exhibits40: Chart on Reroofing - Market size and forecast 2024-2029 ($ million)
- Exhibits41: Data Table on Reroofing - Market size and forecast 2024-2029 ($ million)
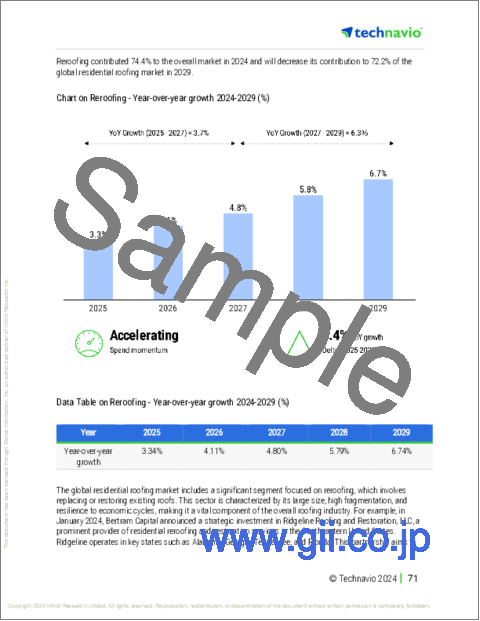
- Exhibits42: Chart on Reroofing - Year-over-year growth 2024-2029 (%)
- Exhibits43: Data Table on Reroofing - Year-over-year growth 2024-2029 (%)
- Exhibits44: Chart on New construction - Market size and forecast 2024-2029 ($ million)
- Exhibits45: Data Table on New construction - Market size and forecast 2024-2029 ($ million)
- Exhibits46: Chart on New construction - Year-over-year growth 2024-2029 (%)
- Exhibits47: Data Table on New construction - Year-over-year growth 2024-2029 (%)
- Exhibits48: Market opportunity by Type ($ million)
- Exhibits49: Data Table on Market opportunity by Type ($ million)
- Exhibits50: Chart on Product - Market share 2024-2029 (%)
- Exhibits51: Data Table on Product - Market share 2024-2029 (%)
- Exhibits52: Chart on Comparison by Product
- Exhibits53: Data Table on Comparison by Product
- Exhibits54: Chart on Asphalt shingles - Market size and forecast 2024-2029 ($ million)
- Exhibits55: Data Table on Asphalt shingles - Market size and forecast 2024-2029 ($ million)
- Exhibits56: Chart on Asphalt shingles - Year-over-year growth 2024-2029 (%)
- Exhibits57: Data Table on Asphalt shingles - Year-over-year growth 2024-2029 (%)
- Exhibits58: Chart on Metal roofing - Market size and forecast 2024-2029 ($ million)
- Exhibits59: Data Table on Metal roofing - Market size and forecast 2024-2029 ($ million)
- Exhibits60: Chart on Metal roofing - Year-over-year growth 2024-2029 (%)
- Exhibits61: Data Table on Metal roofing - Year-over-year growth 2024-2029 (%)
- Exhibits62: Chart on Clay and concrete tiles - Market size and forecast 2024-2029 ($ million)
- Exhibits63: Data Table on Clay and concrete tiles - Market size and forecast 2024-2029 ($ million)
- Exhibits64: Chart on Clay and concrete tiles - Year-over-year growth 2024-2029 (%)
- Exhibits65: Data Table on Clay and concrete tiles - Year-over-year growth 2024-2029 (%)
- Exhibits66: Chart on Solar tile - Market size and forecast 2024-2029 ($ million)
- Exhibits67: Data Table on Solar tile - Market size and forecast 2024-2029 ($ million)
- Exhibits68: Chart on Solar tile - Year-over-year growth 2024-2029 (%)
- Exhibits69: Data Table on Solar tile - Year-over-year growth 2024-2029 (%)
- Exhibits70: Chart on Others - Market size and forecast 2024-2029 ($ million)
- Exhibits71: Data Table on Others - Market size and forecast 2024-2029 ($ million)
- Exhibits72: Chart on Others - Year-over-year growth 2024-2029 (%)
- Exhibits73: Data Table on Others - Year-over-year growth 2024-2029 (%)
- Exhibits74: Market opportunity by Product ($ million)
- Exhibits75: Data Table on Market opportunity by Product ($ million)
- Exhibits76: Analysis of price sensitivity, lifecycle, customer purchase basket, adoption rates, and purchase criteria
- Exhibits77: Chart on Market share By Geographical Landscape 2024-2029 (%)
- Exhibits78: Data Table on Market share By Geographical Landscape 2024-2029 (%)
- Exhibits79: Chart on Geographic comparison
- Exhibits80: Data Table on Geographic comparison
- Exhibits81: Chart on North America - Market size and forecast 2024-2029 ($ million)
- Exhibits82: Data Table on North America - Market size and forecast 2024-2029 ($ million)
- Exhibits83: Chart on North America - Year-over-year growth 2024-2029 (%)
- Exhibits84: Data Table on North America - Year-over-year growth 2024-2029 (%)
- Exhibits85: Chart on APAC - Market size and forecast 2024-2029 ($ million)
- Exhibits86: Data Table on APAC - Market size and forecast 2024-2029 ($ million)
- Exhibits87: Chart on APAC - Year-over-year growth 2024-2029 (%)
- Exhibits88: Data Table on APAC - Year-over-year growth 2024-2029 (%)
- Exhibits89: Chart on Europe - Market size and forecast 2024-2029 ($ million)
- Exhibits90: Data Table on Europe - Market size and forecast 2024-2029 ($ million)
- Exhibits91: Chart on Europe - Year-over-year growth 2024-2029 (%)
- Exhibits92: Data Table on Europe - Year-over-year growth 2024-2029 (%)
- Exhibits93: Chart on South America - Market size and forecast 2024-2029 ($ million)
- Exhibits94: Data Table on South America - Market size and forecast 2024-2029 ($ million)
- Exhibits95: Chart on South America - Year-over-year growth 2024-2029 (%)
- Exhibits96: Data Table on South America - Year-over-year growth 2024-2029 (%)
- Exhibits97: Chart on Middle East and Africa - Market size and forecast 2024-2029 ($ million)
- Exhibits98: Data Table on Middle East and Africa - Market size and forecast 2024-2029 ($ million)
- Exhibits99: Chart on Middle East and Africa - Year-over-year growth 2024-2029 (%)
- Exhibits100: Data Table on Middle East and Africa - Year-over-year growth 2024-2029 (%)
- Exhibits101: Chart on US - Market size and forecast 2024-2029 ($ million)
- Exhibits102: Data Table on US - Market size and forecast 2024-2029 ($ million)
- Exhibits103: Chart on US - Year-over-year growth 2024-2029 (%)
- Exhibits104: Data Table on US - Year-over-year growth 2024-2029 (%)
- Exhibits105: Chart on China - Market size and forecast 2024-2029 ($ million)
- Exhibits106: Data Table on China - Market size and forecast 2024-2029 ($ million)
- Exhibits107: Chart on China - Year-over-year growth 2024-2029 (%)
- Exhibits108: Data Table on China - Year-over-year growth 2024-2029 (%)
- Exhibits109: Chart on Germany - Market size and forecast 2024-2029 ($ million)
- Exhibits110: Data Table on Germany - Market size and forecast 2024-2029 ($ million)
- Exhibits111: Chart on Germany - Year-over-year growth 2024-2029 (%)
- Exhibits112: Data Table on Germany - Year-over-year growth 2024-2029 (%)
- Exhibits113: Chart on India - Market size and forecast 2024-2029 ($ million)
- Exhibits114: Data Table on India - Market size and forecast 2024-2029 ($ million)
- Exhibits115: Chart on India - Year-over-year growth 2024-2029 (%)
- Exhibits116: Data Table on India - Year-over-year growth 2024-2029 (%)
- Exhibits117: Chart on UK - Market size and forecast 2024-2029 ($ million)
- Exhibits118: Data Table on UK - Market size and forecast 2024-2029 ($ million)
- Exhibits119: Chart on UK - Year-over-year growth 2024-2029 (%)
- Exhibits120: Data Table on UK - Year-over-year growth 2024-2029 (%)
- Exhibits121: Chart on Canada - Market size and forecast 2024-2029 ($ million)
- Exhibits122: Data Table on Canada - Market size and forecast 2024-2029 ($ million)
- Exhibits123: Chart on Canada - Year-over-year growth 2024-2029 (%)
- Exhibits124: Data Table on Canada - Year-over-year growth 2024-2029 (%)
- Exhibits125: Chart on France - Market size and forecast 2024-2029 ($ million)
- Exhibits126: Data Table on France - Market size and forecast 2024-2029 ($ million)
- Exhibits127: Chart on France - Year-over-year growth 2024-2029 (%)
- Exhibits128: Data Table on France - Year-over-year growth 2024-2029 (%)
- Exhibits129: Chart on Japan - Market size and forecast 2024-2029 ($ million)
- Exhibits130: Data Table on Japan - Market size and forecast 2024-2029 ($ million)
- Exhibits131: Chart on Japan - Year-over-year growth 2024-2029 (%)
- Exhibits132: Data Table on Japan - Year-over-year growth 2024-2029 (%)
- Exhibits133: Chart on Brazil - Market size and forecast 2024-2029 ($ million)
- Exhibits134: Data Table on Brazil - Market size and forecast 2024-2029 ($ million)
- Exhibits135: Chart on Brazil - Year-over-year growth 2024-2029 (%)
- Exhibits136: Data Table on Brazil - Year-over-year growth 2024-2029 (%)
- Exhibits137: Chart on Australia - Market size and forecast 2024-2029 ($ million)
- Exhibits138: Data Table on Australia - Market size and forecast 2024-2029 ($ million)
- Exhibits139: Chart on Australia - Year-over-year growth 2024-2029 (%)
- Exhibits140: Data Table on Australia - Year-over-year growth 2024-2029 (%)
- Exhibits141: Market opportunity By Geographical Landscape ($ million)
- Exhibits142: Data Tables on Market opportunity By Geographical Landscape ($ million)
- Exhibits143: Impact of drivers and challenges in 2024 and 2029
- Exhibits144: Overview on criticality of inputs and factors of differentiation
- Exhibits145: Overview on factors of disruption
- Exhibits146: Impact of key risks on business
- Exhibits147: Companies covered
- Exhibits148: Company ranking index
- Exhibits149: Matrix on companies position and classification
- Exhibits150: Atlas Roofing Corp. - Overview
- Exhibits151: Atlas Roofing Corp. - Product / Service
- Exhibits152: Atlas Roofing Corp. - Key offerings
- Exhibits153: SWOT
- Exhibits154: BEACON ROOFING SUPPLY INC. - Overview
- Exhibits155: BEACON ROOFING SUPPLY INC. - Product / Service
- Exhibits156: BEACON ROOFING SUPPLY INC. - Key offerings
- Exhibits157: SWOT
- Exhibits158: BMI Group Holdings UK Ltd. - Overview
- Exhibits159: BMI Group Holdings UK Ltd. - Product / Service
- Exhibits160: BMI Group Holdings UK Ltd. - Key offerings
- Exhibits161: SWOT
- Exhibits162: Boral Ltd. - Overview
- Exhibits163: Boral Ltd. - Product / Service
- Exhibits164: Boral Ltd. - Key offerings
- Exhibits165: SWOT
- Exhibits166: Carlisle Companies Inc. - Overview
- Exhibits167: Carlisle Companies Inc. - Business segments
- Exhibits168: Carlisle Companies Inc. - Key news
- Exhibits169: Carlisle Companies Inc. - Key offerings
- Exhibits170: Carlisle Companies Inc. - Segment focus
- Exhibits171: SWOT
- Exhibits172: Compagnie de Saint-Gobain SA - Overview
- Exhibits173: Compagnie de Saint-Gobain SA - Business segments
- Exhibits174: Compagnie de Saint-Gobain SA - Key news
- Exhibits175: Compagnie de Saint-Gobain SA - Key offerings
- Exhibits176: Compagnie de Saint-Gobain SA - Segment focus
- Exhibits177: SWOT
- Exhibits178: Duro Last Inc. - Overview
- Exhibits179: Duro Last Inc. - Product / Service
- Exhibits180: Duro Last Inc. - Key offerings
- Exhibits181: SWOT
- Exhibits182: Etex NV - Overview
- Exhibits183: Etex NV - Business segments
- Exhibits184: Etex NV - Key offerings
- Exhibits185: Etex NV - Segment focus
- Exhibits186: SWOT
- Exhibits187: GAF Materials LLC - Overview
- Exhibits188: GAF Materials LLC - Product / Service
- Exhibits189: GAF Materials LLC - Key offerings
- Exhibits190: SWOT
- Exhibits191: IKO Industries Ltd. - Overview
- Exhibits192: IKO Industries Ltd. - Product / Service
- Exhibits193: IKO Industries Ltd. - Key offerings
- Exhibits194: SWOT
- Exhibits195: Kingspan Group - Overview
- Exhibits196: Kingspan Group - Product / Service
- Exhibits197: Kingspan Group - Key news
- Exhibits198: Kingspan Group - Key offerings
- Exhibits199: SWOT
- Exhibits200: Owens Corning - Overview
- Exhibits201: Owens Corning - Business segments
- Exhibits202: Owens Corning - Key news
- Exhibits203: Owens Corning - Key offerings
- Exhibits204: Owens Corning - Segment focus
- Exhibits205: SWOT
- Exhibits206: Sika AG - Overview
- Exhibits207: Sika AG - Business segments
- Exhibits208: Sika AG - Key news
- Exhibits209: Sika AG - Key offerings
- Exhibits210: Sika AG - Segment focus
- Exhibits211: SWOT
- Exhibits212: SOPREMA SAS - Overview
- Exhibits213: SOPREMA SAS - Product / Service
- Exhibits214: SOPREMA SAS - Key offerings
- Exhibits215: SWOT
- Exhibits216: TAMKO Building Products LLC - Overview
- Exhibits217: TAMKO Building Products LLC - Product / Service
- Exhibits218: TAMKO Building Products LLC - Key offerings
- Exhibits219: SWOT
- Exhibits220: Inclusions checklist
- Exhibits221: Exclusions checklist
- Exhibits222: Currency conversion rates for US$
- Exhibits223: Research methodology
- Exhibits224: Information sources
- Exhibits225: Data validation
- Exhibits226: Validation techniques employed for market sizing
- Exhibits227: Data synthesis
- Exhibits228: 360 degree market analysis
- Exhibits229: List of abbreviations
Residential Roofing Market 2025-2029
The residential roofing market is forecasted to grow by USD 27.6 mn during 2024-2029, accelerating at a CAGR of 5.6% during the forecast period. The report on the residential roofing market provides a holistic analysis, market size and forecast, trends, growth drivers, and challenges, as well as vendor analysis covering around 25 vendors.
The report offers an up-to-date analysis regarding the current market scenario, the latest trends and drivers, and the overall market environment. The market is driven by increasing residential construction, rapid urbanization, and government initiatives.
| Market Scope | |
|---|---|
| Base Year | 2025 |
| End Year | 2029 |
| Series Year | 2025-2029 |
| Growth Momentum | Accelerate |
| YOY 2025 | 4.2% |
| CAGR | 5.6% |
| Incremental Value | $27.6 mn |
Technavio's residential roofing market is segmented as below:
By Type
- Reroofing
- New construction
By Product
- Asphalt shingles
- Metal roofing
- Clay and concrete tiles
- Solar tile
- Others
By Geographical Landscape
- North America
- APAC
- Europe
- South America
- Middle East and Africa
This study identifies the strategic partnerships as one of the prime reasons driving the residential roofing market growth during the next few years. Also, product innovations and adoption of sustainable residential roofing will lead to sizable demand in the market.
The report on the residential roofing market covers the following areas:
- Residential Roofing Market sizing
- Residential Roofing Market forecast
- Residential Roofing Market industry analysis
The robust vendor analysis is designed to help clients improve their market position, and in line with this, this report provides a detailed analysis of several leading residential roofing market vendors that include Atlas Roofing Corp., BEACON ROOFING SUPPLY INC., BMI Group Holdings UK Ltd., Boral Ltd., Carlisle Companies Inc., Compagnie de Saint-Gobain SA, Duro Last Inc., Etex NV, GAF Materials LLC, IKO Industries Ltd., Kingspan Group, Owens Corning, Sika AG, SOPREMA SAS, and TAMKO Building Products LLC. Also, the residential roofing market analysis report includes information on upcoming trends and challenges that will influence market growth. This is to help companies strategize and leverage all forthcoming growth opportunities.
The study was conducted using an objective combination of primary and secondary information including inputs from key participants in the industry. The report contains a comprehensive market and vendor landscape in addition to an analysis of the key vendors.
The publisher presents a detailed picture of the market by the way of study, synthesis, and summation of data from multiple sources by an analysis of key parameters such as profit, pricing, competition, and promotions. It presents various market facets by identifying the key industry influencers. The data presented is comprehensive, reliable, and a result of extensive primary and secondary research. The market research reports provide a complete competitive landscape and an in-depth vendor selection methodology and analysis using qualitative and quantitative research to forecast accurate market growth.
Table of Contents
1 Executive Summary
- 1.1 Market overview
- Executive Summary - Chart on Market Overview
- Executive Summary - Data Table on Market Overview
- Executive Summary - Chart on Global Market Characteristics
- Executive Summary - Chart on Market By Geographical Landscape
- Executive Summary - Chart on Market Segmentation by Type
- Executive Summary - Chart on Market Segmentation by Product
- Executive Summary - Chart on Incremental Growth
- Executive Summary - Data Table on Incremental Growth
- Executive Summary - Chart on Company Market Positioning
2 Technavio Analysis
- 2.1 Analysis of price sensitivity, lifecycle, customer purchase basket, adoption rates, and purchase criteria
- Analysis of price sensitivity, lifecycle, customer purchase basket, adoption rates, and purchase criteria
- 2.2 Criticality of inputs and Factors of differentiation
- Overview on criticality of inputs and factors of differentiation
- 2.3 Factors of disruption
- Overview on factors of disruption
- 2.4 Impact of drivers and challenges
- Impact of drivers and challenges in 2024 and 2029
3 Market Landscape
- 3.1 Market ecosystem
- Parent Market
- Data Table on - Parent Market
- 3.2 Market characteristics
- Market characteristics analysis
- 3.3 Value chain analysis
- Value chain analysis
4 Market Sizing
- 4.1 Market definition
- Offerings of companies included in the market definition
- 4.2 Market segment analysis
- Market segments
- 4.3 Market size 2024
- 4.4 Market outlook: Forecast for 2024-2029
- Chart on Global - Market size and forecast 2024-2029 ($ million)
- Data Table on Global - Market size and forecast 2024-2029 ($ million)
- Chart on Global Market: Year-over-year growth 2024-2029 (%)
- Data Table on Global Market: Year-over-year growth 2024-2029 (%)
5 Historic Market Size
- 5.1 Global Residential Roofing Market 2019 - 2023
- Historic Market Size - Data Table on Global Residential Roofing Market 2019 - 2023 ($ million)
- 5.2 Type segment analysis 2019 - 2023
- Historic Market Size - Type Segment 2019 - 2023 ($ million)
- 5.3 Product segment analysis 2019 - 2023
- Historic Market Size - Product Segment 2019 - 2023 ($ million)
- 5.4 Geography segment analysis 2019 - 2023
- Historic Market Size - Geography Segment 2019 - 2023 ($ million)
- 5.5 Country segment analysis 2019 - 2023
- Historic Market Size - Country Segment 2019 - 2023 ($ million)
6 Qualitative Analysis
- 6.1 Impact of AI on the Global Residential Roofing Market
7 Five Forces Analysis
- 7.1 Five forces summary
- Five forces analysis - Comparison between 2024 and 2029
- 7.2 Bargaining power of buyers
- Bargaining power of buyers - Impact of key factors 2024 and 2029
- 7.3 Bargaining power of suppliers
- Bargaining power of suppliers - Impact of key factors in 2024 and 2029
- 7.4 Threat of new entrants
- Threat of new entrants - Impact of key factors in 2024 and 2029
- 7.5 Threat of substitutes
- Threat of substitutes - Impact of key factors in 2024 and 2029
- 7.6 Threat of rivalry
- Threat of rivalry - Impact of key factors in 2024 and 2029
- 7.7 Market condition
- Chart on Market condition - Five forces 2024 and 2029
8 Market Segmentation by Type
- 8.1 Market segments
- Chart on Type - Market share 2024-2029 (%)
- Data Table on Type - Market share 2024-2029 (%)
- 8.2 Comparison by Type
- Chart on Comparison by Type
- Data Table on Comparison by Type
- 8.3 Reroofing - Market size and forecast 2024-2029
- Chart on Reroofing - Market size and forecast 2024-2029 ($ million)
- Data Table on Reroofing - Market size and forecast 2024-2029 ($ million)
- Chart on Reroofing - Year-over-year growth 2024-2029 (%)
- Data Table on Reroofing - Year-over-year growth 2024-2029 (%)
- 8.4 New construction - Market size and forecast 2024-2029
- Chart on New construction - Market size and forecast 2024-2029 ($ million)
- Data Table on New construction - Market size and forecast 2024-2029 ($ million)
- Chart on New construction - Year-over-year growth 2024-2029 (%)
- Data Table on New construction - Year-over-year growth 2024-2029 (%)
- 8.5 Market opportunity by Type
- Market opportunity by Type ($ million)
- Data Table on Market opportunity by Type ($ million)
9 Market Segmentation by Product
- 9.1 Market segments
- Chart on Product - Market share 2024-2029 (%)
- Data Table on Product - Market share 2024-2029 (%)
- 9.2 Comparison by Product
- Chart on Comparison by Product
- Data Table on Comparison by Product
- 9.3 Asphalt shingles - Market size and forecast 2024-2029
- Chart on Asphalt shingles - Market size and forecast 2024-2029 ($ million)
- Data Table on Asphalt shingles - Market size and forecast 2024-2029 ($ million)
- Chart on Asphalt shingles - Year-over-year growth 2024-2029 (%)
- Data Table on Asphalt shingles - Year-over-year growth 2024-2029 (%)
- 9.4 Metal roofing - Market size and forecast 2024-2029
- Chart on Metal roofing - Market size and forecast 2024-2029 ($ million)
- Data Table on Metal roofing - Market size and forecast 2024-2029 ($ million)
- Chart on Metal roofing - Year-over-year growth 2024-2029 (%)
- Data Table on Metal roofing - Year-over-year growth 2024-2029 (%)
- 9.5 Clay and concrete tiles - Market size and forecast 2024-2029
- Chart on Clay and concrete tiles - Market size and forecast 2024-2029 ($ million)
- Data Table on Clay and concrete tiles - Market size and forecast 2024-2029 ($ million)
- Chart on Clay and concrete tiles - Year-over-year growth 2024-2029 (%)
- Data Table on Clay and concrete tiles - Year-over-year growth 2024-2029 (%)
- 9.6 Solar tile - Market size and forecast 2024-2029
- Chart on Solar tile - Market size and forecast 2024-2029 ($ million)
- Data Table on Solar tile - Market size and forecast 2024-2029 ($ million)
- Chart on Solar tile - Year-over-year growth 2024-2029 (%)
- Data Table on Solar tile - Year-over-year growth 2024-2029 (%)
- 9.7 Others - Market size and forecast 2024-2029
- Chart on Others - Market size and forecast 2024-2029 ($ million)
- Data Table on Others - Market size and forecast 2024-2029 ($ million)
- Chart on Others - Year-over-year growth 2024-2029 (%)
- Data Table on Others - Year-over-year growth 2024-2029 (%)
- 9.8 Market opportunity by Product
- Market opportunity by Product ($ million)
- Data Table on Market opportunity by Product ($ million)
10 Customer Landscape
- 10.1 Customer landscape overview
- Analysis of price sensitivity, lifecycle, customer purchase basket, adoption rates, and purchase criteria
11 Geographic Landscape
- 11.1 Geographic segmentation
- Chart on Market share By Geographical Landscape 2024-2029 (%)
- Data Table on Market share By Geographical Landscape 2024-2029 (%)
- 11.2 Geographic comparison
- Chart on Geographic comparison
- Data Table on Geographic comparison
- 11.3 North America - Market size and forecast 2024-2029
- Chart on North America - Market size and forecast 2024-2029 ($ million)
- Data Table on North America - Market size and forecast 2024-2029 ($ million)
- Chart on North America - Year-over-year growth 2024-2029 (%)
- Data Table on North America - Year-over-year growth 2024-2029 (%)
- 11.4 APAC - Market size and forecast 2024-2029
- Chart on APAC - Market size and forecast 2024-2029 ($ million)
- Data Table on APAC - Market size and forecast 2024-2029 ($ million)
- Chart on APAC - Year-over-year growth 2024-2029 (%)
- Data Table on APAC - Year-over-year growth 2024-2029 (%)
- 11.5 Europe - Market size and forecast 2024-2029
- Chart on Europe - Market size and forecast 2024-2029 ($ million)
- Data Table on Europe - Market size and forecast 2024-2029 ($ million)
- Chart on Europe - Year-over-year growth 2024-2029 (%)
- Data Table on Europe - Year-over-year growth 2024-2029 (%)
- 11.6 South America - Market size and forecast 2024-2029
- Chart on South America - Market size and forecast 2024-2029 ($ million)
- Data Table on South America - Market size and forecast 2024-2029 ($ million)
- Chart on South America - Year-over-year growth 2024-2029 (%)
- Data Table on South America - Year-over-year growth 2024-2029 (%)
- 11.7 Middle East and Africa - Market size and forecast 2024-2029
- Chart on Middle East and Africa - Market size and forecast 2024-2029 ($ million)
- Data Table on Middle East and Africa - Market size and forecast 2024-2029 ($ million)
- Chart on Middle East and Africa - Year-over-year growth 2024-2029 (%)
- Data Table on Middle East and Africa - Year-over-year growth 2024-2029 (%)
- 11.8 US - Market size and forecast 2024-2029
- Chart on US - Market size and forecast 2024-2029 ($ million)
- Data Table on US - Market size and forecast 2024-2029 ($ million)
- Chart on US - Year-over-year growth 2024-2029 (%)
- Data Table on US - Year-over-year growth 2024-2029 (%)
- 11.9 China - Market size and forecast 2024-2029
- Chart on China - Market size and forecast 2024-2029 ($ million)
- Data Table on China - Market size and forecast 2024-2029 ($ million)
- Chart on China - Year-over-year growth 2024-2029 (%)
- Data Table on China - Year-over-year growth 2024-2029 (%)
- 11.10 Germany - Market size and forecast 2024-2029
- Chart on Germany - Market size and forecast 2024-2029 ($ million)
- Data Table on Germany - Market size and forecast 2024-2029 ($ million)
- Chart on Germany - Year-over-year growth 2024-2029 (%)
- Data Table on Germany - Year-over-year growth 2024-2029 (%)
- 11.11 India - Market size and forecast 2024-2029
- Chart on India - Market size and forecast 2024-2029 ($ million)
- Data Table on India - Market size and forecast 2024-2029 ($ million)
- Chart on India - Year-over-year growth 2024-2029 (%)
- Data Table on India - Year-over-year growth 2024-2029 (%)
- 11.12 UK - Market size and forecast 2024-2029
- Chart on UK - Market size and forecast 2024-2029 ($ million)
- Data Table on UK - Market size and forecast 2024-2029 ($ million)
- Chart on UK - Year-over-year growth 2024-2029 (%)
- Data Table on UK - Year-over-year growth 2024-2029 (%)
- 11.13 Canada - Market size and forecast 2024-2029
- Chart on Canada - Market size and forecast 2024-2029 ($ million)
- Data Table on Canada - Market size and forecast 2024-2029 ($ million)
- Chart on Canada - Year-over-year growth 2024-2029 (%)
- Data Table on Canada - Year-over-year growth 2024-2029 (%)
- 11.14 France - Market size and forecast 2024-2029
- Chart on France - Market size and forecast 2024-2029 ($ million)
- Data Table on France - Market size and forecast 2024-2029 ($ million)
- Chart on France - Year-over-year growth 2024-2029 (%)
- Data Table on France - Year-over-year growth 2024-2029 (%)
- 11.15 Japan - Market size and forecast 2024-2029
- Chart on Japan - Market size and forecast 2024-2029 ($ million)
- Data Table on Japan - Market size and forecast 2024-2029 ($ million)
- Chart on Japan - Year-over-year growth 2024-2029 (%)
- Data Table on Japan - Year-over-year growth 2024-2029 (%)
- 11.16 Brazil - Market size and forecast 2024-2029
- Chart on Brazil - Market size and forecast 2024-2029 ($ million)
- Data Table on Brazil - Market size and forecast 2024-2029 ($ million)
- Chart on Brazil - Year-over-year growth 2024-2029 (%)
- Data Table on Brazil - Year-over-year growth 2024-2029 (%)
- 11.17 Australia - Market size and forecast 2024-2029
- Chart on Australia - Market size and forecast 2024-2029 ($ million)
- Data Table on Australia - Market size and forecast 2024-2029 ($ million)
- Chart on Australia - Year-over-year growth 2024-2029 (%)
- Data Table on Australia - Year-over-year growth 2024-2029 (%)
- 11.18 Market opportunity By Geographical Landscape
- Market opportunity By Geographical Landscape ($ million)
- Data Tables on Market opportunity By Geographical Landscape ($ million)
12 Drivers, Challenges, and Opportunity/Restraints
- 12.1 Market drivers
- 12.2 Market challenges
- 12.3 Impact of drivers and challenges
- Impact of drivers and challenges in 2024 and 2029
- 12.4 Market opportunities/restraints
13 Competitive Landscape
- 13.1 Overview
- 13.2 Competitive Landscape
- Overview on criticality of inputs and factors of differentiation
- 13.3 Landscape disruption
- Overview on factors of disruption
- 13.4 Industry risks
- Impact of key risks on business
14 Competitive Analysis
- 14.1 Companies profiled
- Companies covered
- 14.2 Company ranking index
- Company ranking index
- 14.3 Market positioning of companies
- Matrix on companies position and classification
- 14.4 Atlas Roofing Corp.
- Atlas Roofing Corp. - Overview
- Atlas Roofing Corp. - Product / Service
- Atlas Roofing Corp. - Key offerings
- SWOT
- 14.5 BEACON ROOFING SUPPLY INC.
- BEACON ROOFING SUPPLY INC. - Overview
- BEACON ROOFING SUPPLY INC. - Product / Service
- BEACON ROOFING SUPPLY INC. - Key offerings
- SWOT
- 14.6 BMI Group Holdings UK Ltd.
- BMI Group Holdings UK Ltd. - Overview
- BMI Group Holdings UK Ltd. - Product / Service
- BMI Group Holdings UK Ltd. - Key offerings
- SWOT
- 14.7 Boral Ltd.
- Boral Ltd. - Overview
- Boral Ltd. - Product / Service
- Boral Ltd. - Key offerings
- SWOT
- 14.8 Carlisle Companies Inc.
- Carlisle Companies Inc. - Overview
- Carlisle Companies Inc. - Business segments
- Carlisle Companies Inc. - Key news
- Carlisle Companies Inc. - Key offerings
- Carlisle Companies Inc. - Segment focus
- SWOT
- 14.9 Compagnie de Saint-Gobain SA
- Compagnie de Saint-Gobain SA - Overview
- Compagnie de Saint-Gobain SA - Business segments
- Compagnie de Saint-Gobain SA - Key news
- Compagnie de Saint-Gobain SA - Key offerings
- Compagnie de Saint-Gobain SA - Segment focus
- SWOT
- 14.10 Duro Last Inc.
- Duro Last Inc. - Overview
- Duro Last Inc. - Product / Service
- Duro Last Inc. - Key offerings
- SWOT
- 14.11 Etex NV
- Etex NV - Overview
- Etex NV - Business segments
- Etex NV - Key offerings
- Etex NV - Segment focus
- SWOT
- 14.12 GAF Materials LLC
- GAF Materials LLC - Overview
- GAF Materials LLC - Product / Service
- GAF Materials LLC - Key offerings
- SWOT
- 14.13 IKO Industries Ltd.
- IKO Industries Ltd. - Overview
- IKO Industries Ltd. - Product / Service
- IKO Industries Ltd. - Key offerings
- SWOT
- 14.14 Kingspan Group
- Kingspan Group - Overview
- Kingspan Group - Product / Service
- Kingspan Group - Key news
- Kingspan Group - Key offerings
- SWOT
- 14.15 Owens Corning
- Owens Corning - Overview
- Owens Corning - Business segments
- Owens Corning - Key news
- Owens Corning - Key offerings
- Owens Corning - Segment focus
- SWOT
- 14.16 Sika AG
- Sika AG - Overview
- Sika AG - Business segments
- Sika AG - Key news
- Sika AG - Key offerings
- Sika AG - Segment focus
- SWOT
- 14.17 SOPREMA SAS
- SOPREMA SAS - Overview
- SOPREMA SAS - Product / Service
- SOPREMA SAS - Key offerings
- SWOT
- 14.18 TAMKO Building Products LLC
- TAMKO Building Products LLC - Overview
- TAMKO Building Products LLC - Product / Service
- TAMKO Building Products LLC - Key offerings
- SWOT
15 Appendix
- 15.1 Scope of the report
- 15.2 Inclusions and exclusions checklist
- Inclusions checklist
- Exclusions checklist
- 15.3 Currency conversion rates for US$
- Currency conversion rates for US$
- 15.4 Research methodology
- Research methodology
- 15.5 Data procurement
- Information sources
- 15.6 Data validation
- Data validation
- 15.7 Validation techniques employed for market sizing
- Validation techniques employed for market sizing
- 15.8 Data synthesis
- Data synthesis
- 15.9 360 degree market analysis
- 360 degree market analysis
- 15.10 List of abbreviations
- List of abbreviations

