|
|
市場調査レポート
商品コード
1915543
世界のテーブルリネン市場2025-2029年Global Table Linen Market 2025-2029 |
||||||
|
|||||||
カスタマイズ可能
|
|||||||

| 世界のテーブルリネン市場2025-2029年 |
|
出版日: 2026年01月19日
発行: TechNavio
ページ情報: 英文 290 Pages
納期: 即納可能
|

概要
世界のテーブルリネン市場は、2024年から2029年にかけて22億100万米ドルの成長が見込まれ、予測期間中のCAGRは3.8%と予測されています。
本報告書では、世界のテーブルリネン市場に関する包括的な分析、市場規模と予測、動向、成長要因、課題に加え、約25社のベンダー分析を提供しております。
本レポートは、現在の市場状況、最新の動向と促進要因、市場環境全般に関する最新の分析を提供します。市場は、世界のホスピタリティ業界の回復と体験型ダイニングの動向、メーカーと小売業者間の強固な流通ネットワーク、オンライン小売売上高の急成長によって牽引されています。
本調査は、業界の主要関係者からの情報をはじめとする一次情報と二次情報を客観的に組み合わせて実施されました。本レポートには、主要企業の分析に加え、包括的な市場規模データ、地域別分析を伴うセグメント、ベンダー情勢が含まれています。レポートには過去データと予測データが掲載されています。
| 市場範囲 | |
|---|---|
| 基準年 | 2025年 |
| 終了年 | 2029年 |
| 予測期間 | 2025-2029 |
| 成長モメンタム | 加速 |
| 前年比 | 3.6% |
| CAGR | 3.8% |
| 増分額 | 22億100万米ドル |
本調査では、今後数年間における世界のテーブルリネン市場成長を牽引する主要要因の一つとして、持続可能性と循環型経済の原則の統合が加速している点を挙げております。また、市場ベンダーによるオムニチャネル戦略の活用拡大や、新興市場における繊維産業振興に向けた政府主導の取り組みの増加が、市場における相当な需要創出につながると見込まれます。
目次
第1章 エグゼクティブサマリー
第2章 Technavio分析
- 価格・ライフサイクル・顧客購入バスケット・採用率・購入基準の分析
- インプットの重要性と差別化の要因
- 混乱の要因
- 促進要因と課題の影響
第3章 市場情勢
- 市場エコシステム
- 市場の特徴
- バリューチェーン分析
第4章 市場規模
- 市場の定義
- 市場セグメント分析
- 市場規模 2024
- 市場の見通し 2024-2029
第5章 市場規模実績
- 世界のテーブルリネン市場 2019-2023
- エンドユーザーセグメント分析 2019-2023
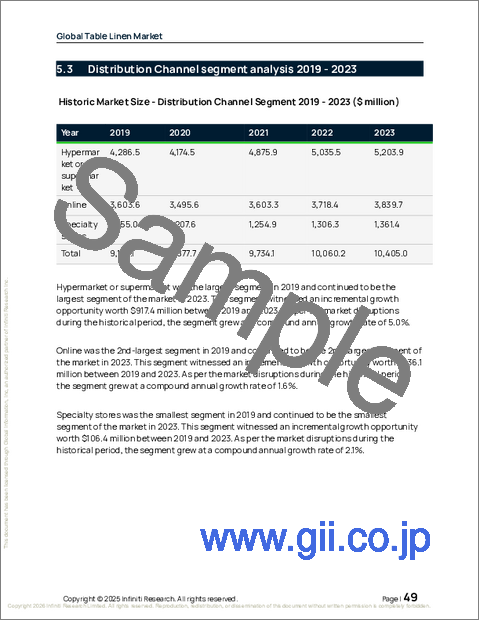
- 流通チャネルセグメント分析 2019-2023
- 製品タイプセグメント分析 2019-2023
- 地域別セグメント分析 2019-2023
- 国別セグメント分析 2019-2023
第6章 定性分析
- AIの影響:世界のテーブルリネン市場
第7章 ファイブフォース分析
- ファイブフォースの要約
- 買い手の交渉力
- 供給企業の交渉力
- 新規参入業者の脅威
- 代替品の脅威
- 競争の脅威
- 市況
第8章 市場セグメンテーション:エンドユーザー別
- 比較:エンドユーザー別
- 住宅用
- 商業用
- 市場機会:エンドユーザー別
第9章 市場セグメンテーション:流通チャネル別
- 比較:流通チャネル別
- ハイパーマーケットまたはスーパーマーケット
- オンライン
- 専門店
- 市場機会:流通チャネル別
第10章 市場セグメンテーション:製品タイプ別
- 比較:製品タイプ別
- テーブルクロス
- テーブルナプキン
- プレースマット
- その他
- 市場機会:製品タイプ別
第11章 顧客情勢
第12章 地域別情勢
- 地域別セグメンテーション
- 地域別比較
- 北米
- 米国
- カナダ
- メキシコ
- 欧州
- ドイツ
- 英国
- フランス
- イタリア
- スペイン
- オランダ
- アジア太平洋
- 中国
- 日本
- インド
- 韓国
- インドネシア
- オーストラリア
- 南米
- ブラジル
- アルゼンチン
- チリ
- 中東・アフリカ
- サウジアラビア
- アラブ首長国連邦
- 南アフリカ
- エジプト
- ナイジェリア
- 市場機会:地域別
第13章 促進要因・課題・機会
- 市場促進要因
- 市場の課題
- 促進要因と課題の影響
- 市場機会
第14章 競合情勢
- 概要
- 競合情勢
- 混乱の状況
- 業界のリスク
第15章 競合分析
- 企業プロファイル
- 企業ランキング指標
- 企業の市場ポジショニング
- AB Siulas
- Amoda Comfort Linen
- Balavigna Mills Pvt. Ltd.
- BBJ La Tavola
- Belinor Textile Ltd.
- Beltrami Linen Srl
- Dileep Essentials Pvt Ltd
- Fabrica Maria SA de CV
- Jomar Table Linens
- Natural Fabrics SL
- Once Milano SRL
- Prestige Linens
- Star Linen USA
- UAB Baltic Flax
- Volga Linen

