|
|
市場調査レポート
商品コード
1915415
世界の浮体式太陽光パネル市場2025-2029年Global Floating Solar Panels Market 2025-2029 |
||||||
|
|||||||
カスタマイズ可能
|
|||||||

| 世界の浮体式太陽光パネル市場2025-2029年 |
|
出版日: 2026年01月19日
発行: TechNavio
ページ情報: 英文 295 Pages
納期: 即納可能
|

概要
世界の浮体式太陽光パネル市場は、2024年から2029年の間に10億4,170万米ドル規模で成長し、予測期間中のCAGRは18.9%と予測されております。
本報告書では、世界の浮体式太陽光パネル市場に関する包括的な分析、市場規模と予測、動向、成長要因、課題に加え、約25社のベンダー分析を提供しております。
本レポートは、現在の市場状況、最新の動向と促進要因、市場環境全般に関する最新の分析を提供します。市場は、再生可能エネルギーへの需要増加と政府支援、土地不足と効率的な土地利用、技術進歩と効率向上によって牽引されています。
本調査は、業界の主要関係者からの情報をはじめとする一次情報と二次情報を客観的に組み合わせて実施されました。本レポートには、主要企業の分析に加え、包括的な市場規模データ、地域別分析を伴うセグメント、ベンダー情勢が含まれています。レポートには過去データと予測データが掲載されています。
| 市場範囲 | |
|---|---|
| 基準年 | 2025年 |
| 終了年 | 2029年 |
| 予測期間 | 2025-2029 |
| 成長モメンタム | 加速 |
| 前年比 | 16.2% |
| CAGR | 18.9% |
| 増分額 | 10億4,170万米ドル |
本調査では、今後数年間における世界の浮体式太陽光パネル市場の成長を牽引する主な要因の一つとして、大規模プロジェクトおよび洋上プロジェクトの増加を挙げております。また、システム構成部品や技術の革新の加速、その他の再生可能エネルギーとのハイブリッド化、多機能的な水利用などが、市場において相当な需要を生み出すと予測されます。
目次
第1章 エグゼクティブサマリー
第2章 Technavio分析
- 価格・ライフサイクル・顧客購入バスケット・採用率・購入基準の分析
- インプットの重要性と差別化の要因
- 混乱の要因
- 促進要因と課題の影響
第3章 市場情勢
- 市場エコシステム
- 市場の特徴
- バリューチェーン分析
第4章 市場規模
- 市場の定義
- 市場セグメント分析
- 市場規模 2024
- 市場の見通し 2024-2029
第5章 市場規模実績
- 世界の浮体式太陽光パネル市場 2019-2023
- 製品セグメント分析 2019-2023
- 技術セグメント分析 2019-2023
- 容量セグメント分析 2019-2023
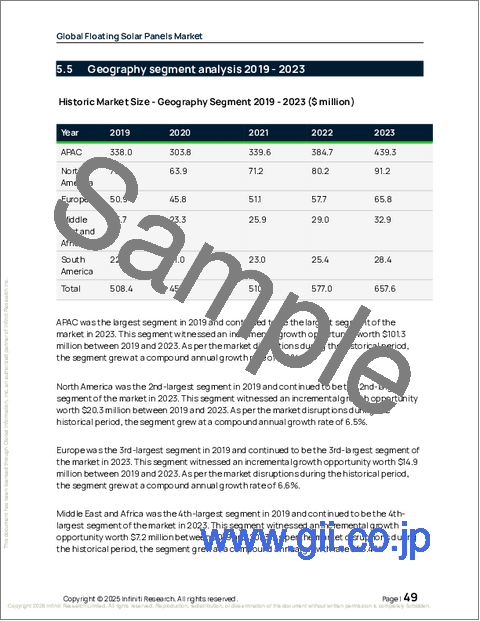
- 地域別セグメント分析 2019-2023
- 国別セグメント分析 2019-2023
第6章 定性分析
- AIの影響:世界の浮体式太陽光パネル市場
第7章 ファイブフォース分析
- ファイブフォースの要約
- 買い手の交渉力
- 供給企業の交渉力
- 新規参入業者の脅威
- 代替品の脅威
- 競争の脅威
- 市況
第8章 市場セグメンテーション:製品別
- 比較:製品別
- 文具
- 追跡
- 市場機会:製品別
第9章 市場セグメンテーション:技術別
- 比較:技術別
- PV
- CPV
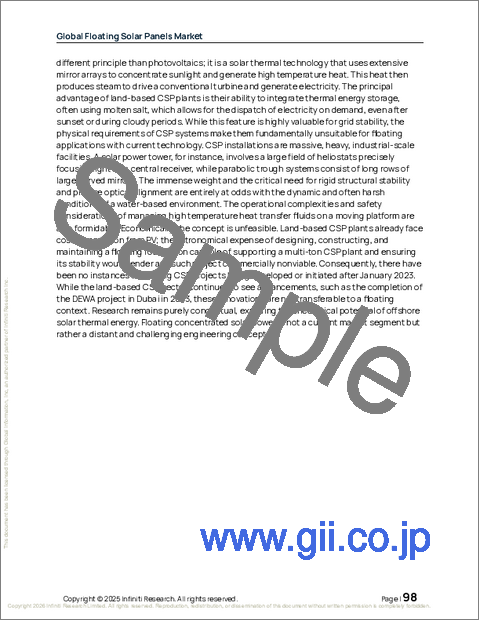
- CSP
- 市場機会:技術別
第10章 市場セグメンテーション:容量別
- 比較:容量別
- 5MW未満
- 5~50MW
- 50MW超
- 市場機会:容量別
第11章 顧客情勢
第12章 地域別情勢
- 地域別セグメンテーション
- 地域別比較
- アジア太平洋
- 中国
- インド
- 日本
- 韓国
- オーストラリア
- インドネシア
- 北米
- 米国
- カナダ
- メキシコ
- 欧州
- ドイツ
- スペイン
- フランス
- イタリア
- オランダ
- 英国
- 中東・アフリカ
- アラブ首長国連邦
- サウジアラビア
- エジプト
- 南アフリカ
- モロッコ
- 南米
- ブラジル
- チリ
- アルゼンチン
- 市場機会:地域別
第13章 促進要因・課題・機会
- 市場促進要因
- 市場の課題
- 促進要因と課題の影響
- 市場機会
第14章 競合情勢
- 概要
- 競合情勢
- 混乱の状況
- 業界のリスク
第15章 競合分析
- 企業プロファイル
- 企業ランキング指標
- 企業の市場ポジショニング
- Ciel and Terre International
- GCL System Integration Technology Co. Ltd.
- Hanwha Group
- JA Solar Technology Co. Ltd.
- JinkoSolar Holding Co. Ltd.
- KYOCERA Corp.
- LONGi Green Energy Technology Co. Ltd.
- Maxeon Solar Technologies Ltd.
- Ocean Sun AS
- Sharp Corp.
- Sungrow FPV SCI and TECH Co. Ltd.
- Swimsol GmbH
- Tata Power Co. Ltd.
- Trina Solar Co. Ltd.
- Vikram Solar Ltd.

