|
|
市場調査レポート
商品コード
1911041
一軸偏心ねじポンプの世界市場 2025-2029年Global Progressing Cavity Pump Market 2025-2029 |
||||||

|
|||||||
カスタマイズ可能
|
|||||||

| 一軸偏心ねじポンプの世界市場 2025-2029年 |
|
出版日: 2026年01月14日
発行: TechNavio
ページ情報: 英文 294 Pages
納期: 即納可能
|

概要
世界の一軸偏心ねじポンプ市場は、2024年から2029年にかけて22億8,750万米ドルの成長が見込まれ、予測期間中のCAGRは6.8%と予測されています。
本報告書では、世界の一軸偏心ねじポンプ市場に関する包括的な分析、市場規模と予測、動向、市場促進要因・課題に加え、約25社のベンダー分析を提供しております。
本レポートは、現在の市場状況、最新の動向と促進要因、市場環境全般に関する最新の分析を提供します。市場は、石油・ガス分野への投資の回復、高粘度流体の取り扱いへの適性、発展途上国におけるポンプ産業の成長によって牽引されています。
本調査は、業界の主要関係者からの情報を含む一次情報と二次情報を客観的に組み合わせて実施されました。本レポートには、主要企業の分析に加え、包括的な市場規模データ、地域別分析を伴うセグメント、ベンダー情勢が含まれています。レポートには過去データと予測データが掲載されています。
| 市場範囲 | |
|---|---|
| 基準年 | 2025年 |
| 終了年 | 2029年 |
| 予測期間 | 2025-2029 |
| 成長モメンタム | 加速 |
| 前年比 | 6.3% |
| CAGR | 6.8% |
| 増分額 | 22億8,750万米ドル |
本調査では、今後数年間における世界の一軸偏心ねじポンプ市場の成長を牽引する主要要因の一つとして、上下水道業界における進展を挙げております。また、ポンプの設計・修理・交換における先端技術や3Dプリント技術の進歩、ならびに石炭水スラリーの移送用途における製品の普及拡大が、市場における相当な需要創出につながると見込まれます。
目次
第1章 エグゼクティブサマリー
- 市場概要
第2章 Technavio分析
- 価格・ライフサイクル・顧客購入バスケット・採用率・購入基準の分析
- インプットの重要性と差別化の要因
- 混乱の要因
- 促進要因と課題の影響
第3章 市場情勢
- 市場エコシステム
- 市場の特徴
- バリューチェーン分析
第4章 市場規模
- 市場の定義
- 市場セグメント分析
- 市場規模 2024
- 市場の見通し 2024-2029
第5章 市場規模実績
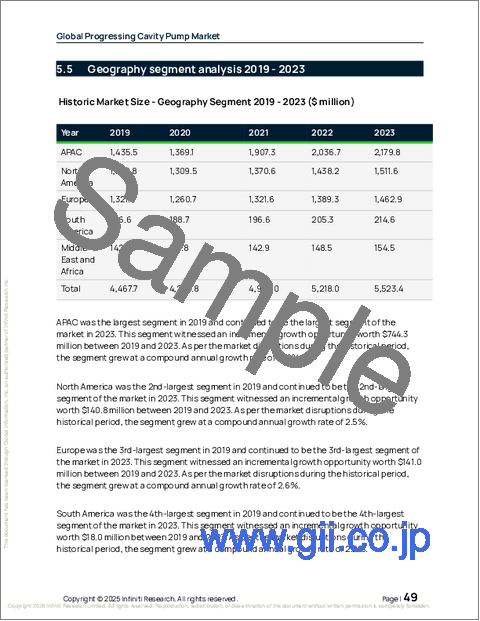
- 世界の一軸偏心ねじポンプ市場 2019-2023
- エンドユーザーセグメント分析 2019-2023
- 定格出力セグメント分析 2019-2023
- 容量セグメント分析 2019-2023
- 地域別セグメント分析 2019-2023
- 国別セグメント分析 2019-2023
第6章 定性分析
- AIの影響:世界の一軸偏心ねじポンプ市場
第7章 ファイブフォース分析
- ファイブフォースの要約
- 買い手の交渉力
- 供給企業の交渉力
- 新規参入業者の脅威
- 代替品の脅威
- 競争の脅威
- 市況
第8章 市場セグメンテーション:エンドユーザー別
- 市場セグメント
- 比較:エンドユーザー別
- 石油・ガス:市場規模と予測 2024-2029
- 水・廃水処理:市場規模と予測 2024-2029
- 化学・石油化学:市場規模と予測 2024-2029
- 食品・飲料:市場規模と予測 2024-2029
- その他:市場規模と予測 2024-2029
- 市場機会:エンドユーザー別
第9章 市場セグメンテーション:出力定格別
- 市場セグメント
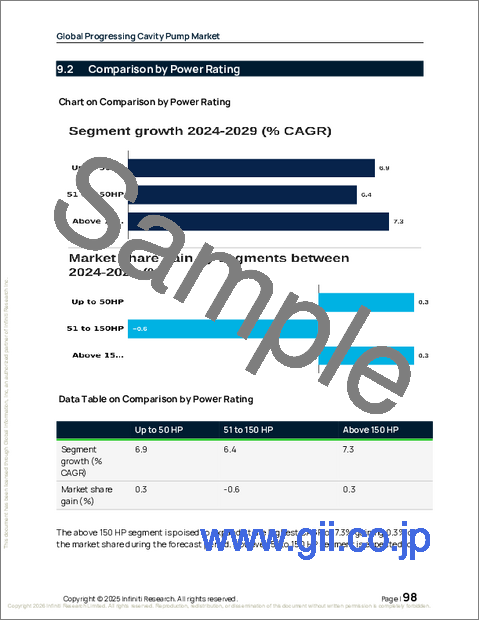
- 比較:出力定格別
- 50馬力以下:市場規模と予測 2024-2029
- 51~150馬力:市場規模と予測 2024-2029
- 150馬力超:市場規模と予測 2024-2029
- 市場機会:出力定格別
第10章 市場セグメンテーション:容量別
- 市場セグメント
- 比較:容量別
- 500 GPM以下:市場規模と予測 2024-2029
- 501~1000 GPM:市場規模と予測 2024-2029
- 1000 GPM超:市場規模と予測 2024-2029
- 市場機会:容量別
第11章 顧客情勢
- 顧客情勢の概要
第12章 地域別情勢
- 地域別セグメンテーション
- 地域別比較
- アジア太平洋:市場規模と予測 2024-2029
- 北米:市場規模と予測 2024-2029
- 欧州:市場規模と予測 2024-2029
- 南米:市場規模と予測 2024-2029
- 中東・アフリカ:市場規模と予測 2024-2029
- 市場機会:地域別
第13章 促進要因、課題、および機会
- 市場促進要因
- 市場の課題
- 促進要因と課題の影響
- 市場機会
第14章 競合情勢
- 概要
- 競合情勢
- 混乱の状況
- 業界のリスク
第15章 競合分析
- 企業プロファイル
- 企業ランキング指標
- 企業の市場ポジショニング
- Borets International Ltd.
- CIRCOR International
- Erich NETZSCH BV and Co. Holding KG
- Flexachem
- ITT Bornemann
- ITT Inc.
- NOV Inc.
- Nova Rotors Srl
- PCM Artificial Lift Solutions Inc.
- Pump and Valve Specialties
- Roper Technologies Inc.
- Roto Pumps Ltd.
- SEEPEX GmbH
- Sulzer Ltd.
- Xylem Inc.
