|
|
市場調査レポート
商品コード
1604119
遊離アミノ酸の世界市場 2024年~2028年Global Free Amino Acid Market 2024-2028 |
||||||

|
|||||||
カスタマイズ可能
|
|||||||


| 遊離アミノ酸の世界市場 2024年~2028年 |
|
出版日: 2024年09月20日
発行: TechNavio
ページ情報: 英文 215 Pages
納期: 即納可能
|

全表示
- 概要
- 図表
- 目次
遊離アミノ酸市場2024-2028
遊離アミノ酸市場は2023年~2028年年に12億6,260万米ドル、予測期間中のCAGRは6.9%で成長すると予測されます。当レポートでは、遊離アミノ酸市場の全体的な分析、市場規模・予測、動向、成長促進要因、課題、約25のベンダーを網羅したベンダー分析などを掲載しています。
現在の市場シナリオ、最新動向と促進要因、市場環境全体に関する最新分析を提供しています。市場は、人々の健康志向の高まり、ベンダーによる生産設備拡張への投資の増大、植物ベースおよびビーガン食の人気の高まりによって牽引されています。
| 市場範囲 | |
|---|---|
| 基準年 | 2024 |
| 終了年 | 2028 |
| 予測期間 | 2024-2028 |
| 成長モメンタム | 加速 |
| 前年比2024年 | 6.8% |
| CAGR | 6.9% |
| 増分額 | 12億6,260万米ドル |
本調査では、今後数年間における遊離アミノ酸市場の成長を促進する主な要因の1つとして、ベンダーが新製品の上市に注力するようになっていることを挙げています。また、人間の健康におけるアミノ酸の重要な役割についての認識を高めるためのベンダーによる教育キャンペーンへの注力や、遊離アミノ酸に関するベンダーによる研究試験の増加が、市場の大きな需要につながると思われます。
目次
第1章 エグゼクティブサマリー
- 市場概要
第2章 Technavio別分析
- 価格・ライフサイクル・顧客購入バスケット・採用率・購入基準の分析
- インプットの重要性と差別化の要因
- 混乱の要因
- 促進要因と課題の影響
第3章 市場情勢
- 市場エコシステム
- 市場の特徴
- バリューチェーン分析
第4章 市場規模
- 市場の定義
- 市場セグメント分析
- 市場規模 2023年
- 市場の見通し 2023年~2028年
第5章 市場規模実績
- 遊離アミノ酸の世界市場 2018年~2022年
- タイプ別セグメント分析 2018年~2022年
- 用途別セグメント分析 2018年~2022年
- 地域別セグメント分析 2018年~2022年
- 国別セグメント分析 2018年~2022年
第6章 定性分析
- AIの影響遊離アミノ酸の世界市場
第7章 ファイブフォース分析
- ファイブフォースの要約
- 買い手の交渉力
- 供給企業の交渉力
- 新規参入業者の脅威
- 代替品の脅威
- 競争の脅威
- 市況
第8章 市場セグメンテーション:タイプ別
- 市場セグメント
- 比較:タイプ別
- 非必須アミノ酸:市場規模と予測 2023年~2028年
- 必須アミノ酸:市場規模と予測 2023年~2028年
- 市場機会:タイプ別
第9章 市場セグメンテーション:用途別
- 市場セグメント
- 比較:用途別
- 動物飼料:市場規模と予測 2023年~2028年
- ヘルスケア:市場規模と予測 2023年~2028年
- 飲食品:市場規模と予測 2023年~2028年
- その他:市場規模と予測 2023年~2028年
- 市場機会:用途別
第10章 顧客情勢
- 顧客情勢の概要
第11章 地域別情勢
- 地域別セグメンテーション
- 地域別比較
- アジア太平洋:市場規模と予測 2023年~2028年
- 北米:市場規模と予測 2023年~2028年
- 欧州:市場規模と予測 2023年~2028年
- 南米:市場規模と予測 2023年~2028年
- 中東・アフリカ:市場規模と予測 2023年~2028年
- 米国:市場規模と予測 2023年~2028年
- 中国:市場規模と予測 2023年~2028年
- 日本:市場規模と予測 2023年~2028年
- 韓国:市場規模と予測 2023年~2028年
- ドイツ:市場規模と予測 2023年~2028年
- インド:市場規模と予測 2023年~2028年
- カナダ:市場規模と予測 2023年~2028年
- フランス:市場規模と予測 2023年~2028年
- ブラジル:市場規模と予測 2023年~2028年
- オーストラリア:市場規模と予測 2023年~2028年
- 市場機会:地域情勢別
第12章 促進要因・課題・機会・抑制要因
- 市場促進要因
- 市場の課題
- 促進要因と課題の影響
- 市場の機会・抑制要因
第13章 競合情勢
- 概要
- 競合情勢
- 混乱の状況
- 業界のリスク
第14章 競合分析
- 企業プロファイル
- 企業ランキング指数
- 企業の市場ポジショニング
- Adisseo Co.
- Ajinomoto Co. Inc.
- Amino GmbH
- Archer Daniels Midland Co.
- Cargill Inc.
- CJ CheilJedang Corp.
- Daesang Corp.
- Evonik Industries AG
- Glanbia plc
- Global Bio chem Technology Group Co. Ltd.
- Kyowa Hakko Bio Co. Ltd.
- Pacific Rainbow International Inc.
- Sichuan Tongsheng Amino acid Co. Ltd
- Sumitomo Chemical Co. Ltd.
- Wacker Chemie AG
第15章 付録
Exhibits:
- Exhibits1: Executive Summary - Chart on Market Overview
- Exhibits2: Executive Summary - Data Table on Market Overview
- Exhibits3: Executive Summary - Chart on Global Market Characteristics
- Exhibits4: Executive Summary - Chart on Market By Geographical Landscape
- Exhibits5: Executive Summary - Chart on Market Segmentation by Type
- Exhibits6: Executive Summary - Chart on Market Segmentation by Application
- Exhibits7: Executive Summary - Chart on Incremental Growth
- Exhibits8: Executive Summary - Data Table on Incremental Growth
- Exhibits9: Executive Summary - Chart on Company Market Positioning
- Exhibits10: Analysis of price sensitivity, lifecycle, customer purchase basket, adoption rates, and purchase criteria
- Exhibits11: Overview on criticality of inputs and factors of differentiation
- Exhibits12: Overview on factors of disruption
- Exhibits13: Impact of drivers and challenges in 2023 and 2028
- Exhibits14: Parent Market
- Exhibits15: Data Table on - Parent Market
- Exhibits16: Market characteristics analysis
- Exhibits17: Value Chain Analysis
- Exhibits18: Offerings of companies included in the market definition
- Exhibits19: Market segments
- Exhibits20: Chart on Global - Market size and forecast 2023-2028 ($ million)
- Exhibits21: Data Table on Global - Market size and forecast 2023-2028 ($ million)
- Exhibits22: Chart on Global Market: Year-over-year growth 2023-2028 (%)
- Exhibits23: Data Table on Global Market: Year-over-year growth 2023-2028 (%)
- Exhibits24: Historic Market Size - Data Table on Global Free Amino Acid Market 2018 - 2022 ($ million)
- Exhibits25: Historic Market Size - Type Segment 2018 - 2022 ($ million)
- Exhibits26: Historic Market Size - Application Segment 2018 - 2022 ($ million)
- Exhibits27: Historic Market Size - Geography Segment 2018 - 2022 ($ million)
- Exhibits28: Historic Market Size - Country Segment 2018 - 2022 ($ million)
- Exhibits29: Five forces analysis - Comparison between 2023 and 2028
- Exhibits30: Bargaining power of buyers - Impact of key factors 2023 and 2028
- Exhibits31: Bargaining power of suppliers - Impact of key factors in 2023 and 2028
- Exhibits32: Threat of new entrants - Impact of key factors in 2023 and 2028
- Exhibits33: Threat of substitutes - Impact of key factors in 2023 and 2028
- Exhibits34: Threat of rivalry - Impact of key factors in 2023 and 2028
- Exhibits35: Chart on Market condition - Five forces 2023 and 2028
- Exhibits36: Chart on Type - Market share 2023-2028 (%)
- Exhibits37: Data Table on Type - Market share 2023-2028 (%)
- Exhibits38: Chart on Comparison by Type
- Exhibits39: Data Table on Comparison by Type
- Exhibits40: Chart on Non-essential amino acids - Market size and forecast 2023-2028 ($ million)
- Exhibits41: Data Table on Non-essential amino acids - Market size and forecast 2023-2028 ($ million)
- Exhibits42: Chart on Non-essential amino acids - Year-over-year growth 2023-2028 (%)
- Exhibits43: Data Table on Non-essential amino acids - Year-over-year growth 2023-2028 (%)
- Exhibits44: Chart on Essential amino acids - Market size and forecast 2023-2028 ($ million)
- Exhibits45: Data Table on Essential amino acids - Market size and forecast 2023-2028 ($ million)
- Exhibits46: Chart on Essential amino acids - Year-over-year growth 2023-2028 (%)
- Exhibits47: Data Table on Essential amino acids - Year-over-year growth 2023-2028 (%)
- Exhibits48: Market opportunity by Type ($ million)
- Exhibits49: Data Table on Market opportunity by Type ($ million)
- Exhibits50: Chart on Application - Market share 2023-2028 (%)
- Exhibits51: Data Table on Application - Market share 2023-2028 (%)
- Exhibits52: Chart on Comparison by Application
- Exhibits53: Data Table on Comparison by Application
- Exhibits54: Chart on Animal feed - Market size and forecast 2023-2028 ($ million)
- Exhibits55: Data Table on Animal feed - Market size and forecast 2023-2028 ($ million)
- Exhibits56: Chart on Animal feed - Year-over-year growth 2023-2028 (%)
- Exhibits57: Data Table on Animal feed - Year-over-year growth 2023-2028 (%)
- Exhibits58: Chart on Healthcare - Market size and forecast 2023-2028 ($ million)
- Exhibits59: Data Table on Healthcare - Market size and forecast 2023-2028 ($ million)
- Exhibits60: Chart on Healthcare - Year-over-year growth 2023-2028 (%)
- Exhibits61: Data Table on Healthcare - Year-over-year growth 2023-2028 (%)
- Exhibits62: Chart on Food and beverages - Market size and forecast 2023-2028 ($ million)
- Exhibits63: Data Table on Food and beverages - Market size and forecast 2023-2028 ($ million)
- Exhibits64: Chart on Food and beverages - Year-over-year growth 2023-2028 (%)
- Exhibits65: Data Table on Food and beverages - Year-over-year growth 2023-2028 (%)
- Exhibits66: Chart on Others - Market size and forecast 2023-2028 ($ million)
- Exhibits67: Data Table on Others - Market size and forecast 2023-2028 ($ million)
- Exhibits68: Chart on Others - Year-over-year growth 2023-2028 (%)
- Exhibits69: Data Table on Others - Year-over-year growth 2023-2028 (%)
- Exhibits70: Market opportunity by Application ($ million)
- Exhibits71: Data Table on Market opportunity by Application ($ million)
- Exhibits72: Analysis of price sensitivity, lifecycle, customer purchase basket, adoption rates, and purchase criteria
- Exhibits73: Chart on Market share By Geographical Landscape 2023-2028 (%)
- Exhibits74: Data Table on Market share By Geographical Landscape 2023-2028 (%)
- Exhibits75: Chart on Geographic comparison
- Exhibits76: Data Table on Geographic comparison
- Exhibits77: Chart on APAC - Market size and forecast 2023-2028 ($ million)
- Exhibits78: Data Table on APAC - Market size and forecast 2023-2028 ($ million)
- Exhibits79: Chart on APAC - Year-over-year growth 2023-2028 (%)
- Exhibits80: Data Table on APAC - Year-over-year growth 2023-2028 (%)
- Exhibits81: Chart on North America - Market size and forecast 2023-2028 ($ million)
- Exhibits82: Data Table on North America - Market size and forecast 2023-2028 ($ million)
- Exhibits83: Chart on North America - Year-over-year growth 2023-2028 (%)
- Exhibits84: Data Table on North America - Year-over-year growth 2023-2028 (%)
- Exhibits85: Chart on Europe - Market size and forecast 2023-2028 ($ million)
- Exhibits86: Data Table on Europe - Market size and forecast 2023-2028 ($ million)
- Exhibits87: Chart on Europe - Year-over-year growth 2023-2028 (%)
- Exhibits88: Data Table on Europe - Year-over-year growth 2023-2028 (%)
- Exhibits89: Chart on South America - Market size and forecast 2023-2028 ($ million)
- Exhibits90: Data Table on South America - Market size and forecast 2023-2028 ($ million)
- Exhibits91: Chart on South America - Year-over-year growth 2023-2028 (%)
- Exhibits92: Data Table on South America - Year-over-year growth 2023-2028 (%)
- Exhibits93: Chart on Middle East and Africa - Market size and forecast 2023-2028 ($ million)
- Exhibits94: Data Table on Middle East and Africa - Market size and forecast 2023-2028 ($ million)
- Exhibits95: Chart on Middle East and Africa - Year-over-year growth 2023-2028 (%)
- Exhibits96: Data Table on Middle East and Africa - Year-over-year growth 2023-2028 (%)
- Exhibits97: Chart on US - Market size and forecast 2023-2028 ($ million)
- Exhibits98: Data Table on US - Market size and forecast 2023-2028 ($ million)
- Exhibits99: Chart on US - Year-over-year growth 2023-2028 (%)
- Exhibits100: Data Table on US - Year-over-year growth 2023-2028 (%)
- Exhibits101: Chart on China - Market size and forecast 2023-2028 ($ million)
- Exhibits102: Data Table on China - Market size and forecast 2023-2028 ($ million)
- Exhibits103: Chart on China - Year-over-year growth 2023-2028 (%)
- Exhibits104: Data Table on China - Year-over-year growth 2023-2028 (%)
- Exhibits105: Chart on Japan - Market size and forecast 2023-2028 ($ million)
- Exhibits106: Data Table on Japan - Market size and forecast 2023-2028 ($ million)
- Exhibits107: Chart on Japan - Year-over-year growth 2023-2028 (%)
- Exhibits108: Data Table on Japan - Year-over-year growth 2023-2028 (%)
- Exhibits109: Chart on South Korea - Market size and forecast 2023-2028 ($ million)
- Exhibits110: Data Table on South Korea - Market size and forecast 2023-2028 ($ million)
- Exhibits111: Chart on South Korea - Year-over-year growth 2023-2028 (%)
- Exhibits112: Data Table on South Korea - Year-over-year growth 2023-2028 (%)
- Exhibits113: Chart on Germany - Market size and forecast 2023-2028 ($ million)
- Exhibits114: Data Table on Germany - Market size and forecast 2023-2028 ($ million)
- Exhibits115: Chart on Germany - Year-over-year growth 2023-2028 (%)
- Exhibits116: Data Table on Germany - Year-over-year growth 2023-2028 (%)
- Exhibits117: Chart on India - Market size and forecast 2023-2028 ($ million)
- Exhibits118: Data Table on India - Market size and forecast 2023-2028 ($ million)
- Exhibits119: Chart on India - Year-over-year growth 2023-2028 (%)
- Exhibits120: Data Table on India - Year-over-year growth 2023-2028 (%)
- Exhibits121: Chart on Canada - Market size and forecast 2023-2028 ($ million)
- Exhibits122: Data Table on Canada - Market size and forecast 2023-2028 ($ million)
- Exhibits123: Chart on Canada - Year-over-year growth 2023-2028 (%)
- Exhibits124: Data Table on Canada - Year-over-year growth 2023-2028 (%)
- Exhibits125: Chart on France - Market size and forecast 2023-2028 ($ million)
- Exhibits126: Data Table on France - Market size and forecast 2023-2028 ($ million)
- Exhibits127: Chart on France - Year-over-year growth 2023-2028 (%)
- Exhibits128: Data Table on France - Year-over-year growth 2023-2028 (%)
- Exhibits129: Chart on Brazil - Market size and forecast 2023-2028 ($ million)
- Exhibits130: Data Table on Brazil - Market size and forecast 2023-2028 ($ million)
- Exhibits131: Chart on Brazil - Year-over-year growth 2023-2028 (%)
- Exhibits132: Data Table on Brazil - Year-over-year growth 2023-2028 (%)
- Exhibits133: Chart on Australia - Market size and forecast 2023-2028 ($ million)
- Exhibits134: Data Table on Australia - Market size and forecast 2023-2028 ($ million)
- Exhibits135: Chart on Australia - Year-over-year growth 2023-2028 (%)
- Exhibits136: Data Table on Australia - Year-over-year growth 2023-2028 (%)
- Exhibits137: Market opportunity By Geographical Landscape ($ million)
- Exhibits138: Data Tables on Market opportunity By Geographical Landscape ($ million)
- Exhibits139: Impact of drivers and challenges in 2023 and 2028
- Exhibits140: Overview on criticality of inputs and factors of differentiation
- Exhibits141: Overview on factors of disruption
- Exhibits142: Impact of key risks on business
- Exhibits143: Companies covered
- Exhibits144: Company ranking index
- Exhibits145: Matrix on companies position and classification
- Exhibits146: Adisseo Co. - Overview
- Exhibits147: Adisseo Co. - Product / Service
- Exhibits148: Adisseo Co. - Key news
- Exhibits149: Adisseo Co. - Key offerings
- Exhibits150: SWOT
- Exhibits151: Ajinomoto Co. Inc. - Overview
- Exhibits152: Ajinomoto Co. Inc. - Business segments
- Exhibits153: Ajinomoto Co. Inc. - Key news
- Exhibits154: Ajinomoto Co. Inc. - Key offerings
- Exhibits155: Ajinomoto Co. Inc. - Segment focus
- Exhibits156: SWOT
- Exhibits157: Amino GmbH - Overview
- Exhibits158: Amino GmbH - Product / Service
- Exhibits159: Amino GmbH - Key offerings
- Exhibits160: SWOT
- Exhibits161: Archer Daniels Midland Co. - Overview
- Exhibits162: Archer Daniels Midland Co. - Business segments
- Exhibits163: Archer Daniels Midland Co. - Key news
- Exhibits164: Archer Daniels Midland Co. - Key offerings
- Exhibits165: Archer Daniels Midland Co. - Segment focus
- Exhibits166: SWOT
- Exhibits167: Cargill Inc. - Overview
- Exhibits168: Cargill Inc. - Product / Service
- Exhibits169: Cargill Inc. - Key offerings
- Exhibits170: SWOT
- Exhibits171: CJ CheilJedang Corp. - Overview
- Exhibits172: CJ CheilJedang Corp. - Business segments
- Exhibits173: CJ CheilJedang Corp. - Key news
- Exhibits174: CJ CheilJedang Corp. - Key offerings
- Exhibits175: CJ CheilJedang Corp. - Segment focus
- Exhibits176: SWOT
- Exhibits177: Daesang Corp. - Overview
- Exhibits178: Daesang Corp. - Business segments
- Exhibits179: Daesang Corp. - Key offerings
- Exhibits180: Daesang Corp. - Segment focus
- Exhibits181: SWOT
- Exhibits182: Evonik Industries AG - Overview
- Exhibits183: Evonik Industries AG - Business segments
- Exhibits184: Evonik Industries AG - Key news
- Exhibits185: Evonik Industries AG - Key offerings
- Exhibits186: Evonik Industries AG - Segment focus
- Exhibits187: SWOT
- Exhibits188: Glanbia plc - Overview
- Exhibits189: Glanbia plc - Business segments
- Exhibits190: Glanbia plc - Key news
- Exhibits191: Glanbia plc - Key offerings
- Exhibits192: Glanbia plc - Segment focus
- Exhibits193: SWOT
- Exhibits194: Global Bio chem Technology Group Co. Ltd. - Overview
- Exhibits195: Global Bio chem Technology Group Co. Ltd. - Business segments
- Exhibits196: Global Bio chem Technology Group Co. Ltd. - Key offerings
- Exhibits197: Global Bio chem Technology Group Co. Ltd. - Segment focus
- Exhibits198: SWOT
- Exhibits199: Kyowa Hakko Bio Co. Ltd. - Overview
- Exhibits200: Kyowa Hakko Bio Co. Ltd. - Product / Service
- Exhibits201: Kyowa Hakko Bio Co. Ltd. - Key offerings
- Exhibits202: SWOT
- Exhibits203: Pacific Rainbow International Inc. - Overview
- Exhibits204: Pacific Rainbow International Inc. - Product / Service
- Exhibits205: Pacific Rainbow International Inc. - Key offerings
- Exhibits206: SWOT
- Exhibits207: Sichuan Tongsheng Amino acid Co. Ltd - Overview
- Exhibits208: Sichuan Tongsheng Amino acid Co. Ltd - Product / Service
- Exhibits209: Sichuan Tongsheng Amino acid Co. Ltd - Key offerings
- Exhibits210: SWOT
- Exhibits211: Sumitomo Chemical Co. Ltd. - Overview
- Exhibits212: Sumitomo Chemical Co. Ltd. - Business segments
- Exhibits213: Sumitomo Chemical Co. Ltd. - Key offerings
- Exhibits214: Sumitomo Chemical Co. Ltd. - Segment focus
- Exhibits215: SWOT
- Exhibits216: Wacker Chemie AG - Overview
- Exhibits217: Wacker Chemie AG - Business segments
- Exhibits218: Wacker Chemie AG - Key news
- Exhibits219: Wacker Chemie AG - Key offerings
- Exhibits220: Wacker Chemie AG - Segment focus
- Exhibits221: SWOT
- Exhibits222: Inclusions checklist
- Exhibits223: Exclusions checklist
- Exhibits224: Currency conversion rates for US$
- Exhibits225: Research methodology
- Exhibits226: Information sources
- Exhibits227: Data validation
- Exhibits228: Validation techniques employed for market sizing
- Exhibits229: Data synthesis
- Exhibits230: 360 degree market analysis
- Exhibits231: List of abbreviations
Free Amino Acid Market 2024-2028
The free amino acid market is forecasted to grow by USD 1262.6 mn during 2023-2028, accelerating at a CAGR of 6.9% during the forecast period. The report on the free amino acid market provides a holistic analysis, market size and forecast, trends, growth drivers, and challenges, as well as vendor analysis covering around 25 vendors.
The report offers an up-to-date analysis regarding the current market scenario, the latest trends and drivers, and the overall market environment. The market is driven by increasing health consciousness among people, augmenting investments by vendors in expanding production facilities, and rising popularity of plant-based and vegan diets.
| Market Scope | |
|---|---|
| Base Year | 2024 |
| End Year | 2028 |
| Series Year | 2024-2028 |
| Growth Momentum | Accelerate |
| YOY 2024 | 6.8% |
| CAGR | 6.9% |
| Incremental Value | $1262.6 mn |
Technavio's free amino acid market is segmented as below:
By Type
- Non-essential amino acids
- Essential amino acids
By Application
- Animal feed
- Healthcare
- Food and beverages
- Others
By Geographical Landscape
- APAC
- North America
- Europe
- South America
- Middle East and Africa
This study identifies the increasing focus of vendors on new product launches as one of the prime reasons driving the free amino acid market growth during the next few years. Also, focus on educational campaigns by vendors to raise awareness about vital role of amino acids in human health and growing number of research trials by vendors for free amino acids will lead to sizable demand in the market.
The report on the free amino acid market covers the following areas:
- Free Amino Acid Market sizing
- Free Amino Acid Market forecast
- Free Amino Acid Market industry analysis
The robust vendor analysis is designed to help clients improve their market position, and in line with this, this report provides a detailed analysis of several leading free amino acid market vendors that include Adisseo Co., Ajinomoto Co. Inc., Amino GmbH, Archer Daniels Midland Co., Blue Star Corp, Cargill Inc., CJ CheilJedang Corp., Daesang Corp., Evonik Industries AG, Fermentis Life Sciences Pvt. Ltd., Glanbia plc, Global Bio chem Technology Group Co. Ltd., Iris Biotech GmbH, Kyowa Hakko Bio Co. Ltd., Pacific Rainbow International Inc., Sichuan Tongsheng Amino acid Co. Ltd, Sigma Aldrich Chemicals Pvt Ltd, Sumitomo Chemical Co. Ltd., The Taiwan Amino Acids Co. Ltd., and Wacker Chemie AG. Also, the free amino acid market analysis report includes information on upcoming trends and challenges that will influence market growth. This is to help companies strategize and leverage all forthcoming growth opportunities.
The study was conducted using an objective combination of primary and secondary information including inputs from key participants in the industry. The report contains a comprehensive market and vendor landscape in addition to an analysis of the key vendors.
The publisher presents a detailed picture of the market by the way of study, synthesis, and summation of data from multiple sources by an analysis of key parameters such as profit, pricing, competition, and promotions. It presents various market facets by identifying the key industry influencers. The data presented is comprehensive, reliable, and a result of extensive primary and secondary research. The market research reports provide a complete competitive landscape and an in-depth vendor selection methodology and analysis using qualitative and quantitative research to forecast accurate market growth.
Table of Contents
1 Executive Summary
- 1.1 Market overview
- Executive Summary - Chart on Market Overview
- Executive Summary - Data Table on Market Overview
- Executive Summary - Chart on Global Market Characteristics
- Executive Summary - Chart on Market By Geographical Landscape
- Executive Summary - Chart on Market Segmentation by Type
- Executive Summary - Chart on Market Segmentation by Application
- Executive Summary - Chart on Incremental Growth
- Executive Summary - Data Table on Incremental Growth
- Executive Summary - Chart on Company Market Positioning
2 Technavio Analysis
- 2.1 Analysis of price sensitivity, lifecycle, customer purchase basket, adoption rates, and purchase criteria
- Analysis of price sensitivity, lifecycle, customer purchase basket, adoption rates, and purchase criteria
- 2.2 Criticality of inputs and Factors of differentiation
- Overview on criticality of inputs and factors of differentiation
- 2.3 Factors of disruption
- Overview on factors of disruption
- 2.4 Impact of drivers and challenges
- Impact of drivers and challenges in 2023 and 2028
3 Market Landscape
- 3.1 Market ecosystem
- Parent Market
- Data Table on - Parent Market
- 3.2 Market characteristics
- Market characteristics analysis
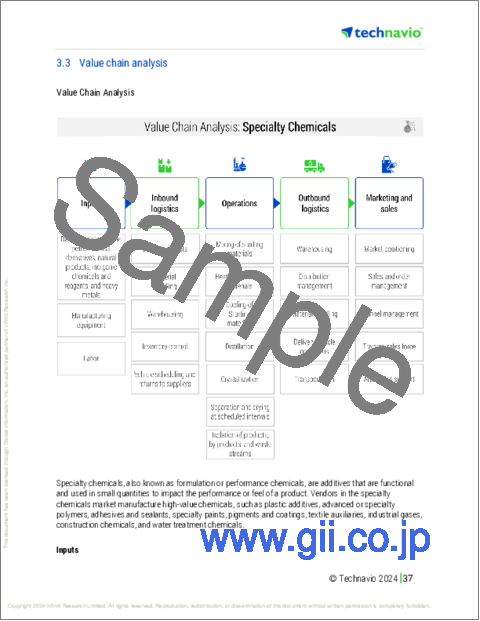
- 3.3 Value chain analysis
- Value Chain Analysis
4 Market Sizing
- 4.1 Market definition
- Offerings of companies included in the market definition
- 4.2 Market segment analysis
- Market segments
- 4.3 Market size 2023
- 4.4 Market outlook: Forecast for 2023-2028
- Chart on Global - Market size and forecast 2023-2028 ($ million)
- Data Table on Global - Market size and forecast 2023-2028 ($ million)
- Chart on Global Market: Year-over-year growth 2023-2028 (%)
- Data Table on Global Market: Year-over-year growth 2023-2028 (%)
5 Historic Market Size
- 5.1 Global Free Amino Acid Market 2018 - 2022
- Historic Market Size - Data Table on Global Free Amino Acid Market 2018 - 2022 ($ million)
- 5.2 Type segment analysis 2018 - 2022
- Historic Market Size - Type Segment 2018 - 2022 ($ million)
- 5.3 Application segment analysis 2018 - 2022
- Historic Market Size - Application Segment 2018 - 2022 ($ million)
- 5.4 Geography segment analysis 2018 - 2022
- Historic Market Size - Geography Segment 2018 - 2022 ($ million)
- 5.5 Country segment analysis 2018 - 2022
- Historic Market Size - Country Segment 2018 - 2022 ($ million)
6 Qualitative Analysis
- 6.1 Impact of AI in the Global Free Amino Acid Market
7 Five Forces Analysis
- 7.1 Five forces summary
- Five forces analysis - Comparison between 2023 and 2028
- 7.2 Bargaining power of buyers
- Bargaining power of buyers - Impact of key factors 2023 and 2028
- 7.3 Bargaining power of suppliers
- Bargaining power of suppliers - Impact of key factors in 2023 and 2028
- 7.4 Threat of new entrants
- Threat of new entrants - Impact of key factors in 2023 and 2028
- 7.5 Threat of substitutes
- Threat of substitutes - Impact of key factors in 2023 and 2028
- 7.6 Threat of rivalry
- Threat of rivalry - Impact of key factors in 2023 and 2028
- 7.7 Market condition
- Chart on Market condition - Five forces 2023 and 2028
8 Market Segmentation by Type
- 8.1 Market segments
- Chart on Type - Market share 2023-2028 (%)
- Data Table on Type - Market share 2023-2028 (%)
- 8.2 Comparison by Type
- Chart on Comparison by Type
- Data Table on Comparison by Type
- 8.3 Non-essential amino acids - Market size and forecast 2023-2028
- Chart on Non-essential amino acids - Market size and forecast 2023-2028 ($ million)
- Data Table on Non-essential amino acids - Market size and forecast 2023-2028 ($ million)
- Chart on Non-essential amino acids - Year-over-year growth 2023-2028 (%)
- Data Table on Non-essential amino acids - Year-over-year growth 2023-2028 (%)
- 8.4 Essential amino acids - Market size and forecast 2023-2028
- Chart on Essential amino acids - Market size and forecast 2023-2028 ($ million)
- Data Table on Essential amino acids - Market size and forecast 2023-2028 ($ million)
- Chart on Essential amino acids - Year-over-year growth 2023-2028 (%)
- Data Table on Essential amino acids - Year-over-year growth 2023-2028 (%)
- 8.5 Market opportunity by Type
- Market opportunity by Type ($ million)
- Data Table on Market opportunity by Type ($ million)
9 Market Segmentation by Application
- 9.1 Market segments
- Chart on Application - Market share 2023-2028 (%)
- Data Table on Application - Market share 2023-2028 (%)
- 9.2 Comparison by Application
- Chart on Comparison by Application
- Data Table on Comparison by Application
- 9.3 Animal feed - Market size and forecast 2023-2028
- Chart on Animal feed - Market size and forecast 2023-2028 ($ million)
- Data Table on Animal feed - Market size and forecast 2023-2028 ($ million)
- Chart on Animal feed - Year-over-year growth 2023-2028 (%)
- Data Table on Animal feed - Year-over-year growth 2023-2028 (%)
- 9.4 Healthcare - Market size and forecast 2023-2028
- Chart on Healthcare - Market size and forecast 2023-2028 ($ million)
- Data Table on Healthcare - Market size and forecast 2023-2028 ($ million)
- Chart on Healthcare - Year-over-year growth 2023-2028 (%)
- Data Table on Healthcare - Year-over-year growth 2023-2028 (%)
- 9.5 Food and beverages - Market size and forecast 2023-2028
- Chart on Food and beverages - Market size and forecast 2023-2028 ($ million)
- Data Table on Food and beverages - Market size and forecast 2023-2028 ($ million)
- Chart on Food and beverages - Year-over-year growth 2023-2028 (%)
- Data Table on Food and beverages - Year-over-year growth 2023-2028 (%)
- 9.6 Others - Market size and forecast 2023-2028
- Chart on Others - Market size and forecast 2023-2028 ($ million)
- Data Table on Others - Market size and forecast 2023-2028 ($ million)
- Chart on Others - Year-over-year growth 2023-2028 (%)
- Data Table on Others - Year-over-year growth 2023-2028 (%)
- 9.7 Market opportunity by Application
- Market opportunity by Application ($ million)
- Data Table on Market opportunity by Application ($ million)
10 Customer Landscape
- 10.1 Customer landscape overview
- Analysis of price sensitivity, lifecycle, customer purchase basket, adoption rates, and purchase criteria
11 Geographic Landscape
- 11.1 Geographic segmentation
- Chart on Market share By Geographical Landscape 2023-2028 (%)
- Data Table on Market share By Geographical Landscape 2023-2028 (%)
- 11.2 Geographic comparison
- Chart on Geographic comparison
- Data Table on Geographic comparison
- 11.3 APAC - Market size and forecast 2023-2028
- Chart on APAC - Market size and forecast 2023-2028 ($ million)
- Data Table on APAC - Market size and forecast 2023-2028 ($ million)
- Chart on APAC - Year-over-year growth 2023-2028 (%)
- Data Table on APAC - Year-over-year growth 2023-2028 (%)
- 11.4 North America - Market size and forecast 2023-2028
- Chart on North America - Market size and forecast 2023-2028 ($ million)
- Data Table on North America - Market size and forecast 2023-2028 ($ million)
- Chart on North America - Year-over-year growth 2023-2028 (%)
- Data Table on North America - Year-over-year growth 2023-2028 (%)
- 11.5 Europe - Market size and forecast 2023-2028
- Chart on Europe - Market size and forecast 2023-2028 ($ million)
- Data Table on Europe - Market size and forecast 2023-2028 ($ million)
- Chart on Europe - Year-over-year growth 2023-2028 (%)
- Data Table on Europe - Year-over-year growth 2023-2028 (%)
- 11.6 South America - Market size and forecast 2023-2028
- Chart on South America - Market size and forecast 2023-2028 ($ million)
- Data Table on South America - Market size and forecast 2023-2028 ($ million)
- Chart on South America - Year-over-year growth 2023-2028 (%)
- Data Table on South America - Year-over-year growth 2023-2028 (%)
- 11.7 Middle East and Africa - Market size and forecast 2023-2028
- Chart on Middle East and Africa - Market size and forecast 2023-2028 ($ million)
- Data Table on Middle East and Africa - Market size and forecast 2023-2028 ($ million)
- Chart on Middle East and Africa - Year-over-year growth 2023-2028 (%)
- Data Table on Middle East and Africa - Year-over-year growth 2023-2028 (%)
- 11.8 US - Market size and forecast 2023-2028
- Chart on US - Market size and forecast 2023-2028 ($ million)
- Data Table on US - Market size and forecast 2023-2028 ($ million)
- Chart on US - Year-over-year growth 2023-2028 (%)
- Data Table on US - Year-over-year growth 2023-2028 (%)
- 11.9 China - Market size and forecast 2023-2028
- Chart on China - Market size and forecast 2023-2028 ($ million)
- Data Table on China - Market size and forecast 2023-2028 ($ million)
- Chart on China - Year-over-year growth 2023-2028 (%)
- Data Table on China - Year-over-year growth 2023-2028 (%)
- 11.10 Japan - Market size and forecast 2023-2028
- Chart on Japan - Market size and forecast 2023-2028 ($ million)
- Data Table on Japan - Market size and forecast 2023-2028 ($ million)
- Chart on Japan - Year-over-year growth 2023-2028 (%)
- Data Table on Japan - Year-over-year growth 2023-2028 (%)
- 11.11 South Korea - Market size and forecast 2023-2028
- Chart on South Korea - Market size and forecast 2023-2028 ($ million)
- Data Table on South Korea - Market size and forecast 2023-2028 ($ million)
- Chart on South Korea - Year-over-year growth 2023-2028 (%)
- Data Table on South Korea - Year-over-year growth 2023-2028 (%)
- 11.12 Germany - Market size and forecast 2023-2028
- Chart on Germany - Market size and forecast 2023-2028 ($ million)
- Data Table on Germany - Market size and forecast 2023-2028 ($ million)
- Chart on Germany - Year-over-year growth 2023-2028 (%)
- Data Table on Germany - Year-over-year growth 2023-2028 (%)
- 11.13 India - Market size and forecast 2023-2028
- Chart on India - Market size and forecast 2023-2028 ($ million)
- Data Table on India - Market size and forecast 2023-2028 ($ million)
- Chart on India - Year-over-year growth 2023-2028 (%)
- Data Table on India - Year-over-year growth 2023-2028 (%)
- 11.14 Canada - Market size and forecast 2023-2028
- Chart on Canada - Market size and forecast 2023-2028 ($ million)
- Data Table on Canada - Market size and forecast 2023-2028 ($ million)
- Chart on Canada - Year-over-year growth 2023-2028 (%)
- Data Table on Canada - Year-over-year growth 2023-2028 (%)
- 11.15 France - Market size and forecast 2023-2028
- Chart on France - Market size and forecast 2023-2028 ($ million)
- Data Table on France - Market size and forecast 2023-2028 ($ million)
- Chart on France - Year-over-year growth 2023-2028 (%)
- Data Table on France - Year-over-year growth 2023-2028 (%)
- 11.16 Brazil - Market size and forecast 2023-2028
- Chart on Brazil - Market size and forecast 2023-2028 ($ million)
- Data Table on Brazil - Market size and forecast 2023-2028 ($ million)
- Chart on Brazil - Year-over-year growth 2023-2028 (%)
- Data Table on Brazil - Year-over-year growth 2023-2028 (%)
- 11.17 Australia - Market size and forecast 2023-2028
- Chart on Australia - Market size and forecast 2023-2028 ($ million)
- Data Table on Australia - Market size and forecast 2023-2028 ($ million)
- Chart on Australia - Year-over-year growth 2023-2028 (%)
- Data Table on Australia - Year-over-year growth 2023-2028 (%)
- 11.18 Market opportunity By Geographical Landscape
- Market opportunity By Geographical Landscape ($ million)
- Data Tables on Market opportunity By Geographical Landscape ($ million)
12 Drivers, Challenges, and Opportunity/Restraints
- 12.1 Market drivers
- 12.2 Market challenges
- 12.3 Impact of drivers and challenges
- Impact of drivers and challenges in 2023 and 2028
- 12.4 Market opportunities/restraints
13 Competitive Landscape
- 13.1 Overview
- 13.2 Competitive Landscape
- Overview on criticality of inputs and factors of differentiation
- 13.3 Landscape disruption
- Overview on factors of disruption
- 13.4 Industry risks
- Impact of key risks on business
14 Competitive Analysis
- 14.1 Companies profiled
- Companies covered
- 14.2 Company ranking index
- Company ranking index
- 14.3 Market positioning of companies
- Matrix on companies position and classification
- 14.4 Adisseo Co.
- Adisseo Co. - Overview
- Adisseo Co. - Product / Service
- Adisseo Co. - Key news
- Adisseo Co. - Key offerings
- SWOT
- 14.5 Ajinomoto Co. Inc.
- Ajinomoto Co. Inc. - Overview
- Ajinomoto Co. Inc. - Business segments
- Ajinomoto Co. Inc. - Key news
- Ajinomoto Co. Inc. - Key offerings
- Ajinomoto Co. Inc. - Segment focus
- SWOT
- 14.6 Amino GmbH
- Amino GmbH - Overview
- Amino GmbH - Product / Service
- Amino GmbH - Key offerings
- SWOT
- 14.7 Archer Daniels Midland Co.
- Archer Daniels Midland Co. - Overview
- Archer Daniels Midland Co. - Business segments
- Archer Daniels Midland Co. - Key news
- Archer Daniels Midland Co. - Key offerings
- Archer Daniels Midland Co. - Segment focus
- SWOT
- 14.8 Cargill Inc.
- Cargill Inc. - Overview
- Cargill Inc. - Product / Service
- Cargill Inc. - Key offerings
- SWOT
- 14.9 CJ CheilJedang Corp.
- CJ CheilJedang Corp. - Overview
- CJ CheilJedang Corp. - Business segments
- CJ CheilJedang Corp. - Key news
- CJ CheilJedang Corp. - Key offerings
- CJ CheilJedang Corp. - Segment focus
- SWOT
- 14.10 Daesang Corp.
- Daesang Corp. - Overview
- Daesang Corp. - Business segments
- Daesang Corp. - Key offerings
- Daesang Corp. - Segment focus
- SWOT
- 14.11 Evonik Industries AG
- Evonik Industries AG - Overview
- Evonik Industries AG - Business segments
- Evonik Industries AG - Key news
- Evonik Industries AG - Key offerings
- Evonik Industries AG - Segment focus
- SWOT
- 14.12 Glanbia plc
- Glanbia plc - Overview
- Glanbia plc - Business segments
- Glanbia plc - Key news
- Glanbia plc - Key offerings
- Glanbia plc - Segment focus
- SWOT
- 14.13 Global Bio chem Technology Group Co. Ltd.
- Global Bio chem Technology Group Co. Ltd. - Overview
- Global Bio chem Technology Group Co. Ltd. - Business segments
- Global Bio chem Technology Group Co. Ltd. - Key offerings
- Global Bio chem Technology Group Co. Ltd. - Segment focus
- SWOT
- 14.14 Kyowa Hakko Bio Co. Ltd.
- Kyowa Hakko Bio Co. Ltd. - Overview
- Kyowa Hakko Bio Co. Ltd. - Product / Service
- Kyowa Hakko Bio Co. Ltd. - Key offerings
- SWOT
- 14.15 Pacific Rainbow International Inc.
- Pacific Rainbow International Inc. - Overview
- Pacific Rainbow International Inc. - Product / Service
- Pacific Rainbow International Inc. - Key offerings
- SWOT
- 14.16 Sichuan Tongsheng Amino acid Co. Ltd
- Sichuan Tongsheng Amino acid Co. Ltd - Overview
- Sichuan Tongsheng Amino acid Co. Ltd - Product / Service
- Sichuan Tongsheng Amino acid Co. Ltd - Key offerings
- SWOT
- 14.17 Sumitomo Chemical Co. Ltd.
- Sumitomo Chemical Co. Ltd. - Overview
- Sumitomo Chemical Co. Ltd. - Business segments
- Sumitomo Chemical Co. Ltd. - Key offerings
- Sumitomo Chemical Co. Ltd. - Segment focus
- SWOT
- 14.18 Wacker Chemie AG
- Wacker Chemie AG - Overview
- Wacker Chemie AG - Business segments
- Wacker Chemie AG - Key news
- Wacker Chemie AG - Key offerings
- Wacker Chemie AG - Segment focus
- SWOT
15 Appendix
- 15.1 Scope of the report
- 15.2 Inclusions and exclusions checklist
- Inclusions checklist
- Exclusions checklist
- 15.3 Currency conversion rates for US$
- Currency conversion rates for US$
- 15.4 Research methodology
- Research methodology
- 15.5 Data procurement
- Information sources
- 15.6 Data validation
- Data validation
- 15.7 Validation techniques employed for market sizing
- Validation techniques employed for market sizing
- 15.8 Data synthesis
- Data synthesis
- 15.9 360 degree market analysis
- 360 degree market analysis
- 15.10 List of abbreviations
- List of abbreviations
