|
|
市場調査レポート
商品コード
1604116
酪酸カルシウムの世界市場 (2024~2028年)Global Calcium Butyrate Market 2024-2028 |
||||||
|
|||||||
カスタマイズ可能
|
|||||||

| 酪酸カルシウムの世界市場 (2024~2028年) |
|
出版日: 2024年09月21日
発行: TechNavio
ページ情報: 英文 203 Pages
納期: 即納可能
|

全表示
- 概要
- 図表
- 目次
酪酸カルシウム市場 (2024~2028年)
酪酸カルシウム市場は2023-2028年に8,270万米ドル分拡大し、予測期間中に7.4%のCAGRで成長すると予測されます。当レポートでは、酪酸カルシウム市場の全体的な分析、市場規模・予測、動向、成長促進要因、課題、約25のベンダーを網羅したベンダー分析などを掲載しています。
当レポートでは、現在の市場シナリオ、最新動向と促進要因、市場環境全体に関する最新分析を提供しています。市場は、新興国における動物飼料産業の拡大、動物飼料の生産能力拡大を目的とした投資の増加、腸疾患の治療における酪酸カルシウムの利用増加によって牽引されています。
| 市場範囲 | |
|---|---|
| 基準年 | 2024年 |
| 終了年 | 2028年 |
| 予測期間 | 2024~2028年 |
| 成長モメンタム | 加速 |
| 前年比 (2024年) | 6% |
| CAGR | 7.4% |
| 増分額 | 8,270万米ドル |
当レポートでは、今後数年間の酪酸カルシウム市場の成長を促進する主な要因の1つとして、ベンダーが新製品の開発に注力するようになっていることを挙げています。また、市場ベンダー間の企業合併・買収 (M&A) の増加や、動物の健康・福祉に関する意識向上プログラムの増加も、市場の大きな需要につながると思われます。
目次
第1章 エグゼクティブサマリー
- 市場概要
第2章 Technavioによる分析
- 価格感応度・ライフサイクル・顧客購入バスケット・採用率・購入基準の分析
- インプットの重要性と差別化の要因
- 混乱の要因
- 促進要因と課題の影響
第3章 市場情勢
- 市場エコシステム
- 市場の特徴
- バリューチェーン分析
第4章 市場規模
- 市場の定義
- 市場セグメント分析
- 市場規模 (2023年)
- 市場の見通し (2023~2028年)
第5章 市場規模実績
- 酪酸カルシウムの世界市場 (2018~2022年)
- 用途別分析 (2018~2022年)
- 種類別分析 (2018~2022年)
- 地域別分析 (2018~2022年)
- 国別分析 (2018~2022年)
第6章 定性分析
- AIの影響:酪酸カルシウムの世界市場
第7章 ファイブフォース分析
- ファイブフォースの要約
- 買い手の交渉力
- 供給企業の交渉力
- 新規参入業者の脅威
- 代替品の脅威
- 競争の脅威
- 市況
第8章 市場セグメンテーション:用途別
- 市場セグメント
- 比較:用途別
- 動物飼料:市場規模と予測 (2023~2028年)
- 栄養補助食品:市場規模と予測 (2023~2028年)
- 医薬品:市場規模と予測 (2023~2028年)
- 市場機会:用途別
第9章 市場セグメンテーション:種類別
- 市場セグメント
- 比較:種類別
- 粉末:市場規模と予測 (2023~2028年)
- 液体:市場規模と予測 (2023~2028年)
- 市場機会:種類別
第10章 顧客情勢
- 顧客情勢の概要
第11章 地域別情勢
- 地域別セグメンテーション
- 地域別比較
- 北米:市場規模と予測 (2023~2028年)
- アジア太平洋:市場規模と予測 (2023~2028年)
- 欧州:市場規模と予測 (2023~2028年)
- 南米:市場規模と予測 (2023~2028年)
- 中東・アフリカ:市場規模と予測 (2023~2028年)
- 米国:市場規模と予測 (2023~2028年)
- 中国:市場規模と予測 (2023~2028年)
- インド:市場規模と予測 (2023~2028年)
- ドイツ:市場規模と予測 (2023~2028年)
- フランス:市場規模と予測 (2023~2028年)
- カナダ:市場規模と予測 (2023~2028年)
- 日本:市場規模と予測 (2023~2028年)
- 英国:市場規模と予測 (2023~2028年)
- オーストラリア:市場規模と予測 (2023~2028年)
- ブラジル:市場規模と予測 (2023~2028年)
- 市場機会:地域別
第12章 促進要因・課題・機会・抑制要因
- 市場促進要因
- 市場の課題
- 促進要因と課題の影響
- 市場の機会・抑制要因
第13章 競合情勢
- 概要
- 競合情勢
- 混乱の状況
- 業界のリスク
第14章 競合分析
- 企業プロファイル
- 企業ランキング指数
- 企業の市場ポジショニング
- Anmol Chemicals Pvt Ltd
- BodyBio Inc.
- Innov Ad NV SA
- Jainex Speciality Chemical
- Jubilant Ingrevia Ltd.
- Kemin Industries Inc.
- Nutreco N.V.
- Palital BV
- Sanluc International nv
- Sigma Aldrich Chemicals Pvt Ltd
- Singao Agribusiness Development Co Ltd
- Spectrum Laboratory Products Inc.
- Tokyo Chemical Industry Co., Ltd.
- Ultra Chemical Works
- West Bengal Chemical Industries Ltd.
第15章 付録
Exhibits:
- Exhibits1: Executive Summary - Chart on Market Overview
- Exhibits2: Executive Summary - Data Table on Market Overview
- Exhibits3: Executive Summary - Chart on Global Market Characteristics
- Exhibits4: Executive Summary - Chart on Market By Geographical Landscape
- Exhibits5: Executive Summary - Chart on Market Segmentation by Application
- Exhibits6: Executive Summary - Chart on Market Segmentation by Type
- Exhibits7: Executive Summary - Chart on Incremental Growth
- Exhibits8: Executive Summary - Data Table on Incremental Growth
- Exhibits9: Executive Summary - Chart on Company Market Positioning
- Exhibits10: Analysis of price sensitivity, lifecycle, customer purchase basket, adoption rates, and purchase criteria
- Exhibits11: Overview on criticality of inputs and factors of differentiation
- Exhibits12: Overview on factors of disruption
- Exhibits13: Impact of drivers and challenges in 2023 and 2028
- Exhibits14: Parent Market
- Exhibits15: Data Table on - Parent Market
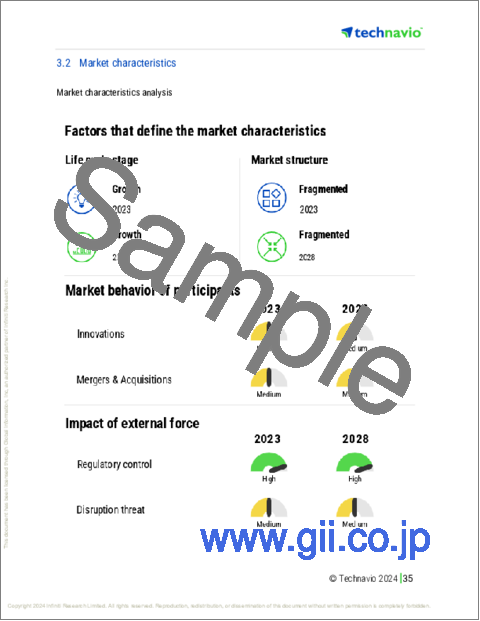
- Exhibits16: Market characteristics analysis
- Exhibits17: Value Chain Analysis
- Exhibits18: Offerings of companies included in the market definition
- Exhibits19: Market segments
- Exhibits20: Chart on Global - Market size and forecast 2023-2028 ($ million)
- Exhibits21: Data Table on Global - Market size and forecast 2023-2028 ($ million)
- Exhibits22: Chart on Global Market: Year-over-year growth 2023-2028 (%)
- Exhibits23: Data Table on Global Market: Year-over-year growth 2023-2028 (%)
- Exhibits24: Historic Market Size - Data Table on Global Calcium Butyrate Market 2018 - 2022 ($ million)
- Exhibits25: Historic Market Size - Application Segment 2018 - 2022 ($ million)
- Exhibits26: Historic Market Size - Type Segment 2018 - 2022 ($ million)
- Exhibits27: Historic Market Size - Geography Segment 2018 - 2022 ($ million)
- Exhibits28: Historic Market Size - Country Segment 2018 - 2022 ($ million)
- Exhibits29: Five forces analysis - Comparison between 2023 and 2028
- Exhibits30: Bargaining power of buyers - Impact of key factors 2023 and 2028
- Exhibits31: Bargaining power of suppliers - Impact of key factors in 2023 and 2028
- Exhibits32: Threat of new entrants - Impact of key factors in 2023 and 2028
- Exhibits33: Threat of substitutes - Impact of key factors in 2023 and 2028
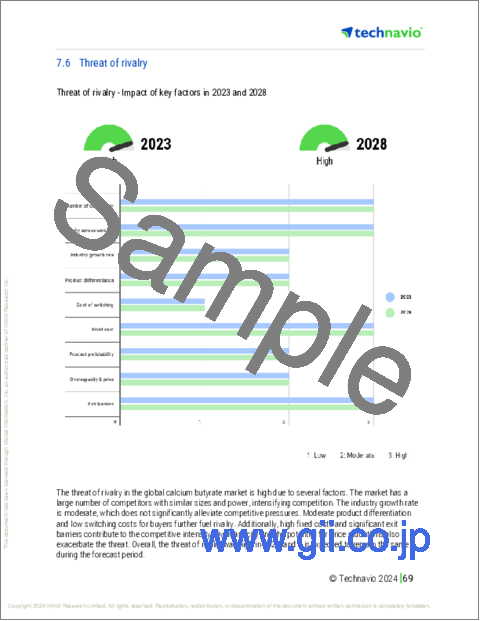
- Exhibits34: Threat of rivalry - Impact of key factors in 2023 and 2028
- Exhibits35: Chart on Market condition - Five forces 2023 and 2028
- Exhibits36: Chart on Application - Market share 2023-2028 (%)
- Exhibits37: Data Table on Application - Market share 2023-2028 (%)
- Exhibits38: Chart on Comparison by Application
- Exhibits39: Data Table on Comparison by Application
- Exhibits40: Chart on Animal feed - Market size and forecast 2023-2028 ($ million)
- Exhibits41: Data Table on Animal feed - Market size and forecast 2023-2028 ($ million)
- Exhibits42: Chart on Animal feed - Year-over-year growth 2023-2028 (%)
- Exhibits43: Data Table on Animal feed - Year-over-year growth 2023-2028 (%)
- Exhibits44: Chart on Nutritional supplements - Market size and forecast 2023-2028 ($ million)
- Exhibits45: Data Table on Nutritional supplements - Market size and forecast 2023-2028 ($ million)
- Exhibits46: Chart on Nutritional supplements - Year-over-year growth 2023-2028 (%)
- Exhibits47: Data Table on Nutritional supplements - Year-over-year growth 2023-2028 (%)
- Exhibits48: Chart on Pharmaceuticals - Market size and forecast 2023-2028 ($ million)
- Exhibits49: Data Table on Pharmaceuticals - Market size and forecast 2023-2028 ($ million)
- Exhibits50: Chart on Pharmaceuticals - Year-over-year growth 2023-2028 (%)
- Exhibits51: Data Table on Pharmaceuticals - Year-over-year growth 2023-2028 (%)
- Exhibits52: Market opportunity by Application ($ million)
- Exhibits53: Data Table on Market opportunity by Application ($ million)
- Exhibits54: Chart on Type - Market share 2023-2028 (%)
- Exhibits55: Data Table on Type - Market share 2023-2028 (%)
- Exhibits56: Chart on Comparison by Type
- Exhibits57: Data Table on Comparison by Type
- Exhibits58: Chart on Powder - Market size and forecast 2023-2028 ($ million)
- Exhibits59: Data Table on Powder - Market size and forecast 2023-2028 ($ million)
- Exhibits60: Chart on Powder - Year-over-year growth 2023-2028 (%)
- Exhibits61: Data Table on Powder - Year-over-year growth 2023-2028 (%)
- Exhibits62: Chart on Liquid - Market size and forecast 2023-2028 ($ million)
- Exhibits63: Data Table on Liquid - Market size and forecast 2023-2028 ($ million)
- Exhibits64: Chart on Liquid - Year-over-year growth 2023-2028 (%)
- Exhibits65: Data Table on Liquid - Year-over-year growth 2023-2028 (%)
- Exhibits66: Market opportunity by Type ($ million)
- Exhibits67: Data Table on Market opportunity by Type ($ million)
- Exhibits68: Analysis of price sensitivity, lifecycle, customer purchase basket, adoption rates, and purchase criteria
- Exhibits69: Chart on Market share By Geographical Landscape 2023-2028 (%)
- Exhibits70: Data Table on Market share By Geographical Landscape 2023-2028 (%)
- Exhibits71: Chart on Geographic comparison
- Exhibits72: Data Table on Geographic comparison
- Exhibits73: Chart on North America - Market size and forecast 2023-2028 ($ million)
- Exhibits74: Data Table on North America - Market size and forecast 2023-2028 ($ million)
- Exhibits75: Chart on North America - Year-over-year growth 2023-2028 (%)
- Exhibits76: Data Table on North America - Year-over-year growth 2023-2028 (%)
- Exhibits77: Chart on APAC - Market size and forecast 2023-2028 ($ million)
- Exhibits78: Data Table on APAC - Market size and forecast 2023-2028 ($ million)
- Exhibits79: Chart on APAC - Year-over-year growth 2023-2028 (%)
- Exhibits80: Data Table on APAC - Year-over-year growth 2023-2028 (%)
- Exhibits81: Chart on Europe - Market size and forecast 2023-2028 ($ million)
- Exhibits82: Data Table on Europe - Market size and forecast 2023-2028 ($ million)
- Exhibits83: Chart on Europe - Year-over-year growth 2023-2028 (%)
- Exhibits84: Data Table on Europe - Year-over-year growth 2023-2028 (%)
- Exhibits85: Chart on South America - Market size and forecast 2023-2028 ($ million)
- Exhibits86: Data Table on South America - Market size and forecast 2023-2028 ($ million)
- Exhibits87: Chart on South America - Year-over-year growth 2023-2028 (%)
- Exhibits88: Data Table on South America - Year-over-year growth 2023-2028 (%)
- Exhibits89: Chart on Middle East and Africa - Market size and forecast 2023-2028 ($ million)
- Exhibits90: Data Table on Middle East and Africa - Market size and forecast 2023-2028 ($ million)
- Exhibits91: Chart on Middle East and Africa - Year-over-year growth 2023-2028 (%)
- Exhibits92: Data Table on Middle East and Africa - Year-over-year growth 2023-2028 (%)
- Exhibits93: Chart on US - Market size and forecast 2023-2028 ($ million)
- Exhibits94: Data Table on US - Market size and forecast 2023-2028 ($ million)
- Exhibits95: Chart on US - Year-over-year growth 2023-2028 (%)
- Exhibits96: Data Table on US - Year-over-year growth 2023-2028 (%)
- Exhibits97: Chart on China - Market size and forecast 2023-2028 ($ million)
- Exhibits98: Data Table on China - Market size and forecast 2023-2028 ($ million)
- Exhibits99: Chart on China - Year-over-year growth 2023-2028 (%)
- Exhibits100: Data Table on China - Year-over-year growth 2023-2028 (%)
- Exhibits101: Chart on India - Market size and forecast 2023-2028 ($ million)
- Exhibits102: Data Table on India - Market size and forecast 2023-2028 ($ million)
- Exhibits103: Chart on India - Year-over-year growth 2023-2028 (%)
- Exhibits104: Data Table on India - Year-over-year growth 2023-2028 (%)
- Exhibits105: Chart on Germany - Market size and forecast 2023-2028 ($ million)
- Exhibits106: Data Table on Germany - Market size and forecast 2023-2028 ($ million)
- Exhibits107: Chart on Germany - Year-over-year growth 2023-2028 (%)
- Exhibits108: Data Table on Germany - Year-over-year growth 2023-2028 (%)
- Exhibits109: Chart on France - Market size and forecast 2023-2028 ($ million)
- Exhibits110: Data Table on France - Market size and forecast 2023-2028 ($ million)
- Exhibits111: Chart on France - Year-over-year growth 2023-2028 (%)
- Exhibits112: Data Table on France - Year-over-year growth 2023-2028 (%)
- Exhibits113: Chart on Canada - Market size and forecast 2023-2028 ($ million)
- Exhibits114: Data Table on Canada - Market size and forecast 2023-2028 ($ million)
- Exhibits115: Chart on Canada - Year-over-year growth 2023-2028 (%)
- Exhibits116: Data Table on Canada - Year-over-year growth 2023-2028 (%)
- Exhibits117: Chart on Japan - Market size and forecast 2023-2028 ($ million)
- Exhibits118: Data Table on Japan - Market size and forecast 2023-2028 ($ million)
- Exhibits119: Chart on Japan - Year-over-year growth 2023-2028 (%)
- Exhibits120: Data Table on Japan - Year-over-year growth 2023-2028 (%)
- Exhibits121: Chart on UK - Market size and forecast 2023-2028 ($ million)
- Exhibits122: Data Table on UK - Market size and forecast 2023-2028 ($ million)
- Exhibits123: Chart on UK - Year-over-year growth 2023-2028 (%)
- Exhibits124: Data Table on UK - Year-over-year growth 2023-2028 (%)
- Exhibits125: Chart on Australia - Market size and forecast 2023-2028 ($ million)
- Exhibits126: Data Table on Australia - Market size and forecast 2023-2028 ($ million)
- Exhibits127: Chart on Australia - Year-over-year growth 2023-2028 (%)
- Exhibits128: Data Table on Australia - Year-over-year growth 2023-2028 (%)
- Exhibits129: Chart on Brazil - Market size and forecast 2023-2028 ($ million)
- Exhibits130: Data Table on Brazil - Market size and forecast 2023-2028 ($ million)
- Exhibits131: Chart on Brazil - Year-over-year growth 2023-2028 (%)
- Exhibits132: Data Table on Brazil - Year-over-year growth 2023-2028 (%)
- Exhibits133: Market opportunity By Geographical Landscape ($ million)
- Exhibits134: Data Tables on Market opportunity By Geographical Landscape ($ million)
- Exhibits135: Impact of drivers and challenges in 2023 and 2028
- Exhibits136: Overview on criticality of inputs and factors of differentiation
- Exhibits137: Overview on factors of disruption
- Exhibits138: Impact of key risks on business
- Exhibits139: Companies covered
- Exhibits140: Company ranking index
- Exhibits141: Matrix on companies position and classification
- Exhibits142: Anmol Chemicals Pvt Ltd - Overview
- Exhibits143: Anmol Chemicals Pvt Ltd - Product / Service
- Exhibits144: Anmol Chemicals Pvt Ltd - Key offerings
- Exhibits145: SWOT
- Exhibits146: BodyBio Inc. - Overview
- Exhibits147: BodyBio Inc. - Product / Service
- Exhibits148: BodyBio Inc. - Key offerings
- Exhibits149: SWOT
- Exhibits150: Innov Ad NV SA - Overview
- Exhibits151: Innov Ad NV SA - Product / Service
- Exhibits152: Innov Ad NV SA - Key offerings
- Exhibits153: SWOT
- Exhibits154: Jainex Speciality Chemical - Overview
- Exhibits155: Jainex Speciality Chemical - Product / Service
- Exhibits156: Jainex Speciality Chemical - Key offerings
- Exhibits157: SWOT
- Exhibits158: Jubilant Ingrevia Ltd. - Overview
- Exhibits159: Jubilant Ingrevia Ltd. - Product / Service
- Exhibits160: Jubilant Ingrevia Ltd. - Key news
- Exhibits161: Jubilant Ingrevia Ltd. - Key offerings
- Exhibits162: SWOT
- Exhibits163: Kemin Industries Inc. - Overview
- Exhibits164: Kemin Industries Inc. - Product / Service
- Exhibits165: Kemin Industries Inc. - Key news
- Exhibits166: Kemin Industries Inc. - Key offerings
- Exhibits167: SWOT
- Exhibits168: Nutreco N.V. - Overview
- Exhibits169: Nutreco N.V. - Product / Service
- Exhibits170: Nutreco N.V. - Key offerings
- Exhibits171: SWOT
- Exhibits172: Palital BV - Overview
- Exhibits173: Palital BV - Product / Service
- Exhibits174: Palital BV - Key offerings
- Exhibits175: SWOT
- Exhibits176: Sanluc International nv - Overview
- Exhibits177: Sanluc International nv - Product / Service
- Exhibits178: Sanluc International nv - Key offerings
- Exhibits179: SWOT
- Exhibits180: Sigma Aldrich Chemicals Pvt Ltd - Overview
- Exhibits181: Sigma Aldrich Chemicals Pvt Ltd - Product / Service
- Exhibits182: Sigma Aldrich Chemicals Pvt Ltd - Key offerings
- Exhibits183: SWOT
- Exhibits184: Singao Agribusiness Development Co Ltd - Overview
- Exhibits185: Singao Agribusiness Development Co Ltd - Product / Service
- Exhibits186: Singao Agribusiness Development Co Ltd - Key offerings
- Exhibits187: SWOT
- Exhibits188: Spectrum Laboratory Products Inc. - Overview
- Exhibits189: Spectrum Laboratory Products Inc. - Product / Service
- Exhibits190: Spectrum Laboratory Products Inc. - Key news
- Exhibits191: Spectrum Laboratory Products Inc. - Key offerings
- Exhibits192: SWOT
- Exhibits193: Tokyo Chemical Industry Co., Ltd. - Overview
- Exhibits194: Tokyo Chemical Industry Co., Ltd. - Product / Service
- Exhibits195: Tokyo Chemical Industry Co., Ltd. - Key offerings
- Exhibits196: SWOT
- Exhibits197: Ultra Chemical Works - Overview
- Exhibits198: Ultra Chemical Works - Product / Service
- Exhibits199: Ultra Chemical Works - Key offerings
- Exhibits200: SWOT
- Exhibits201: West Bengal Chemical Industries Ltd. - Overview
- Exhibits202: West Bengal Chemical Industries Ltd. - Product / Service
- Exhibits203: West Bengal Chemical Industries Ltd. - Key offerings
- Exhibits204: SWOT
- Exhibits205: Inclusions checklist
- Exhibits206: Exclusions checklist
- Exhibits207: Currency conversion rates for US$
- Exhibits208: Research methodology
- Exhibits209: Information sources
- Exhibits210: Data validation
- Exhibits211: Validation techniques employed for market sizing
- Exhibits212: Data synthesis
- Exhibits213: 360 degree market analysis
- Exhibits214: List of abbreviations
Calcium Butyrate Market 2024-2028
The calcium butyrate market is forecasted to grow by USD 82.7 mn during 2023-2028, accelerating at a CAGR of 7.4% during the forecast period. The report on the calcium butyrate market provides a holistic analysis, market size and forecast, trends, growth drivers, and challenges, as well as vendor analysis covering around 25 vendors.
The report offers an up-to-date analysis regarding the current market scenario, the latest trends and drivers, and the overall market environment. The market is driven by expanding animal feed industry in developing countries, increasing investments aimed at expanding animal feed production capacity, and growing use of calcium butyrate in treating intestinal diseases.
| Market Scope | |
|---|---|
| Base Year | 2024 |
| End Year | 2028 |
| Series Year | 2024-2028 |
| Growth Momentum | Accelerate |
| YOY 2024 | 6% |
| CAGR | 7.4% |
| Incremental Value | $82.7 mn |
Technavio's calcium butyrate market is segmented as below:
By Application
- Animal feed
- Nutritional supplements
- Pharmaceuticals
By Type
- Powder
- Liquid
By Geographical Landscape
- North America
- APAC
- Europe
- South America
- Middle East and Africa
This study identifies the growing focus of vendors on new product development as one of the prime reasons driving the calcium butyrate market growth during the next few years. Also, increasing mergers and acquisitions among market vendors and increasing awareness programs for animal health and welfare will lead to sizable demand in the market.
The report on the calcium butyrate market covers the following areas:
- Calcium Butyrate Market sizing
- Calcium Butyrate Market forecast
- Calcium Butyrate Market industry analysis
The robust vendor analysis is designed to help clients improve their market position, and in line with this, this report provides a detailed analysis of several leading calcium butyrate market vendors that include A.M Food Chemical Co. Ltd., Aadhunik Industries, Anmol Chemicals Pvt Ltd, BioFuran Materials LLC, BodyBio Inc., Innov Ad NV SA, Jainex Speciality Chemical, Jubilant Ingrevia Ltd., Kemin Industries Inc., Nutreco N.V., Palital BV, PUYER BIOPHARMA CO LTD, Sanluc International nv, Shandong Natural Micron Pharm Tech Co Ltd., Sigma Aldrich Chemicals Pvt Ltd, Singao Agribusiness Development Co Ltd, Spectrum Laboratory Products Inc., Tokyo Chemical Industry Co., Ltd., Ultra Chemical Works, and West Bengal Chemical Industries Ltd.. Also, the calcium butyrate market analysis report includes information on upcoming trends and challenges that will influence market growth. This is to help companies strategize and leverage all forthcoming growth opportunities.
The study was conducted using an objective combination of primary and secondary information including inputs from key participants in the industry. The report contains a comprehensive market and vendor landscape in addition to an analysis of the key vendors.
The publisher presents a detailed picture of the market by the way of study, synthesis, and summation of data from multiple sources by an analysis of key parameters such as profit, pricing, competition, and promotions. It presents various market facets by identifying the key industry influencers. The data presented is comprehensive, reliable, and a result of extensive primary and secondary research. The market research reports provide a complete competitive landscape and an in-depth vendor selection methodology and analysis using qualitative and quantitative research to forecast accurate market growth.
Table of Contents
1 Executive Summary
- 1.1 Market overview
- Executive Summary - Chart on Market Overview
- Executive Summary - Data Table on Market Overview
- Executive Summary - Chart on Global Market Characteristics
- Executive Summary - Chart on Market By Geographical Landscape
- Executive Summary - Chart on Market Segmentation by Application
- Executive Summary - Chart on Market Segmentation by Type
- Executive Summary - Chart on Incremental Growth
- Executive Summary - Data Table on Incremental Growth
- Executive Summary - Chart on Company Market Positioning
2 Technavio Analysis
- 2.1 Analysis of price sensitivity, lifecycle, customer purchase basket, adoption rates, and purchase criteria
- Analysis of price sensitivity, lifecycle, customer purchase basket, adoption rates, and purchase criteria
- 2.2 Criticality of inputs and Factors of differentiation
- Overview on criticality of inputs and factors of differentiation
- 2.3 Factors of disruption
- Overview on factors of disruption
- 2.4 Impact of drivers and challenges
- Impact of drivers and challenges in 2023 and 2028
3 Market Landscape
- 3.1 Market ecosystem
- Parent Market
- Data Table on - Parent Market
- 3.2 Market characteristics
- Market characteristics analysis
- 3.3 Value chain analysis
- Value Chain Analysis
4 Market Sizing
- 4.1 Market definition
- Offerings of companies included in the market definition
- 4.2 Market segment analysis
- Market segments
- 4.3 Market size 2023
- 4.4 Market outlook: Forecast for 2023-2028
- Chart on Global - Market size and forecast 2023-2028 ($ million)
- Data Table on Global - Market size and forecast 2023-2028 ($ million)
- Chart on Global Market: Year-over-year growth 2023-2028 (%)
- Data Table on Global Market: Year-over-year growth 2023-2028 (%)
5 Historic Market Size
- 5.1 Global Calcium Butyrate Market 2018 - 2022
- Historic Market Size - Data Table on Global Calcium Butyrate Market 2018 - 2022 ($ million)
- 5.2 Application segment analysis 2018 - 2022
- Historic Market Size - Application Segment 2018 - 2022 ($ million)
- 5.3 Type segment analysis 2018 - 2022
- Historic Market Size - Type Segment 2018 - 2022 ($ million)
- 5.4 Geography segment analysis 2018 - 2022
- Historic Market Size - Geography Segment 2018 - 2022 ($ million)
- 5.5 Country segment analysis 2018 - 2022
- Historic Market Size - Country Segment 2018 - 2022 ($ million)
6 Qualitative Analysis
- 6.1 Impact of AI on the Global Calcium Butyrate Market
7 Five Forces Analysis
- 7.1 Five forces summary
- Five forces analysis - Comparison between 2023 and 2028
- 7.2 Bargaining power of buyers
- Bargaining power of buyers - Impact of key factors 2023 and 2028
- 7.3 Bargaining power of suppliers
- Bargaining power of suppliers - Impact of key factors in 2023 and 2028
- 7.4 Threat of new entrants
- Threat of new entrants - Impact of key factors in 2023 and 2028
- 7.5 Threat of substitutes
- Threat of substitutes - Impact of key factors in 2023 and 2028
- 7.6 Threat of rivalry
- Threat of rivalry - Impact of key factors in 2023 and 2028
- 7.7 Market condition
- Chart on Market condition - Five forces 2023 and 2028
8 Market Segmentation by Application
- 8.1 Market segments
- Chart on Application - Market share 2023-2028 (%)
- Data Table on Application - Market share 2023-2028 (%)
- 8.2 Comparison by Application
- Chart on Comparison by Application
- Data Table on Comparison by Application
- 8.3 Animal feed - Market size and forecast 2023-2028
- Chart on Animal feed - Market size and forecast 2023-2028 ($ million)
- Data Table on Animal feed - Market size and forecast 2023-2028 ($ million)
- Chart on Animal feed - Year-over-year growth 2023-2028 (%)
- Data Table on Animal feed - Year-over-year growth 2023-2028 (%)
- 8.4 Nutritional supplements - Market size and forecast 2023-2028
- Chart on Nutritional supplements - Market size and forecast 2023-2028 ($ million)
- Data Table on Nutritional supplements - Market size and forecast 2023-2028 ($ million)
- Chart on Nutritional supplements - Year-over-year growth 2023-2028 (%)
- Data Table on Nutritional supplements - Year-over-year growth 2023-2028 (%)
- 8.5 Pharmaceuticals - Market size and forecast 2023-2028
- Chart on Pharmaceuticals - Market size and forecast 2023-2028 ($ million)
- Data Table on Pharmaceuticals - Market size and forecast 2023-2028 ($ million)
- Chart on Pharmaceuticals - Year-over-year growth 2023-2028 (%)
- Data Table on Pharmaceuticals - Year-over-year growth 2023-2028 (%)
- 8.6 Market opportunity by Application
- Market opportunity by Application ($ million)
- Data Table on Market opportunity by Application ($ million)
9 Market Segmentation by Type
- 9.1 Market segments
- Chart on Type - Market share 2023-2028 (%)
- Data Table on Type - Market share 2023-2028 (%)
- 9.2 Comparison by Type
- Chart on Comparison by Type
- Data Table on Comparison by Type
- 9.3 Powder - Market size and forecast 2023-2028
- Chart on Powder - Market size and forecast 2023-2028 ($ million)
- Data Table on Powder - Market size and forecast 2023-2028 ($ million)
- Chart on Powder - Year-over-year growth 2023-2028 (%)
- Data Table on Powder - Year-over-year growth 2023-2028 (%)
- 9.4 Liquid - Market size and forecast 2023-2028
- Chart on Liquid - Market size and forecast 2023-2028 ($ million)
- Data Table on Liquid - Market size and forecast 2023-2028 ($ million)
- Chart on Liquid - Year-over-year growth 2023-2028 (%)
- Data Table on Liquid - Year-over-year growth 2023-2028 (%)
- 9.5 Market opportunity by Type
- Market opportunity by Type ($ million)
- Data Table on Market opportunity by Type ($ million)
10 Customer Landscape
- 10.1 Customer landscape overview
- Analysis of price sensitivity, lifecycle, customer purchase basket, adoption rates, and purchase criteria
11 Geographic Landscape
- 11.1 Geographic segmentation
- Chart on Market share By Geographical Landscape 2023-2028 (%)
- Data Table on Market share By Geographical Landscape 2023-2028 (%)
- 11.2 Geographic comparison
- Chart on Geographic comparison
- Data Table on Geographic comparison
- 11.3 North America - Market size and forecast 2023-2028
- Chart on North America - Market size and forecast 2023-2028 ($ million)
- Data Table on North America - Market size and forecast 2023-2028 ($ million)
- Chart on North America - Year-over-year growth 2023-2028 (%)
- Data Table on North America - Year-over-year growth 2023-2028 (%)
- 11.4 APAC - Market size and forecast 2023-2028
- Chart on APAC - Market size and forecast 2023-2028 ($ million)
- Data Table on APAC - Market size and forecast 2023-2028 ($ million)
- Chart on APAC - Year-over-year growth 2023-2028 (%)
- Data Table on APAC - Year-over-year growth 2023-2028 (%)
- 11.5 Europe - Market size and forecast 2023-2028
- Chart on Europe - Market size and forecast 2023-2028 ($ million)
- Data Table on Europe - Market size and forecast 2023-2028 ($ million)
- Chart on Europe - Year-over-year growth 2023-2028 (%)
- Data Table on Europe - Year-over-year growth 2023-2028 (%)
- 11.6 South America - Market size and forecast 2023-2028
- Chart on South America - Market size and forecast 2023-2028 ($ million)
- Data Table on South America - Market size and forecast 2023-2028 ($ million)
- Chart on South America - Year-over-year growth 2023-2028 (%)
- Data Table on South America - Year-over-year growth 2023-2028 (%)
- 11.7 Middle East and Africa - Market size and forecast 2023-2028
- Chart on Middle East and Africa - Market size and forecast 2023-2028 ($ million)
- Data Table on Middle East and Africa - Market size and forecast 2023-2028 ($ million)
- Chart on Middle East and Africa - Year-over-year growth 2023-2028 (%)
- Data Table on Middle East and Africa - Year-over-year growth 2023-2028 (%)
- 11.8 US - Market size and forecast 2023-2028
- Chart on US - Market size and forecast 2023-2028 ($ million)
- Data Table on US - Market size and forecast 2023-2028 ($ million)
- Chart on US - Year-over-year growth 2023-2028 (%)
- Data Table on US - Year-over-year growth 2023-2028 (%)
- 11.9 China - Market size and forecast 2023-2028
- Chart on China - Market size and forecast 2023-2028 ($ million)
- Data Table on China - Market size and forecast 2023-2028 ($ million)
- Chart on China - Year-over-year growth 2023-2028 (%)
- Data Table on China - Year-over-year growth 2023-2028 (%)
- 11.10 India - Market size and forecast 2023-2028
- Chart on India - Market size and forecast 2023-2028 ($ million)
- Data Table on India - Market size and forecast 2023-2028 ($ million)
- Chart on India - Year-over-year growth 2023-2028 (%)
- Data Table on India - Year-over-year growth 2023-2028 (%)
- 11.11 Germany - Market size and forecast 2023-2028
- Chart on Germany - Market size and forecast 2023-2028 ($ million)
- Data Table on Germany - Market size and forecast 2023-2028 ($ million)
- Chart on Germany - Year-over-year growth 2023-2028 (%)
- Data Table on Germany - Year-over-year growth 2023-2028 (%)
- 11.12 France - Market size and forecast 2023-2028
- Chart on France - Market size and forecast 2023-2028 ($ million)
- Data Table on France - Market size and forecast 2023-2028 ($ million)
- Chart on France - Year-over-year growth 2023-2028 (%)
- Data Table on France - Year-over-year growth 2023-2028 (%)
- 11.13 Canada - Market size and forecast 2023-2028
- Chart on Canada - Market size and forecast 2023-2028 ($ million)
- Data Table on Canada - Market size and forecast 2023-2028 ($ million)
- Chart on Canada - Year-over-year growth 2023-2028 (%)
- Data Table on Canada - Year-over-year growth 2023-2028 (%)
- 11.14 Japan - Market size and forecast 2023-2028
- Chart on Japan - Market size and forecast 2023-2028 ($ million)
- Data Table on Japan - Market size and forecast 2023-2028 ($ million)
- Chart on Japan - Year-over-year growth 2023-2028 (%)
- Data Table on Japan - Year-over-year growth 2023-2028 (%)
- 11.15 UK - Market size and forecast 2023-2028
- Chart on UK - Market size and forecast 2023-2028 ($ million)
- Data Table on UK - Market size and forecast 2023-2028 ($ million)
- Chart on UK - Year-over-year growth 2023-2028 (%)
- Data Table on UK - Year-over-year growth 2023-2028 (%)
- 11.16 Australia - Market size and forecast 2023-2028
- Chart on Australia - Market size and forecast 2023-2028 ($ million)
- Data Table on Australia - Market size and forecast 2023-2028 ($ million)
- Chart on Australia - Year-over-year growth 2023-2028 (%)
- Data Table on Australia - Year-over-year growth 2023-2028 (%)
- 11.17 Brazil - Market size and forecast 2023-2028
- Chart on Brazil - Market size and forecast 2023-2028 ($ million)
- Data Table on Brazil - Market size and forecast 2023-2028 ($ million)
- Chart on Brazil - Year-over-year growth 2023-2028 (%)
- Data Table on Brazil - Year-over-year growth 2023-2028 (%)
- 11.18 Market opportunity By Geographical Landscape
- Market opportunity By Geographical Landscape ($ million)
- Data Tables on Market opportunity By Geographical Landscape ($ million)
12 Drivers, Challenges, and Opportunity/Restraints
- 12.1 Market drivers
- 12.2 Market challenges
- 12.3 Impact of drivers and challenges
- Impact of drivers and challenges in 2023 and 2028
- 12.4 Market opportunities/restraints
13 Competitive Landscape
- 13.1 Overview
- 13.2 Competitive Landscape
- Overview on criticality of inputs and factors of differentiation
- 13.3 Landscape disruption
- Overview on factors of disruption
- 13.4 Industry risks
- Impact of key risks on business
14 Competitive Analysis
- 14.1 Companies profiled
- Companies covered
- 14.2 Company ranking index
- Company ranking index
- 14.3 Market positioning of companies
- Matrix on companies position and classification
- 14.4 Anmol Chemicals Pvt Ltd
- Anmol Chemicals Pvt Ltd - Overview
- Anmol Chemicals Pvt Ltd - Product / Service
- Anmol Chemicals Pvt Ltd - Key offerings
- SWOT
- 14.5 BodyBio Inc.
- BodyBio Inc. - Overview
- BodyBio Inc. - Product / Service
- BodyBio Inc. - Key offerings
- SWOT
- 14.6 Innov Ad NV SA
- Innov Ad NV SA - Overview
- Innov Ad NV SA - Product / Service
- Innov Ad NV SA - Key offerings
- SWOT
- 14.7 Jainex Speciality Chemical
- Jainex Speciality Chemical - Overview
- Jainex Speciality Chemical - Product / Service
- Jainex Speciality Chemical - Key offerings
- SWOT
- 14.8 Jubilant Ingrevia Ltd.
- Jubilant Ingrevia Ltd. - Overview
- Jubilant Ingrevia Ltd. - Product / Service
- Jubilant Ingrevia Ltd. - Key news
- Jubilant Ingrevia Ltd. - Key offerings
- SWOT
- 14.9 Kemin Industries Inc.
- Kemin Industries Inc. - Overview
- Kemin Industries Inc. - Product / Service
- Kemin Industries Inc. - Key news
- Kemin Industries Inc. - Key offerings
- SWOT
- 14.10 Nutreco N.V.
- Nutreco N.V. - Overview
- Nutreco N.V. - Product / Service
- Nutreco N.V. - Key offerings
- SWOT
- 14.11 Palital BV
- Palital BV - Overview
- Palital BV - Product / Service
- Palital BV - Key offerings
- SWOT
- 14.12 Sanluc International nv
- Sanluc International nv - Overview
- Sanluc International nv - Product / Service
- Sanluc International nv - Key offerings
- SWOT
- 14.13 Sigma Aldrich Chemicals Pvt Ltd
- Sigma Aldrich Chemicals Pvt Ltd - Overview
- Sigma Aldrich Chemicals Pvt Ltd - Product / Service
- Sigma Aldrich Chemicals Pvt Ltd - Key offerings
- SWOT
- 14.14 Singao Agribusiness Development Co Ltd
- Singao Agribusiness Development Co Ltd - Overview
- Singao Agribusiness Development Co Ltd - Product / Service
- Singao Agribusiness Development Co Ltd - Key offerings
- SWOT
- 14.15 Spectrum Laboratory Products Inc.
- Spectrum Laboratory Products Inc. - Overview
- Spectrum Laboratory Products Inc. - Product / Service
- Spectrum Laboratory Products Inc. - Key news
- Spectrum Laboratory Products Inc. - Key offerings
- SWOT
- 14.16 Tokyo Chemical Industry Co., Ltd.
- Tokyo Chemical Industry Co., Ltd. - Overview
- Tokyo Chemical Industry Co., Ltd. - Product / Service
- Tokyo Chemical Industry Co., Ltd. - Key offerings
- SWOT
- 14.17 Ultra Chemical Works
- Ultra Chemical Works - Overview
- Ultra Chemical Works - Product / Service
- Ultra Chemical Works - Key offerings
- SWOT
- 14.18 West Bengal Chemical Industries Ltd.
- West Bengal Chemical Industries Ltd. - Overview
- West Bengal Chemical Industries Ltd. - Product / Service
- West Bengal Chemical Industries Ltd. - Key offerings
- SWOT
15 Appendix
- 15.1 Scope of the report
- 15.2 Inclusions and exclusions checklist
- Inclusions checklist
- Exclusions checklist
- 15.3 Currency conversion rates for US$
- Currency conversion rates for US$
- 15.4 Research methodology
- Research methodology
- 15.5 Data procurement
- Information sources
- 15.6 Data validation
- Data validation
- 15.7 Validation techniques employed for market sizing
- Validation techniques employed for market sizing
- 15.8 Data synthesis
- Data synthesis
- 15.9 360 degree market analysis
- 360 degree market analysis
- 15.10 List of abbreviations
- List of abbreviations

