|
|
市場調査レポート
商品コード
1604108
モバイル用途向け油圧機器の世界市場 2024年~2028年Global Hydraulic Equipment Market for Mobile Applications 2024-2028 |
||||||

|
|||||||
カスタマイズ可能
|
|||||||


| モバイル用途向け油圧機器の世界市場 2024年~2028年 |
|
出版日: 2024年10月17日
発行: TechNavio
ページ情報: 英文 219 Pages
納期: 即納可能
|

全表示
- 概要
- 図表
- 目次
モバイル用途向け油圧機器市場2024-2028
モバイル用途向け油圧機器市場は2023年~2028年年に70億6,170万米ドル、予測期間中のCAGRは5.6%で成長すると予測されます。この調査レポートは、移動体用油圧機器市場の全体的な分析、市場規模と予測、動向、成長促進要因、約25のベンダーを網羅したベンダー分析などを掲載しています。
現在の市場シナリオ、最新動向と促進要因、市場環境全体に関する最新分析を提供しています。同市場は、インフラ事業への政府投資の増加、農業の機械化の進展、世界の都市化の進展によって牽引されています。
| 市場範囲 | |
|---|---|
| 基準年 | 2024 |
| 終了年 | 2028 |
| 予測期間 | 2024-2028 |
| 成長モメンタム | 加速 |
| 前年比2024年 | 5.4% |
| CAGR | 5.6% |
| 増分額 | 70億6,170万米ドル |
本調査では、環境に優しい油圧作動油の採用が増加していることが、今後数年間の移動用途向け油圧機器市場の成長を促進する主な要因の1つであると指摘しています。また、ベンダーが新製品投入に注力するようになり、小型油圧システムへのシフトが進んでいることも、市場の大きな需要につながります。
目次
第1章 エグゼクティブサマリー
- 市場概要
第2章 Technavio別分析
- 価格・ライフサイクル・顧客購入バスケット・採用率・購入基準の分析
- インプットの重要性と差別化の要因
- 混乱の要因
- 促進要因と課題の影響
第3章 市場情勢
- 市場エコシステム
- 市場の特徴
- バリューチェーン分析
第4章 市場規模
- 市場の定義
- 市場セグメント分析
- 市場規模 2023年
- 市場の見通し 2023年~2028年
第5章 市場規模実績
- モバイル用途向け油圧機器の世界市場 2018年~2022年
- タイプ別セグメント分析 2018年~2022年
- エンドユーザー別セグメント分析 2018年~2022年
- 地域別セグメント分析 2018年~2022年
- 国別セグメント分析 2018年~2022年
第6章 定性分析
- AIの影響:モバイル用途向け油圧機器の世界市場
第7章 ファイブフォース分析
- ファイブフォースの要約
- 買い手の交渉力
- 供給企業の交渉力
- 新規参入業者の脅威
- 代替品の脅威
- 競争の脅威
- 市況
第8章 市場セグメンテーション:タイプ別
- 市場セグメント
- 比較:タイプ別
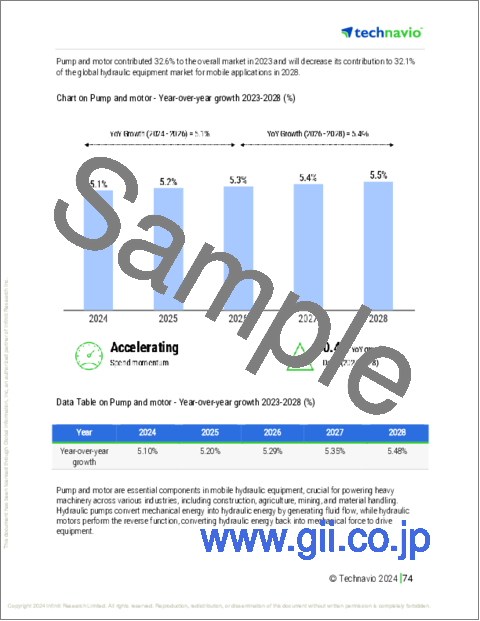
- ポンプとモーター:市場規模と予測 2023年~2028年
- バルブ:市場規模と予測 2023年~2028年
- シリンダー:市場規模と予測 2023年~2028年
- その他:市場規模と予測 2023年~2028年
- 市場機会:タイプ別
第9章 市場セグメンテーション:エンドユーザー別
- 市場セグメント
- 比較:エンドユーザー別
- 建設:市場規模と予測 2023年~2028年
- 農業:市場規模と予測 2023年~2028年
- 鉱業:市場規模と予測 2023年~2028年
- マテリアルハンドリング:市場規模と予測 2023年~2028年
- その他:市場規模と予測 2023年~2028年
- 市場機会:エンドユーザー別
第10章 顧客情勢
- 顧客情勢の概要
第11章 地域別情勢
- 地域別セグメンテーション
- 地域別比較
- アジア太平洋:市場規模と予測 2023年~2028年
- 北米:市場規模と予測 2023年~2028年
- 欧州:市場規模と予測 2023年~2028年
- 中東・アフリカ:市場規模と予測 2023年~2028年
- 南米:市場規模と予測 2023年~2028年
- 米国:市場規模と予測 2023年~2028年
- 中国:市場規模と予測 2023年~2028年
- ドイツ:市場規模と予測 2023年~2028年
- インド:市場規模と予測 2023年~2028年
- フランス:市場規模と予測 2023年~2028年
- 日本:市場規模と予測 2023年~2028年
- カナダ:市場規模と予測 2023年~2028年
- 英国:市場規模と予測 2023年~2028年
- 韓国:市場規模と予測 2023年~2028年
- ブラジル:市場規模と予測 2023年~2028年
- 市場機会:地域情勢別
第12章 促進要因・課題・機会・抑制要因
- 市場促進要因
- 市場の課題
- 促進要因と課題の影響
- 市場の機会・抑制要因
第13章 競合情勢
- 概要
- 競合情勢
- 混乱の状況
- 業界のリスク
第14章 競合分析
- 企業プロファイル
- 企業ランキング指数
- 企業の市場ポジショニング
- Bosch Rexroth AG
- Bucher Hydraulics GmbH
- CASAPPA SpA
- Caterpillar Inc.
- Danfoss AS
- Eaton Corp plc
- Enerpac Tool Group Corp.
- HYDAC International GmbH
- Kawasaki Heavy Industries Ltd.
- KYB Corp.
- Moog Inc.
- PARKER HANNIFIN CORP.
- SMC Corp.
- WEBER HYDRAULIK GmbH
- Wipro Infrastructure Engineering
第15章 付録
Exhibits:
- Exhibits1: Executive Summary - Chart on Market Overview
- Exhibits2: Executive Summary - Data Table on Market Overview
- Exhibits3: Executive Summary - Chart on Global Market Characteristics
- Exhibits4: Executive Summary - Chart on Market By Geographical Landscape
- Exhibits5: Executive Summary - Chart on Market Segmentation by Type
- Exhibits6: Executive Summary - Chart on Market Segmentation by End-user
- Exhibits7: Executive Summary - Chart on Incremental Growth
- Exhibits8: Executive Summary - Data Table on Incremental Growth
- Exhibits9: Executive Summary - Chart on Company Market Positioning
- Exhibits10: Analysis of price sensitivity, lifecycle, customer purchase basket, adoption rates, and purchase criteria
- Exhibits11: Overview on criticality of inputs and factors of differentiation
- Exhibits12: Overview on factors of disruption
- Exhibits13: Impact of drivers and challenges in 2023 and 2028
- Exhibits14: Parent Market
- Exhibits15: Data Table on - Parent Market
- Exhibits16: Market characteristics analysis
- Exhibits17: Value Chain Analysis
- Exhibits18: Offerings of companies included in the market definition
- Exhibits19: Market segments
- Exhibits20: Chart on Global - Market size and forecast 2023-2028 ($ million)
- Exhibits21: Data Table on Global - Market size and forecast 2023-2028 ($ million)
- Exhibits22: Chart on Global Market: Year-over-year growth 2023-2028 (%)
- Exhibits23: Data Table on Global Market: Year-over-year growth 2023-2028 (%)
- Exhibits24: Historic Market Size - Data Table on Global Hydraulic Equipment Market For Mobile Applications 2018 - 2022 ($ million)
- Exhibits25: Historic Market Size - Type Segment 2018 - 2022 ($ million)
- Exhibits26: Historic Market Size - End-user Segment 2018 - 2022 ($ million)
- Exhibits27: Historic Market Size - Geography Segment 2018 - 2022 ($ million)
- Exhibits28: Historic Market Size - Country Segment 2018 - 2022 ($ million)
- Exhibits29: Five forces analysis - Comparison between 2023 and 2028
- Exhibits30: Bargaining power of buyers - Impact of key factors 2023 and 2028
- Exhibits31: Bargaining power of suppliers - Impact of key factors in 2023 and 2028
- Exhibits32: Threat of new entrants - Impact of key factors in 2023 and 2028
- Exhibits33: Threat of substitutes - Impact of key factors in 2023 and 2028
- Exhibits34: Threat of rivalry - Impact of key factors in 2023 and 2028
- Exhibits35: Chart on Market condition - Five forces 2023 and 2028
- Exhibits36: Chart on Type - Market share 2023-2028 (%)
- Exhibits37: Data Table on Type - Market share 2023-2028 (%)
- Exhibits38: Chart on Comparison by Type
- Exhibits39: Data Table on Comparison by Type
- Exhibits40: Chart on Pump and motor - Market size and forecast 2023-2028 ($ million)
- Exhibits41: Data Table on Pump and motor - Market size and forecast 2023-2028 ($ million)
- Exhibits42: Chart on Pump and motor - Year-over-year growth 2023-2028 (%)
- Exhibits43: Data Table on Pump and motor - Year-over-year growth 2023-2028 (%)
- Exhibits44: Chart on Valve - Market size and forecast 2023-2028 ($ million)
- Exhibits45: Data Table on Valve - Market size and forecast 2023-2028 ($ million)
- Exhibits46: Chart on Valve - Year-over-year growth 2023-2028 (%)
- Exhibits47: Data Table on Valve - Year-over-year growth 2023-2028 (%)
- Exhibits48: Chart on Cylinder - Market size and forecast 2023-2028 ($ million)
- Exhibits49: Data Table on Cylinder - Market size and forecast 2023-2028 ($ million)
- Exhibits50: Chart on Cylinder - Year-over-year growth 2023-2028 (%)
- Exhibits51: Data Table on Cylinder - Year-over-year growth 2023-2028 (%)
- Exhibits52: Chart on Others - Market size and forecast 2023-2028 ($ million)
- Exhibits53: Data Table on Others - Market size and forecast 2023-2028 ($ million)
- Exhibits54: Chart on Others - Year-over-year growth 2023-2028 (%)
- Exhibits55: Data Table on Others - Year-over-year growth 2023-2028 (%)
- Exhibits56: Market opportunity by Type ($ million)
- Exhibits57: Data Table on Market opportunity by Type ($ million)
- Exhibits58: Chart on End-user - Market share 2023-2028 (%)
- Exhibits59: Data Table on End-user - Market share 2023-2028 (%)
- Exhibits60: Chart on Comparison by End-user
- Exhibits61: Data Table on Comparison by End-user
- Exhibits62: Chart on Construction - Market size and forecast 2023-2028 ($ million)
- Exhibits63: Data Table on Construction - Market size and forecast 2023-2028 ($ million)
- Exhibits64: Chart on Construction - Year-over-year growth 2023-2028 (%)
- Exhibits65: Data Table on Construction - Year-over-year growth 2023-2028 (%)
- Exhibits66: Chart on Agriculture - Market size and forecast 2023-2028 ($ million)
- Exhibits67: Data Table on Agriculture - Market size and forecast 2023-2028 ($ million)
- Exhibits68: Chart on Agriculture - Year-over-year growth 2023-2028 (%)
- Exhibits69: Data Table on Agriculture - Year-over-year growth 2023-2028 (%)
- Exhibits70: Chart on Mining - Market size and forecast 2023-2028 ($ million)
- Exhibits71: Data Table on Mining - Market size and forecast 2023-2028 ($ million)
- Exhibits72: Chart on Mining - Year-over-year growth 2023-2028 (%)
- Exhibits73: Data Table on Mining - Year-over-year growth 2023-2028 (%)
- Exhibits74: Chart on Material handling - Market size and forecast 2023-2028 ($ million)
- Exhibits75: Data Table on Material handling - Market size and forecast 2023-2028 ($ million)
- Exhibits76: Chart on Material handling - Year-over-year growth 2023-2028 (%)
- Exhibits77: Data Table on Material handling - Year-over-year growth 2023-2028 (%)
- Exhibits78: Chart on Others - Market size and forecast 2023-2028 ($ million)
- Exhibits79: Data Table on Others - Market size and forecast 2023-2028 ($ million)
- Exhibits80: Chart on Others - Year-over-year growth 2023-2028 (%)
- Exhibits81: Data Table on Others - Year-over-year growth 2023-2028 (%)
- Exhibits82: Market opportunity by End-user ($ million)
- Exhibits83: Data Table on Market opportunity by End-user ($ million)
- Exhibits84: Analysis of price sensitivity, lifecycle, customer purchase basket, adoption rates, and purchase criteria
- Exhibits85: Chart on Market share By Geographical Landscape 2023-2028 (%)
- Exhibits86: Data Table on Market share By Geographical Landscape 2023-2028 (%)
- Exhibits87: Chart on Geographic comparison
- Exhibits88: Data Table on Geographic comparison
- Exhibits89: Chart on APAC - Market size and forecast 2023-2028 ($ million)
- Exhibits90: Data Table on APAC - Market size and forecast 2023-2028 ($ million)
- Exhibits91: Chart on APAC - Year-over-year growth 2023-2028 (%)
- Exhibits92: Data Table on APAC - Year-over-year growth 2023-2028 (%)
- Exhibits93: Chart on North America - Market size and forecast 2023-2028 ($ million)
- Exhibits94: Data Table on North America - Market size and forecast 2023-2028 ($ million)
- Exhibits95: Chart on North America - Year-over-year growth 2023-2028 (%)
- Exhibits96: Data Table on North America - Year-over-year growth 2023-2028 (%)
- Exhibits97: Chart on Europe - Market size and forecast 2023-2028 ($ million)
- Exhibits98: Data Table on Europe - Market size and forecast 2023-2028 ($ million)
- Exhibits99: Chart on Europe - Year-over-year growth 2023-2028 (%)
- Exhibits100: Data Table on Europe - Year-over-year growth 2023-2028 (%)
- Exhibits101: Chart on Middle East and Africa - Market size and forecast 2023-2028 ($ million)
- Exhibits102: Data Table on Middle East and Africa - Market size and forecast 2023-2028 ($ million)
- Exhibits103: Chart on Middle East and Africa - Year-over-year growth 2023-2028 (%)
- Exhibits104: Data Table on Middle East and Africa - Year-over-year growth 2023-2028 (%)
- Exhibits105: Chart on South America - Market size and forecast 2023-2028 ($ million)
- Exhibits106: Data Table on South America - Market size and forecast 2023-2028 ($ million)
- Exhibits107: Chart on South America - Year-over-year growth 2023-2028 (%)
- Exhibits108: Data Table on South America - Year-over-year growth 2023-2028 (%)
- Exhibits109: Chart on US - Market size and forecast 2023-2028 ($ million)
- Exhibits110: Data Table on US - Market size and forecast 2023-2028 ($ million)
- Exhibits111: Chart on US - Year-over-year growth 2023-2028 (%)
- Exhibits112: Data Table on US - Year-over-year growth 2023-2028 (%)
- Exhibits113: Chart on China - Market size and forecast 2023-2028 ($ million)
- Exhibits114: Data Table on China - Market size and forecast 2023-2028 ($ million)
- Exhibits115: Chart on China - Year-over-year growth 2023-2028 (%)
- Exhibits116: Data Table on China - Year-over-year growth 2023-2028 (%)
- Exhibits117: Chart on Germany - Market size and forecast 2023-2028 ($ million)
- Exhibits118: Data Table on Germany - Market size and forecast 2023-2028 ($ million)
- Exhibits119: Chart on Germany - Year-over-year growth 2023-2028 (%)
- Exhibits120: Data Table on Germany - Year-over-year growth 2023-2028 (%)
- Exhibits121: Chart on India - Market size and forecast 2023-2028 ($ million)
- Exhibits122: Data Table on India - Market size and forecast 2023-2028 ($ million)
- Exhibits123: Chart on India - Year-over-year growth 2023-2028 (%)
- Exhibits124: Data Table on India - Year-over-year growth 2023-2028 (%)
- Exhibits125: Chart on France - Market size and forecast 2023-2028 ($ million)
- Exhibits126: Data Table on France - Market size and forecast 2023-2028 ($ million)
- Exhibits127: Chart on France - Year-over-year growth 2023-2028 (%)
- Exhibits128: Data Table on France - Year-over-year growth 2023-2028 (%)
- Exhibits129: Chart on Japan - Market size and forecast 2023-2028 ($ million)
- Exhibits130: Data Table on Japan - Market size and forecast 2023-2028 ($ million)
- Exhibits131: Chart on Japan - Year-over-year growth 2023-2028 (%)
- Exhibits132: Data Table on Japan - Year-over-year growth 2023-2028 (%)
- Exhibits133: Chart on Canada - Market size and forecast 2023-2028 ($ million)
- Exhibits134: Data Table on Canada - Market size and forecast 2023-2028 ($ million)
- Exhibits135: Chart on Canada - Year-over-year growth 2023-2028 (%)
- Exhibits136: Data Table on Canada - Year-over-year growth 2023-2028 (%)
- Exhibits137: Chart on UK - Market size and forecast 2023-2028 ($ million)
- Exhibits138: Data Table on UK - Market size and forecast 2023-2028 ($ million)
- Exhibits139: Chart on UK - Year-over-year growth 2023-2028 (%)
- Exhibits140: Data Table on UK - Year-over-year growth 2023-2028 (%)
- Exhibits141: Chart on South Korea - Market size and forecast 2023-2028 ($ million)
- Exhibits142: Data Table on South Korea - Market size and forecast 2023-2028 ($ million)
- Exhibits143: Chart on South Korea - Year-over-year growth 2023-2028 (%)
- Exhibits144: Data Table on South Korea - Year-over-year growth 2023-2028 (%)
- Exhibits145: Chart on Brazil - Market size and forecast 2023-2028 ($ million)
- Exhibits146: Data Table on Brazil - Market size and forecast 2023-2028 ($ million)
- Exhibits147: Chart on Brazil - Year-over-year growth 2023-2028 (%)
- Exhibits148: Data Table on Brazil - Year-over-year growth 2023-2028 (%)
- Exhibits149: Market opportunity By Geographical Landscape ($ million)
- Exhibits150: Data Tables on Market opportunity By Geographical Landscape ($ million)
- Exhibits151: Impact of drivers and challenges in 2023 and 2028
- Exhibits152: Overview on criticality of inputs and factors of differentiation
- Exhibits153: Overview on factors of disruption
- Exhibits154: Impact of key risks on business
- Exhibits155: Companies covered
- Exhibits156: Company ranking index
- Exhibits157: Matrix on companies position and classification
- Exhibits158: Bosch Rexroth AG - Overview
- Exhibits159: Bosch Rexroth AG - Product / Service
- Exhibits160: Bosch Rexroth AG - Key offerings
- Exhibits161: SWOT
- Exhibits162: Bucher Hydraulics GmbH - Overview
- Exhibits163: Bucher Hydraulics GmbH - Product / Service
- Exhibits164: Bucher Hydraulics GmbH - Key offerings
- Exhibits165: SWOT
- Exhibits166: CASAPPA SpA - Overview
- Exhibits167: CASAPPA SpA - Product / Service
- Exhibits168: CASAPPA SpA - Key offerings
- Exhibits169: SWOT
- Exhibits170: Caterpillar Inc. - Overview
- Exhibits171: Caterpillar Inc. - Business segments
- Exhibits172: Caterpillar Inc. - Key news
- Exhibits173: Caterpillar Inc. - Key offerings
- Exhibits174: Caterpillar Inc. - Segment focus
- Exhibits175: SWOT
- Exhibits176: Danfoss AS - Overview
- Exhibits177: Danfoss AS - Product / Service
- Exhibits178: Danfoss AS - Key offerings
- Exhibits179: SWOT
- Exhibits180: Eaton Corp plc - Overview
- Exhibits181: Eaton Corp plc - Business segments
- Exhibits182: Eaton Corp plc - Key news
- Exhibits183: Eaton Corp plc - Key offerings
- Exhibits184: Eaton Corp plc - Segment focus
- Exhibits185: SWOT
- Exhibits186: Enerpac Tool Group Corp. - Overview
- Exhibits187: Enerpac Tool Group Corp. - Product / Service
- Exhibits188: Enerpac Tool Group Corp. - Key offerings
- Exhibits189: SWOT
- Exhibits190: HYDAC International GmbH - Overview
- Exhibits191: HYDAC International GmbH - Product / Service
- Exhibits192: HYDAC International GmbH - Key offerings
- Exhibits193: SWOT
- Exhibits194: Kawasaki Heavy Industries Ltd. - Overview
- Exhibits195: Kawasaki Heavy Industries Ltd. - Business segments
- Exhibits196: Kawasaki Heavy Industries Ltd. - Key offerings
- Exhibits197: Kawasaki Heavy Industries Ltd. - Segment focus
- Exhibits198: SWOT
- Exhibits199: KYB Corp. - Overview
- Exhibits200: KYB Corp. - Business segments
- Exhibits201: KYB Corp. - Key offerings
- Exhibits202: KYB Corp. - Segment focus
- Exhibits203: SWOT
- Exhibits204: Moog Inc. - Overview
- Exhibits205: Moog Inc. - Business segments
- Exhibits206: Moog Inc. - Key news
- Exhibits207: Moog Inc. - Key offerings
- Exhibits208: Moog Inc. - Segment focus
- Exhibits209: SWOT
- Exhibits210: PARKER HANNIFIN CORP. - Overview
- Exhibits211: PARKER HANNIFIN CORP. - Business segments
- Exhibits212: PARKER HANNIFIN CORP. - Key offerings
- Exhibits213: PARKER HANNIFIN CORP. - Segment focus
- Exhibits214: SWOT
- Exhibits215: SMC Corp. - Overview
- Exhibits216: SMC Corp. - Product / Service
- Exhibits217: SMC Corp. - Key offerings
- Exhibits218: SWOT
- Exhibits219: WEBER HYDRAULIK GmbH - Overview
- Exhibits220: WEBER HYDRAULIK GmbH - Product / Service
- Exhibits221: WEBER HYDRAULIK GmbH - Key offerings
- Exhibits222: SWOT
- Exhibits223: Wipro Infrastructure Engineering - Overview
- Exhibits224: Wipro Infrastructure Engineering - Product / Service
- Exhibits225: Wipro Infrastructure Engineering - Key offerings
- Exhibits226: SWOT
- Exhibits227: Inclusions checklist
- Exhibits228: Exclusions checklist
- Exhibits229: Currency conversion rates for US$
- Exhibits230: Research methodology
- Exhibits231: Information sources
- Exhibits232: Data validation
- Exhibits233: Validation techniques employed for market sizing
- Exhibits234: Data synthesis
- Exhibits235: 360 degree market analysis
- Exhibits236: List of abbreviations
Hydraulic Equipment For Mobile Applications Market 2024-2028
The hydraulic equipment for mobile applications market is forecasted to grow by USD 7061.7 mn during 2023-2028, accelerating at a CAGR of 5.6% during the forecast period. The report on the hydraulic equipment for mobile applications market provides a holistic analysis, market size and forecast, trends, growth drivers, and challenges, as well as vendor analysis covering around 25 vendors.
The report offers an up-to-date analysis regarding the current market scenario, the latest trends and drivers, and the overall market environment. The market is driven by increased government investment in infrastructure projects, growing mechanization of agriculture, and rising urbanization globally.
| Market Scope | |
|---|---|
| Base Year | 2024 |
| End Year | 2028 |
| Series Year | 2024-2028 |
| Growth Momentum | Accelerate |
| YOY 2024 | 5.4% |
| CAGR | 5.6% |
| Incremental Value | $7061.7 mn |
Technavio's hydraulic equipment for mobile applications market is segmented as below:
By Type
- Pump and motor
- Valve
- Cylinder
- Others
By End-user
- Construction
- Agriculture
- Mining
- Material handling
- Others
By Geographical Landscape
- APAC
- North America
- Europe
- Middle East and Africa
- South America
This study identifies the rising adoption of eco-friendly hydraulic fluids as one of the prime reasons driving the hydraulic equipment for mobile applications market growth during the next few years. Also, increasing focus of vendors on new product launches and growing shift toward compact hydraulic systems will lead to sizable demand in the market.
The report on the hydraulic equipment for mobile applications market covers the following areas:
- Hydraulic Equipment For Mobile Applications Market sizing
- Hydraulic Equipment For Mobile Applications Market forecast
- Hydraulic Equipment For Mobile Applications Market industry analysis
The robust vendor analysis is designed to help clients improve their market position, and in line with this, this report provides a detailed analysis of several leading hydraulic equipment for mobile applications market vendors that include Bosch Rexroth AG, Bucher Hydraulics GmbH, CASAPPA SpA, Caterpillar Inc., Danfoss AS, Eaton Corp plc, Enerpac Tool Group Corp., HANNON HYDRUALICS LLC, HAWE Hydraulik SE, HYDAC International GmbH, Kawasaki Heavy Industries Ltd., KYB Corp., Linde Hydraulics GmbH & Co. KG, Moog Inc., Pacoma GmbH, PARKER HANNIFIN CORP., SMC Corp., Texas Hydraulics Inc., WEBER HYDRAULIK GmbH, and Wipro Infrastructure Engineering. Also, the hydraulic equipment for mobile applications market analysis report includes information on upcoming trends and challenges that will influence market growth. This is to help companies strategize and leverage all forthcoming growth opportunities.
The study was conducted using an objective combination of primary and secondary information including inputs from key participants in the industry. The report contains a comprehensive market and vendor landscape in addition to an analysis of the key vendors.
The publisher presents a detailed picture of the market by the way of study, synthesis, and summation of data from multiple sources by an analysis of key parameters such as profit, pricing, competition, and promotions. It presents various market facets by identifying the key industry influencers. The data presented is comprehensive, reliable, and a result of extensive primary and secondary research. The market research reports provide a complete competitive landscape and an in-depth vendor selection methodology and analysis using qualitative and quantitative research to forecast accurate market growth.
Table of Contents
1 Executive Summary
- 1.1 Market overview
- Executive Summary - Chart on Market Overview
- Executive Summary - Data Table on Market Overview
- Executive Summary - Chart on Global Market Characteristics
- Executive Summary - Chart on Market By Geographical Landscape
- Executive Summary - Chart on Market Segmentation by Type
- Executive Summary - Chart on Market Segmentation by End-user
- Executive Summary - Chart on Incremental Growth
- Executive Summary - Data Table on Incremental Growth
- Executive Summary - Chart on Company Market Positioning
2 Technavio Analysis
- 2.1 Analysis of price sensitivity, lifecycle, customer purchase basket, adoption rates, and purchase criteria
- Analysis of price sensitivity, lifecycle, customer purchase basket, adoption rates, and purchase criteria
- 2.2 Criticality of inputs and Factors of differentiation
- Overview on criticality of inputs and factors of differentiation
- 2.3 Factors of disruption
- Overview on factors of disruption
- 2.4 Impact of drivers and challenges
- Impact of drivers and challenges in 2023 and 2028
3 Market Landscape
- 3.1 Market ecosystem
- Parent Market
- Data Table on - Parent Market
- 3.2 Market characteristics
- Market characteristics analysis
- 3.3 Value chain analysis
- Value Chain Analysis
4 Market Sizing
- 4.1 Market definition
- Offerings of companies included in the market definition
- 4.2 Market segment analysis
- Market segments
- 4.3 Market size 2023
- 4.4 Market outlook: Forecast for 2023-2028
- Chart on Global - Market size and forecast 2023-2028 ($ million)
- Data Table on Global - Market size and forecast 2023-2028 ($ million)
- Chart on Global Market: Year-over-year growth 2023-2028 (%)
- Data Table on Global Market: Year-over-year growth 2023-2028 (%)
5 Historic Market Size
- 5.1 Global Hydraulic Equipment Market For Mobile Applications 2018 - 2022
- Historic Market Size - Data Table on Global Hydraulic Equipment Market For Mobile Applications 2018 - 2022 ($ million)
- 5.2 Type segment analysis 2018 - 2022
- Historic Market Size - Type Segment 2018 - 2022 ($ million)
- 5.3 End-user segment analysis 2018 - 2022
- Historic Market Size - End-user Segment 2018 - 2022 ($ million)
- 5.4 Geography segment analysis 2018 - 2022
- Historic Market Size - Geography Segment 2018 - 2022 ($ million)
- 5.5 Country segment analysis 2018 - 2022
- Historic Market Size - Country Segment 2018 - 2022 ($ million)
6 Qualitative Analysis
- 6.1 Impact of AI on the global hydraulic equipment market for mobile applications
7 Five Forces Analysis
- 7.1 Five forces summary
- Five forces analysis - Comparison between 2023 and 2028
- 7.2 Bargaining power of buyers
- Bargaining power of buyers - Impact of key factors 2023 and 2028
- 7.3 Bargaining power of suppliers
- Bargaining power of suppliers - Impact of key factors in 2023 and 2028
- 7.4 Threat of new entrants
- Threat of new entrants - Impact of key factors in 2023 and 2028
- 7.5 Threat of substitutes
- Threat of substitutes - Impact of key factors in 2023 and 2028
- 7.6 Threat of rivalry
- Threat of rivalry - Impact of key factors in 2023 and 2028
- 7.7 Market condition
- Chart on Market condition - Five forces 2023 and 2028
8 Market Segmentation by Type
- 8.1 Market segments
- Chart on Type - Market share 2023-2028 (%)
- Data Table on Type - Market share 2023-2028 (%)
- 8.2 Comparison by Type
- Chart on Comparison by Type
- Data Table on Comparison by Type
- 8.3 Pump and motor - Market size and forecast 2023-2028
- Chart on Pump and motor - Market size and forecast 2023-2028 ($ million)
- Data Table on Pump and motor - Market size and forecast 2023-2028 ($ million)
- Chart on Pump and motor - Year-over-year growth 2023-2028 (%)
- Data Table on Pump and motor - Year-over-year growth 2023-2028 (%)
- 8.4 Valve - Market size and forecast 2023-2028
- Chart on Valve - Market size and forecast 2023-2028 ($ million)
- Data Table on Valve - Market size and forecast 2023-2028 ($ million)
- Chart on Valve - Year-over-year growth 2023-2028 (%)
- Data Table on Valve - Year-over-year growth 2023-2028 (%)
- 8.5 Cylinder - Market size and forecast 2023-2028
- Chart on Cylinder - Market size and forecast 2023-2028 ($ million)
- Data Table on Cylinder - Market size and forecast 2023-2028 ($ million)
- Chart on Cylinder - Year-over-year growth 2023-2028 (%)
- Data Table on Cylinder - Year-over-year growth 2023-2028 (%)
- 8.6 Others - Market size and forecast 2023-2028
- Chart on Others - Market size and forecast 2023-2028 ($ million)
- Data Table on Others - Market size and forecast 2023-2028 ($ million)
- Chart on Others - Year-over-year growth 2023-2028 (%)
- Data Table on Others - Year-over-year growth 2023-2028 (%)
- 8.7 Market opportunity by Type
- Market opportunity by Type ($ million)
- Data Table on Market opportunity by Type ($ million)
9 Market Segmentation by End-user
- 9.1 Market segments
- Chart on End-user - Market share 2023-2028 (%)
- Data Table on End-user - Market share 2023-2028 (%)
- 9.2 Comparison by End-user
- Chart on Comparison by End-user
- Data Table on Comparison by End-user
- 9.3 Construction - Market size and forecast 2023-2028
- Chart on Construction - Market size and forecast 2023-2028 ($ million)
- Data Table on Construction - Market size and forecast 2023-2028 ($ million)
- Chart on Construction - Year-over-year growth 2023-2028 (%)
- Data Table on Construction - Year-over-year growth 2023-2028 (%)
- 9.4 Agriculture - Market size and forecast 2023-2028
- Chart on Agriculture - Market size and forecast 2023-2028 ($ million)
- Data Table on Agriculture - Market size and forecast 2023-2028 ($ million)
- Chart on Agriculture - Year-over-year growth 2023-2028 (%)
- Data Table on Agriculture - Year-over-year growth 2023-2028 (%)
- 9.5 Mining - Market size and forecast 2023-2028
- Chart on Mining - Market size and forecast 2023-2028 ($ million)
- Data Table on Mining - Market size and forecast 2023-2028 ($ million)
- Chart on Mining - Year-over-year growth 2023-2028 (%)
- Data Table on Mining - Year-over-year growth 2023-2028 (%)
- 9.6 Material handling - Market size and forecast 2023-2028
- Chart on Material handling - Market size and forecast 2023-2028 ($ million)
- Data Table on Material handling - Market size and forecast 2023-2028 ($ million)
- Chart on Material handling - Year-over-year growth 2023-2028 (%)
- Data Table on Material handling - Year-over-year growth 2023-2028 (%)
- 9.7 Others - Market size and forecast 2023-2028
- Chart on Others - Market size and forecast 2023-2028 ($ million)
- Data Table on Others - Market size and forecast 2023-2028 ($ million)
- Chart on Others - Year-over-year growth 2023-2028 (%)
- Data Table on Others - Year-over-year growth 2023-2028 (%)
- 9.8 Market opportunity by End-user
- Market opportunity by End-user ($ million)
- Data Table on Market opportunity by End-user ($ million)
10 Customer Landscape
- 10.1 Customer landscape overview
- Analysis of price sensitivity, lifecycle, customer purchase basket, adoption rates, and purchase criteria
11 Geographic Landscape
- 11.1 Geographic segmentation
- Chart on Market share By Geographical Landscape 2023-2028 (%)
- Data Table on Market share By Geographical Landscape 2023-2028 (%)
- 11.2 Geographic comparison
- Chart on Geographic comparison
- Data Table on Geographic comparison
- 11.3 APAC - Market size and forecast 2023-2028
- Chart on APAC - Market size and forecast 2023-2028 ($ million)
- Data Table on APAC - Market size and forecast 2023-2028 ($ million)
- Chart on APAC - Year-over-year growth 2023-2028 (%)
- Data Table on APAC - Year-over-year growth 2023-2028 (%)
- 11.4 North America - Market size and forecast 2023-2028
- Chart on North America - Market size and forecast 2023-2028 ($ million)
- Data Table on North America - Market size and forecast 2023-2028 ($ million)
- Chart on North America - Year-over-year growth 2023-2028 (%)
- Data Table on North America - Year-over-year growth 2023-2028 (%)
- 11.5 Europe - Market size and forecast 2023-2028
- Chart on Europe - Market size and forecast 2023-2028 ($ million)
- Data Table on Europe - Market size and forecast 2023-2028 ($ million)
- Chart on Europe - Year-over-year growth 2023-2028 (%)
- Data Table on Europe - Year-over-year growth 2023-2028 (%)
- 11.6 Middle East and Africa - Market size and forecast 2023-2028
- Chart on Middle East and Africa - Market size and forecast 2023-2028 ($ million)
- Data Table on Middle East and Africa - Market size and forecast 2023-2028 ($ million)
- Chart on Middle East and Africa - Year-over-year growth 2023-2028 (%)
- Data Table on Middle East and Africa - Year-over-year growth 2023-2028 (%)
- 11.7 South America - Market size and forecast 2023-2028
- Chart on South America - Market size and forecast 2023-2028 ($ million)
- Data Table on South America - Market size and forecast 2023-2028 ($ million)
- Chart on South America - Year-over-year growth 2023-2028 (%)
- Data Table on South America - Year-over-year growth 2023-2028 (%)
- 11.8 US - Market size and forecast 2023-2028
- Chart on US - Market size and forecast 2023-2028 ($ million)
- Data Table on US - Market size and forecast 2023-2028 ($ million)
- Chart on US - Year-over-year growth 2023-2028 (%)
- Data Table on US - Year-over-year growth 2023-2028 (%)
- 11.9 China - Market size and forecast 2023-2028
- Chart on China - Market size and forecast 2023-2028 ($ million)
- Data Table on China - Market size and forecast 2023-2028 ($ million)
- Chart on China - Year-over-year growth 2023-2028 (%)
- Data Table on China - Year-over-year growth 2023-2028 (%)
- 11.10 Germany - Market size and forecast 2023-2028
- Chart on Germany - Market size and forecast 2023-2028 ($ million)
- Data Table on Germany - Market size and forecast 2023-2028 ($ million)
- Chart on Germany - Year-over-year growth 2023-2028 (%)
- Data Table on Germany - Year-over-year growth 2023-2028 (%)
- 11.11 India - Market size and forecast 2023-2028
- Chart on India - Market size and forecast 2023-2028 ($ million)
- Data Table on India - Market size and forecast 2023-2028 ($ million)
- Chart on India - Year-over-year growth 2023-2028 (%)
- Data Table on India - Year-over-year growth 2023-2028 (%)
- 11.12 France - Market size and forecast 2023-2028
- Chart on France - Market size and forecast 2023-2028 ($ million)
- Data Table on France - Market size and forecast 2023-2028 ($ million)
- Chart on France - Year-over-year growth 2023-2028 (%)
- Data Table on France - Year-over-year growth 2023-2028 (%)
- 11.13 Japan - Market size and forecast 2023-2028
- Chart on Japan - Market size and forecast 2023-2028 ($ million)
- Data Table on Japan - Market size and forecast 2023-2028 ($ million)
- Chart on Japan - Year-over-year growth 2023-2028 (%)
- Data Table on Japan - Year-over-year growth 2023-2028 (%)
- 11.14 Canada - Market size and forecast 2023-2028
- Chart on Canada - Market size and forecast 2023-2028 ($ million)
- Data Table on Canada - Market size and forecast 2023-2028 ($ million)
- Chart on Canada - Year-over-year growth 2023-2028 (%)
- Data Table on Canada - Year-over-year growth 2023-2028 (%)
- 11.15 UK - Market size and forecast 2023-2028
- Chart on UK - Market size and forecast 2023-2028 ($ million)
- Data Table on UK - Market size and forecast 2023-2028 ($ million)
- Chart on UK - Year-over-year growth 2023-2028 (%)
- Data Table on UK - Year-over-year growth 2023-2028 (%)
- 11.16 South Korea - Market size and forecast 2023-2028
- Chart on South Korea - Market size and forecast 2023-2028 ($ million)
- Data Table on South Korea - Market size and forecast 2023-2028 ($ million)
- Chart on South Korea - Year-over-year growth 2023-2028 (%)
- Data Table on South Korea - Year-over-year growth 2023-2028 (%)
- 11.17 Brazil - Market size and forecast 2023-2028
- Chart on Brazil - Market size and forecast 2023-2028 ($ million)
- Data Table on Brazil - Market size and forecast 2023-2028 ($ million)
- Chart on Brazil - Year-over-year growth 2023-2028 (%)
- Data Table on Brazil - Year-over-year growth 2023-2028 (%)
- 11.18 Market opportunity By Geographical Landscape
- Market opportunity By Geographical Landscape ($ million)
- Data Tables on Market opportunity By Geographical Landscape ($ million)
12 Drivers, Challenges, and Opportunity/Restraints
- 12.1 Market drivers
- 12.2 Market challenges
- 12.3 Impact of drivers and challenges
- Impact of drivers and challenges in 2023 and 2028
- 12.4 Market opportunities/restraints
13 Competitive Landscape
- 13.1 Overview
- 13.2 Competitive Landscape
- Overview on criticality of inputs and factors of differentiation
- 13.3 Landscape disruption
- Overview on factors of disruption
- 13.4 Industry risks
- Impact of key risks on business
14 Competitive Analysis
- 14.1 Companies profiled
- Companies covered
- 14.2 Company ranking index
- Company ranking index
- 14.3 Market positioning of companies
- Matrix on companies position and classification
- 14.4 Bosch Rexroth AG
- Bosch Rexroth AG - Overview
- Bosch Rexroth AG - Product / Service
- Bosch Rexroth AG - Key offerings
- SWOT
- 14.5 Bucher Hydraulics GmbH
- Bucher Hydraulics GmbH - Overview
- Bucher Hydraulics GmbH - Product / Service
- Bucher Hydraulics GmbH - Key offerings
- SWOT
- 14.6 CASAPPA SpA
- CASAPPA SpA - Overview
- CASAPPA SpA - Product / Service
- CASAPPA SpA - Key offerings
- SWOT
- 14.7 Caterpillar Inc.
- Caterpillar Inc. - Overview
- Caterpillar Inc. - Business segments
- Caterpillar Inc. - Key news
- Caterpillar Inc. - Key offerings
- Caterpillar Inc. - Segment focus
- SWOT
- 14.8 Danfoss AS
- Danfoss AS - Overview
- Danfoss AS - Product / Service
- Danfoss AS - Key offerings
- SWOT
- 14.9 Eaton Corp plc
- Eaton Corp plc - Overview
- Eaton Corp plc - Business segments
- Eaton Corp plc - Key news
- Eaton Corp plc - Key offerings
- Eaton Corp plc - Segment focus
- SWOT
- 14.10 Enerpac Tool Group Corp.
- Enerpac Tool Group Corp. - Overview
- Enerpac Tool Group Corp. - Product / Service
- Enerpac Tool Group Corp. - Key offerings
- SWOT
- 14.11 HYDAC International GmbH
- HYDAC International GmbH - Overview
- HYDAC International GmbH - Product / Service
- HYDAC International GmbH - Key offerings
- SWOT
- 14.12 Kawasaki Heavy Industries Ltd.
- Kawasaki Heavy Industries Ltd. - Overview
- Kawasaki Heavy Industries Ltd. - Business segments
- Kawasaki Heavy Industries Ltd. - Key offerings
- Kawasaki Heavy Industries Ltd. - Segment focus
- SWOT
- 14.13 KYB Corp.
- KYB Corp. - Overview
- KYB Corp. - Business segments
- KYB Corp. - Key offerings
- KYB Corp. - Segment focus
- SWOT
- 14.14 Moog Inc.
- Moog Inc. - Overview
- Moog Inc. - Business segments
- Moog Inc. - Key news
- Moog Inc. - Key offerings
- Moog Inc. - Segment focus
- SWOT
- 14.15 PARKER HANNIFIN CORP.
- PARKER HANNIFIN CORP. - Overview
- PARKER HANNIFIN CORP. - Business segments
- PARKER HANNIFIN CORP. - Key offerings
- PARKER HANNIFIN CORP. - Segment focus
- SWOT
- 14.16 SMC Corp.
- SMC Corp. - Overview
- SMC Corp. - Product / Service
- SMC Corp. - Key offerings
- SWOT
- 14.17 WEBER HYDRAULIK GmbH
- WEBER HYDRAULIK GmbH - Overview
- WEBER HYDRAULIK GmbH - Product / Service
- WEBER HYDRAULIK GmbH - Key offerings
- SWOT
- 14.18 Wipro Infrastructure Engineering
- Wipro Infrastructure Engineering - Overview
- Wipro Infrastructure Engineering - Product / Service
- Wipro Infrastructure Engineering - Key offerings
- SWOT
15 Appendix
- 15.1 Scope of the report
- 15.2 Inclusions and exclusions checklist
- Inclusions checklist
- Exclusions checklist
- 15.3 Currency conversion rates for US$
- Currency conversion rates for US$
- 15.4 Research methodology
- Research methodology
- 15.5 Data procurement
- Information sources
- 15.6 Data validation
- Data validation
- 15.7 Validation techniques employed for market sizing
- Validation techniques employed for market sizing
- 15.8 Data synthesis
- Data synthesis
- 15.9 360 degree market analysis
- 360 degree market analysis
- 15.10 List of abbreviations
- List of abbreviations
