|
|
市場調査レポート
商品コード
1604098
液体廃棄物管理の世界市場 (2024~2028年)Global Liquid Waste Management Market 2024-2028 |
||||||

|
|||||||
カスタマイズ可能
|
|||||||


| 液体廃棄物管理の世界市場 (2024~2028年) |
|
出版日: 2024年10月18日
発行: TechNavio
ページ情報: 英文 132 Pages
納期: 即納可能
|

全表示
- 概要
- 図表
- 目次
液体廃棄物管理市場 (2024~2028年)
液体廃棄物管理市場は2023-2028年に244億米ドル分拡大し、予測期間中に4.8%のCAGRで成長すると予測されます。当レポートでは、液体廃棄物管理市場の全体的な分析、市場規模・予測、動向、成長促進要因、課題、約25のベンダーを網羅したベンダー分析などを掲載しています。
当レポートでは、現在の市場シナリオ、最新動向と促進要因、市場環境全体に関する最新分析を提供しています。厳しい政府規制がメーカーに廃水処理の導入を迫っていること、清潔な水の供給に対する需要が増加していること、水危機に対する意識が高まっていることなどが市場を牽引しています。
| 市場範囲 | |
|---|---|
| 基準年 | 2024年 |
| 終了年 | 2028年 |
| 予測期間 | 2024~2028年 |
| 成長モメンタム | 加速 |
| 前年比 (2024年) | 4.3% |
| CAGR | 4.8% |
| 増分額 | 244億米ドル |
当レポートでは、今後数年間の液体廃棄物管理市場の成長を促進する主な要因の1つとして、水の無駄遣いキャンペーンを通じた水質汚染に対する意識の高まりを挙げています。また、インドで廃棄物管理のスタートアップが利益を上げていることや、スマートシティプロジェクトにおける先進技術の統合などが、市場の大きな需要につながると思われます。
目次
第1章 エグゼクティブサマリー
- 市場概要
第2章 市場情勢
- 市場エコシステム
- 市場の特徴
- バリューチェーン分析
第3章 市場規模
- 市場の定義
- 市場セグメント分析
- 市場規模 (2023年)
- 市場の見通し (2023~2028年)
第4章 市場規模実績
- 液体廃棄物管理の世界市場 (2018~2022年)
- 排出源別分析 (2018~2022年)
- 地域別分析 (2018~2022年)
- 国別分析 (2018~2022年)
第5章 ファイブフォース分析
- ファイブフォースの要約
- 買い手の交渉力
- 供給企業の交渉力
- 新規参入業者の脅威
- 代替品の脅威
- 競争の脅威
- 市況
第6章 市場セグメンテーション:排出源別
- 市場セグメント
- 比較:排出源別
- 産業用水:市場規模と予測 (2023~2028年)
- 都市用水:市場規模と予測 (2023~2028年)
- 市場機会:排出源別
第7章 顧客情勢
- 顧客情勢の概要
第8章 地域別情勢
- 地域別セグメンテーション
- 地域別比較
- アジア太平洋:市場規模と予測 (2023~2028年)
- 北米:市場規模と予測 (2023~2028年)
- 欧州:市場規模と予測 (2023~2028年)
- 中東・アフリカ:市場規模と予測 (2023~2028年)
- 南米:市場規模と予測 (2023~2028年)
- 中国:市場規模と予測 (2023~2028年)
- 米国:市場規模と予測 (2023~2028年)
- 日本:市場規模と予測 (2023~2028年)
- ドイツ:市場規模と予測 (2023~2028年)
- 英国:市場規模と予測 (2023~2028年)
- 市場機会:地域別
第9章 促進要因・課題・機会・抑制要因
- 市場促進要因
- 市場の課題
- 促進要因と課題の影響
- 市場の機会・抑制要因
第10章 競合情勢
- 概要
- 競合情勢
- 混乱の状況
- 業界のリスク
第11章 競合分析
- 企業プロファイル
- 企業の市場ポジショニング
- Clean Harbors Inc.
- Covanta Holding Corp.
- Envirogreen Ltd.
- Environmental Recovery Corp. of PA
- Heritage Crystal Clean Inc.
- Heritage Environmental Services LLC
- PROS Services Inc.
- Republic Services Inc.
- Veolia Environnement SA
- Whites Recycling Ltd.
第12章 付録
Exhibits:
- Exhibits1: Executive Summary - Chart on Market Overview
- Exhibits2: Executive Summary - Data Table on Market Overview
- Exhibits3: Executive Summary - Chart on Global Market Characteristics
- Exhibits4: Executive Summary - Chart on Market By Geographical Landscape
- Exhibits5: Executive Summary - Chart on Market Segmentation by Source
- Exhibits6: Executive Summary - Chart on Incremental Growth
- Exhibits7: Executive Summary - Data Table on Incremental Growth
- Exhibits8: Executive Summary - Chart on Company Market Positioning
- Exhibits9: Parent Market
- Exhibits10: Data Table on - Parent Market
- Exhibits11: Market characteristics analysis
- Exhibits12: Value Chain Analysis
- Exhibits13: Offerings of companies included in the market definition
- Exhibits14: Market segments
- Exhibits15: Chart on Global - Market size and forecast 2023-2028 ($ billion)
- Exhibits16: Data Table on Global - Market size and forecast 2023-2028 ($ billion)
- Exhibits17: Chart on Global Market: Year-over-year growth 2023-2028 (%)
- Exhibits18: Data Table on Global Market: Year-over-year growth 2023-2028 (%)
- Exhibits19: Historic Market Size - Data Table on Global Liquid Waste Management Market 2018 - 2022 ($ billion)
- Exhibits20: Historic Market Size - Source Segment 2018 - 2022 ($ billion)
- Exhibits21: Historic Market Size - Geography Segment 2018 - 2022 ($ billion)
- Exhibits22: Historic Market Size - Country Segment 2018 - 2022 ($ billion)
- Exhibits23: Five forces analysis - Comparison between 2023 and 2028
- Exhibits24: Bargaining power of buyers - Impact of key factors 2023 and 2028
- Exhibits25: Bargaining power of suppliers - Impact of key factors in 2023 and 2028
- Exhibits26: Threat of new entrants - Impact of key factors in 2023 and 2028
- Exhibits27: Threat of substitutes - Impact of key factors in 2023 and 2028
- Exhibits28: Threat of rivalry - Impact of key factors in 2023 and 2028
- Exhibits29: Chart on Market condition - Five forces 2023 and 2028
- Exhibits30: Chart on Source - Market share 2023-2028 (%)
- Exhibits31: Data Table on Source - Market share 2023-2028 (%)
- Exhibits32: Chart on Comparison by Source
- Exhibits33: Data Table on Comparison by Source
- Exhibits34: Chart on Industrial - Market size and forecast 2023-2028 ($ billion)
- Exhibits35: Data Table on Industrial - Market size and forecast 2023-2028 ($ billion)
- Exhibits36: Chart on Industrial - Year-over-year growth 2023-2028 (%)
- Exhibits37: Data Table on Industrial - Year-over-year growth 2023-2028 (%)
- Exhibits38: Chart on Municipal - Market size and forecast 2023-2028 ($ billion)
- Exhibits39: Data Table on Municipal - Market size and forecast 2023-2028 ($ billion)
- Exhibits40: Chart on Municipal - Year-over-year growth 2023-2028 (%)
- Exhibits41: Data Table on Municipal - Year-over-year growth 2023-2028 (%)
- Exhibits42: Market opportunity by Source ($ billion)
- Exhibits43: Data Table on Market opportunity by Source ($ billion)
- Exhibits44: Analysis of price sensitivity, lifecycle, customer purchase basket, adoption rates, and purchase criteria
- Exhibits45: Chart on Market share By Geographical Landscape 2023-2028 (%)
- Exhibits46: Data Table on Market share By Geographical Landscape 2023-2028 (%)
- Exhibits47: Chart on Geographic comparison
- Exhibits48: Data Table on Geographic comparison
- Exhibits49: Chart on APAC - Market size and forecast 2023-2028 ($ billion)
- Exhibits50: Data Table on APAC - Market size and forecast 2023-2028 ($ billion)
- Exhibits51: Chart on APAC - Year-over-year growth 2023-2028 (%)
- Exhibits52: Data Table on APAC - Year-over-year growth 2023-2028 (%)
- Exhibits53: Chart on North America - Market size and forecast 2023-2028 ($ billion)
- Exhibits54: Data Table on North America - Market size and forecast 2023-2028 ($ billion)
- Exhibits55: Chart on North America - Year-over-year growth 2023-2028 (%)
- Exhibits56: Data Table on North America - Year-over-year growth 2023-2028 (%)
- Exhibits57: Chart on Europe - Market size and forecast 2023-2028 ($ billion)
- Exhibits58: Data Table on Europe - Market size and forecast 2023-2028 ($ billion)
- Exhibits59: Chart on Europe - Year-over-year growth 2023-2028 (%)
- Exhibits60: Data Table on Europe - Year-over-year growth 2023-2028 (%)
- Exhibits61: Chart on Middle East and Africa - Market size and forecast 2023-2028 ($ billion)
- Exhibits62: Data Table on Middle East and Africa - Market size and forecast 2023-2028 ($ billion)
- Exhibits63: Chart on Middle East and Africa - Year-over-year growth 2023-2028 (%)
- Exhibits64: Data Table on Middle East and Africa - Year-over-year growth 2023-2028 (%)
- Exhibits65: Chart on South America - Market size and forecast 2023-2028 ($ billion)
- Exhibits66: Data Table on South America - Market size and forecast 2023-2028 ($ billion)
- Exhibits67: Chart on South America - Year-over-year growth 2023-2028 (%)
- Exhibits68: Data Table on South America - Year-over-year growth 2023-2028 (%)
- Exhibits69: Chart on China - Market size and forecast 2023-2028 ($ billion)
- Exhibits70: Data Table on China - Market size and forecast 2023-2028 ($ billion)
- Exhibits71: Chart on China - Year-over-year growth 2023-2028 (%)
- Exhibits72: Data Table on China - Year-over-year growth 2023-2028 (%)
- Exhibits73: Chart on US - Market size and forecast 2023-2028 ($ billion)
- Exhibits74: Data Table on US - Market size and forecast 2023-2028 ($ billion)
- Exhibits75: Chart on US - Year-over-year growth 2023-2028 (%)
- Exhibits76: Data Table on US - Year-over-year growth 2023-2028 (%)
- Exhibits77: Chart on Japan - Market size and forecast 2023-2028 ($ billion)
- Exhibits78: Data Table on Japan - Market size and forecast 2023-2028 ($ billion)
- Exhibits79: Chart on Japan - Year-over-year growth 2023-2028 (%)
- Exhibits80: Data Table on Japan - Year-over-year growth 2023-2028 (%)
- Exhibits81: Chart on Germany - Market size and forecast 2023-2028 ($ billion)
- Exhibits82: Data Table on Germany - Market size and forecast 2023-2028 ($ billion)
- Exhibits83: Chart on Germany - Year-over-year growth 2023-2028 (%)
- Exhibits84: Data Table on Germany - Year-over-year growth 2023-2028 (%)
- Exhibits85: Chart on UK - Market size and forecast 2023-2028 ($ billion)
- Exhibits86: Data Table on UK - Market size and forecast 2023-2028 ($ billion)
- Exhibits87: Chart on UK - Year-over-year growth 2023-2028 (%)
- Exhibits88: Data Table on UK - Year-over-year growth 2023-2028 (%)
- Exhibits89: Market opportunity By Geographical Landscape ($ billion)
- Exhibits90: Data Tables on Market opportunity By Geographical Landscape ($ billion)
- Exhibits91: Impact of drivers and challenges in 2023 and 2028
- Exhibits92: Overview on criticality of inputs and factors of differentiation
- Exhibits93: Overview on factors of disruption
- Exhibits94: Impact of key risks on business
- Exhibits95: Companies covered
- Exhibits96: Matrix on companies position and classification
- Exhibits97: Clean Harbors Inc. - Overview
- Exhibits98: Clean Harbors Inc. - Business segments
- Exhibits99: Clean Harbors Inc. - Key news
- Exhibits100: Clean Harbors Inc. - Key offerings
- Exhibits101: Clean Harbors Inc. - Segment focus
- Exhibits102: Covanta Holding Corp. - Overview
- Exhibits103: Covanta Holding Corp. - Product / Service
- Exhibits104: Covanta Holding Corp. - Key offerings
- Exhibits105: Envirogreen Ltd. - Overview
- Exhibits106: Envirogreen Ltd. - Product / Service
- Exhibits107: Envirogreen Ltd. - Key offerings
- Exhibits108: Environmental Recovery Corp. of PA - Overview
- Exhibits109: Environmental Recovery Corp. of PA - Product / Service
- Exhibits110: Environmental Recovery Corp. of PA - Key offerings
- Exhibits111: Heritage Crystal Clean Inc. - Overview
- Exhibits112: Heritage Crystal Clean Inc. - Product / Service
- Exhibits113: Heritage Crystal Clean Inc. - Key offerings
- Exhibits114: Heritage Environmental Services LLC - Overview
- Exhibits115: Heritage Environmental Services LLC - Product / Service
- Exhibits116: Heritage Environmental Services LLC - Key offerings
- Exhibits117: PROS Services Inc. - Overview
- Exhibits118: PROS Services Inc. - Product / Service
- Exhibits119: PROS Services Inc. - Key offerings
- Exhibits120: Republic Services Inc. - Overview
- Exhibits121: Republic Services Inc. - Business segments
- Exhibits122: Republic Services Inc. - Key offerings
- Exhibits123: Republic Services Inc. - Segment focus
- Exhibits124: Veolia Environnement SA - Overview
- Exhibits125: Veolia Environnement SA - Business segments
- Exhibits126: Veolia Environnement SA - Key news
- Exhibits127: Veolia Environnement SA - Key offerings
- Exhibits128: Veolia Environnement SA - Segment focus
- Exhibits129: Whites Recycling Ltd. - Overview
- Exhibits130: Whites Recycling Ltd. - Product / Service
- Exhibits131: Whites Recycling Ltd. - Key offerings
- Exhibits132: Inclusions checklist
- Exhibits133: Exclusions checklist
- Exhibits134: Currency conversion rates for US$
- Exhibits135: Research methodology
- Exhibits136: Information sources
- Exhibits137: Data validation
- Exhibits138: Validation techniques employed for market sizing
- Exhibits139: Data synthesis
- Exhibits140: 360 degree market analysis
- Exhibits141: List of abbreviations
Liquid Waste Management Market 2024-2028
The liquid waste management market is forecasted to grow by USD 24.4 bn during 2023-2028, accelerating at a CAGR of 4.8% during the forecast period. The report on the liquid waste management market provides a holistic analysis, market size and forecast, trends, growth drivers, and challenges, as well as vendor analysis covering around 25 vendors.
The report offers an up-to-date analysis regarding the current market scenario, the latest trends and drivers, and the overall market environment. The market is driven by stringent government regulations are forcing manufacturers to adopt wastewater treatment, increasing demand for clean water supply, and growing awareness about water crisis.
| Market Scope | |
|---|---|
| Base Year | 2024 |
| End Year | 2028 |
| Series Year | 2024-2028 |
| Growth Momentum | Accelerate |
| YOY 2024 | 4.3% |
| CAGR | 4.8% |
| Incremental Value | $24.4 bn |
Technavio's liquid waste management market is segmented as below:
By Source
- Industrial
- Municipal
By Geographical Landscape
- APAC
- North America
- Europe
- Middle East and Africa
- South America
This study identifies the rising awareness about water pollution through water wastage campaigns as one of the prime reasons driving the liquid waste management market growth during the next few years. Also, waste management start-ups are making profit in india and integration of advanced technologies in smart city projects will lead to sizable demand in the market.
The report on the liquid waste management market covers the following areas:
- Liquid Waste Management Market sizing
- Liquid Waste Management Market forecast
- Liquid Waste Management Market industry analysis
The robust vendor analysis is designed to help clients improve their market position, and in line with this, this report provides a detailed analysis of several leading liquid waste management market vendors that include Clean Harbors Inc., Cleanaway Waste Management Ltd., Covanta Holding Corp., Enva, Envirogreen Ltd., Environmental Recovery Corp. of PA, EWaste Disposal Inc., GFL Environmental Inc., Heritage Crystal Clean Inc., Heritage Environmental Services LLC, Hindustan Dorr Oliver Ltd., Hulsey Environmental Services Inc., Lamor Corp. Plc, PROS Services Inc., Republic Services Inc., RETHMANN SE and Co. KG, Russell Reid Waste Management, SUEZ SA, Veolia Environnement SA, and Whites Recycling Ltd.. Also, the liquid waste management market analysis report includes information on upcoming trends and challenges that will influence market growth. This is to help companies strategize and leverage all forthcoming growth opportunities.
The study was conducted using an objective combination of primary and secondary information including inputs from key participants in the industry. The report contains a comprehensive market and vendor landscape in addition to an analysis of the key vendors.
The publisher presents a detailed picture of the market by the way of study, synthesis, and summation of data from multiple sources by an analysis of key parameters such as profit, pricing, competition, and promotions. It presents various market facets by identifying the key industry influencers. The data presented is comprehensive, reliable, and a result of extensive primary and secondary research. The market research reports provide a complete competitive landscape and an in-depth vendor selection methodology and analysis using qualitative and quantitative research to forecast accurate market growth.
Table of Contents
1 Executive Summary
- 1.1 Market overview
- Executive Summary - Chart on Market Overview
- Executive Summary - Data Table on Market Overview
- Executive Summary - Chart on Global Market Characteristics
- Executive Summary - Chart on Market By Geographical Landscape
- Executive Summary - Chart on Market Segmentation by Source
- Executive Summary - Chart on Incremental Growth
- Executive Summary - Data Table on Incremental Growth
- Executive Summary - Chart on Company Market Positioning
2 Market Landscape
- 2.1 Market ecosystem
- Parent Market
- Data Table on - Parent Market
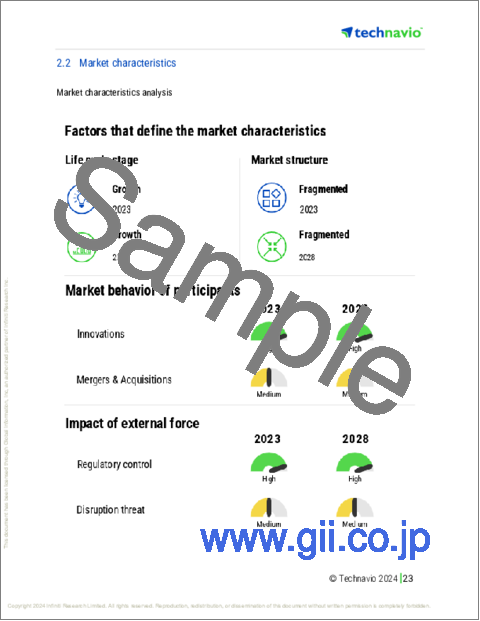
- 2.2 Market characteristics
- Market characteristics analysis
- 2.3 Value chain analysis
- Value Chain Analysis
3 Market Sizing
- 3.1 Market definition
- Offerings of companies included in the market definition
- 3.2 Market segment analysis
- Market segments
- 3.3 Market size 2023
- 3.4 Market outlook: Forecast for 2023-2028
- Chart on Global - Market size and forecast 2023-2028 ($ billion)
- Data Table on Global - Market size and forecast 2023-2028 ($ billion)
- Chart on Global Market: Year-over-year growth 2023-2028 (%)
- Data Table on Global Market: Year-over-year growth 2023-2028 (%)
4 Historic Market Size
- 4.1 Global Liquid Waste Management Market 2018 - 2022
- Historic Market Size - Data Table on Global Liquid Waste Management Market 2018 - 2022 ($ billion)
- 4.2 Source segment analysis 2018 - 2022
- Historic Market Size - Source Segment 2018 - 2022 ($ billion)
- 4.3 Geography segment analysis 2018 - 2022
- Historic Market Size - Geography Segment 2018 - 2022 ($ billion)
- 4.4 Country segment analysis 2018 - 2022
- Historic Market Size - Country Segment 2018 - 2022 ($ billion)
5 Five Forces Analysis
- 5.1 Five forces summary
- Five forces analysis - Comparison between 2023 and 2028
- 5.2 Bargaining power of buyers
- Bargaining power of buyers - Impact of key factors 2023 and 2028
- 5.3 Bargaining power of suppliers
- Bargaining power of suppliers - Impact of key factors in 2023 and 2028
- 5.4 Threat of new entrants
- Threat of new entrants - Impact of key factors in 2023 and 2028
- 5.5 Threat of substitutes
- Threat of substitutes - Impact of key factors in 2023 and 2028
- 5.6 Threat of rivalry
- Threat of rivalry - Impact of key factors in 2023 and 2028
- 5.7 Market condition
- Chart on Market condition - Five forces 2023 and 2028
6 Market Segmentation by Source
- 6.1 Market segments
- Chart on Source - Market share 2023-2028 (%)
- Data Table on Source - Market share 2023-2028 (%)
- 6.2 Comparison by Source
- Chart on Comparison by Source
- Data Table on Comparison by Source
- 6.3 Industrial - Market size and forecast 2023-2028
- Chart on Industrial - Market size and forecast 2023-2028 ($ billion)
- Data Table on Industrial - Market size and forecast 2023-2028 ($ billion)
- Chart on Industrial - Year-over-year growth 2023-2028 (%)
- Data Table on Industrial - Year-over-year growth 2023-2028 (%)
- 6.4 Municipal - Market size and forecast 2023-2028
- Chart on Municipal - Market size and forecast 2023-2028 ($ billion)
- Data Table on Municipal - Market size and forecast 2023-2028 ($ billion)
- Chart on Municipal - Year-over-year growth 2023-2028 (%)
- Data Table on Municipal - Year-over-year growth 2023-2028 (%)
- 6.5 Market opportunity by Source
- Market opportunity by Source ($ billion)
- Data Table on Market opportunity by Source ($ billion)
7 Customer Landscape
- 7.1 Customer landscape overview
- Analysis of price sensitivity, lifecycle, customer purchase basket, adoption rates, and purchase criteria
8 Geographic Landscape
- 8.1 Geographic segmentation
- Chart on Market share By Geographical Landscape 2023-2028 (%)
- Data Table on Market share By Geographical Landscape 2023-2028 (%)
- 8.2 Geographic comparison
- Chart on Geographic comparison
- Data Table on Geographic comparison
- 8.3 APAC - Market size and forecast 2023-2028
- Chart on APAC - Market size and forecast 2023-2028 ($ billion)
- Data Table on APAC - Market size and forecast 2023-2028 ($ billion)
- Chart on APAC - Year-over-year growth 2023-2028 (%)
- Data Table on APAC - Year-over-year growth 2023-2028 (%)
- 8.4 North America - Market size and forecast 2023-2028
- Chart on North America - Market size and forecast 2023-2028 ($ billion)
- Data Table on North America - Market size and forecast 2023-2028 ($ billion)
- Chart on North America - Year-over-year growth 2023-2028 (%)
- Data Table on North America - Year-over-year growth 2023-2028 (%)
- 8.5 Europe - Market size and forecast 2023-2028
- Chart on Europe - Market size and forecast 2023-2028 ($ billion)
- Data Table on Europe - Market size and forecast 2023-2028 ($ billion)
- Chart on Europe - Year-over-year growth 2023-2028 (%)
- Data Table on Europe - Year-over-year growth 2023-2028 (%)
- 8.6 Middle East and Africa - Market size and forecast 2023-2028
- Chart on Middle East and Africa - Market size and forecast 2023-2028 ($ billion)
- Data Table on Middle East and Africa - Market size and forecast 2023-2028 ($ billion)
- Chart on Middle East and Africa - Year-over-year growth 2023-2028 (%)
- Data Table on Middle East and Africa - Year-over-year growth 2023-2028 (%)
- 8.7 South America - Market size and forecast 2023-2028
- Chart on South America - Market size and forecast 2023-2028 ($ billion)
- Data Table on South America - Market size and forecast 2023-2028 ($ billion)
- Chart on South America - Year-over-year growth 2023-2028 (%)
- Data Table on South America - Year-over-year growth 2023-2028 (%)
- 8.8 China - Market size and forecast 2023-2028
- Chart on China - Market size and forecast 2023-2028 ($ billion)
- Data Table on China - Market size and forecast 2023-2028 ($ billion)
- Chart on China - Year-over-year growth 2023-2028 (%)
- Data Table on China - Year-over-year growth 2023-2028 (%)
- 8.9 US - Market size and forecast 2023-2028
- Chart on US - Market size and forecast 2023-2028 ($ billion)
- Data Table on US - Market size and forecast 2023-2028 ($ billion)
- Chart on US - Year-over-year growth 2023-2028 (%)
- Data Table on US - Year-over-year growth 2023-2028 (%)
- 8.10 Japan - Market size and forecast 2023-2028
- Chart on Japan - Market size and forecast 2023-2028 ($ billion)
- Data Table on Japan - Market size and forecast 2023-2028 ($ billion)
- Chart on Japan - Year-over-year growth 2023-2028 (%)
- Data Table on Japan - Year-over-year growth 2023-2028 (%)
- 8.11 Germany - Market size and forecast 2023-2028
- Chart on Germany - Market size and forecast 2023-2028 ($ billion)
- Data Table on Germany - Market size and forecast 2023-2028 ($ billion)
- Chart on Germany - Year-over-year growth 2023-2028 (%)
- Data Table on Germany - Year-over-year growth 2023-2028 (%)
- 8.12 UK - Market size and forecast 2023-2028
- Chart on UK - Market size and forecast 2023-2028 ($ billion)
- Data Table on UK - Market size and forecast 2023-2028 ($ billion)
- Chart on UK - Year-over-year growth 2023-2028 (%)
- Data Table on UK - Year-over-year growth 2023-2028 (%)
- 8.13 Market opportunity By Geographical Landscape
- Market opportunity By Geographical Landscape ($ billion)
- Data Tables on Market opportunity By Geographical Landscape ($ billion)
9 Drivers, Challenges, and Opportunity/Restraints
- 9.1 Market drivers
- 9.2 Market challenges
- 9.3 Impact of drivers and challenges
- Impact of drivers and challenges in 2023 and 2028
- 9.4 Market opportunities/restraints
10 Competitive Landscape
- 10.1 Overview
- 10.2 Competitive Landscape
- Overview on criticality of inputs and factors of differentiation
- 10.3 Landscape disruption
- Overview on factors of disruption
- 10.4 Industry risks
- Impact of key risks on business
11 Competitive Analysis
- 11.1 Companies profiled
- Companies covered
- 11.2 Market positioning of companies
- Matrix on companies position and classification
- 11.3 Clean Harbors Inc.
- Clean Harbors Inc. - Overview
- Clean Harbors Inc. - Business segments
- Clean Harbors Inc. - Key news
- Clean Harbors Inc. - Key offerings
- Clean Harbors Inc. - Segment focus
- 11.4 Covanta Holding Corp.
- Covanta Holding Corp. - Overview
- Covanta Holding Corp. - Product / Service
- Covanta Holding Corp. - Key offerings
- 11.5 Envirogreen Ltd.
- Envirogreen Ltd. - Overview
- Envirogreen Ltd. - Product / Service
- Envirogreen Ltd. - Key offerings
- 11.6 Environmental Recovery Corp. of PA
- Environmental Recovery Corp. of PA - Overview
- Environmental Recovery Corp. of PA - Product / Service
- Environmental Recovery Corp. of PA - Key offerings
- 11.7 Heritage Crystal Clean Inc.
- Heritage Crystal Clean Inc. - Overview
- Heritage Crystal Clean Inc. - Product / Service
- Heritage Crystal Clean Inc. - Key offerings
- 11.8 Heritage Environmental Services LLC
- Heritage Environmental Services LLC - Overview
- Heritage Environmental Services LLC - Product / Service
- Heritage Environmental Services LLC - Key offerings
- 11.9 PROS Services Inc.
- PROS Services Inc. - Overview
- PROS Services Inc. - Product / Service
- PROS Services Inc. - Key offerings
- 11.10 Republic Services Inc.
- Republic Services Inc. - Overview
- Republic Services Inc. - Business segments
- Republic Services Inc. - Key offerings
- Republic Services Inc. - Segment focus
- 11.11 Veolia Environnement SA
- Veolia Environnement SA - Overview
- Veolia Environnement SA - Business segments
- Veolia Environnement SA - Key news
- Veolia Environnement SA - Key offerings
- Veolia Environnement SA - Segment focus
- 11.12 Whites Recycling Ltd.
- Whites Recycling Ltd. - Overview
- Whites Recycling Ltd. - Product / Service
- Whites Recycling Ltd. - Key offerings
12 Appendix
- 12.1 Scope of the report
- 12.2 Inclusions and exclusions checklist
- Inclusions checklist
- Exclusions checklist
- 12.3 Currency conversion rates for US$
- Currency conversion rates for US$
- 12.4 Research methodology
- Research methodology
- 12.5 Data procurement
- Information sources
- 12.6 Data validation
- Data validation
- 12.7 Validation techniques employed for market sizing
- Validation techniques employed for market sizing
- 12.8 Data synthesis
- Data synthesis
- 12.9 360 degree market analysis
- 360 degree market analysis
- 12.10 List of abbreviations
- List of abbreviations
