|
|
市場調査レポート
商品コード
1604066
油圧式エレベーターの世界市場 (2024~2028年)Global Hydraulic Elevators Market 2024-2028 |
||||||

|
|||||||
カスタマイズ可能
|
|||||||

| 油圧式エレベーターの世界市場 (2024~2028年) |
|
出版日: 2024年10月19日
発行: TechNavio
ページ情報: 英文 147 Pages
納期: 即納可能
|

全表示
- 概要
- 図表
- 目次
油圧式エレベーター市場 (2024~2028年)
油圧式エレベーター市場は2023-2028年に5億9,510万米ドル分拡大し、予測期間中に1.4%のCAGRで成長すると予測されます。当レポートでは、油圧式エレベーター市場の全体的な分析、市場規模・予測、動向、成長促進要因、課題、約25のベンダーを網羅したベンダー分析などを掲載しています。
当レポートでは、現在の市場シナリオ、最新動向と促進要因、市場環境全体に関する最新分析を提供しています。牽引式エレベーターに比べて油圧式エレベーターの設置コストが低いことや、油圧式エレベーターは整備費用が低く安全性が高いこと、低・中層ビルで油圧式エレベーターが好まれるようになったことなどが市場を牽引しています。
| 市場範囲 | |
|---|---|
| 基準年 | 2024年 |
| 終了年 | 2028年 |
| 予測期間 | 2024~2028年 |
| 成長モメンタム | 加速 |
| 前年比 (2024年) | 1.3% |
| CAGR | 1.4% |
| 増分額 | 5億9,510万米ドル |
当レポートでは、油圧式無限リニアアクチュエータ (HILA) システムの開発が、今後数年間の油圧式エレベーター市場の成長を牽引する主要因の1つであるとしています。また、エレベーターの整備分野の進歩や、エレベーター部品の近代化に重点が置かれるようになることも、市場の大きな需要につながります。
目次
第1章 エグゼクティブサマリー
- 市場概要
第2章 市場情勢
- 市場エコシステム
- 市場の特徴
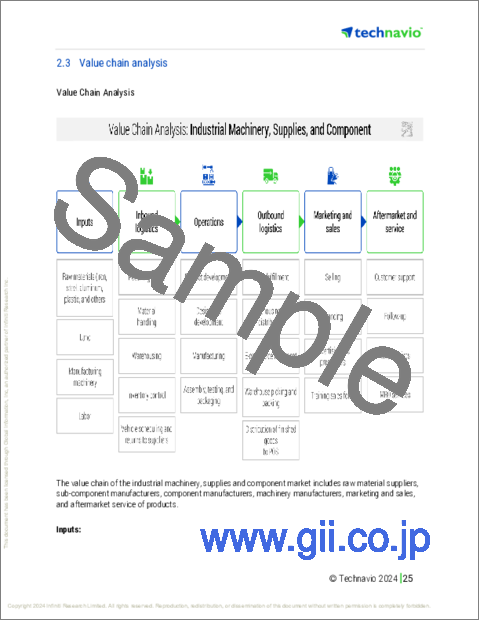
- バリューチェーン分析
第3章 市場規模
- 市場の定義
- 市場セグメント分析
- 市場規模 (2023年)
- 市場の見通し (2023~2028年)
第4章 市場規模実績
- 油圧式エレベーターの世界市場 (2018~2022年)
- 種類別分析 (2018~2022年)
- 地域別分析 (2018~2022年)
- 国別分析 (2018~2022年)
第5章 ファイブフォース分析
- ファイブフォースの要約
- 買い手の交渉力
- 供給企業の交渉力
- 新規参入業者の脅威
- 代替品の脅威
- 競争の脅威
- 市況
第6章 市場セグメンテーション:種類別
- 市場セグメント
- 比較:種類別
- 直接型油圧式エレベーター:市場規模と予測 (2023~2028年)
- 間接型油圧式エレベーター:市場規模と予測 (2023~2028年)
- ロープ型油圧式エレベーター:市場規模と予測 (2023~2028年)
- 市場機会:種類別
第7章 顧客情勢
- 顧客情勢の概要
第8章 地域別情勢
- 地域別セグメンテーション
- 地域別比較
- アジア太平洋:市場規模と予測 (2023~2028年)
- 欧州:市場規模と予測 (2023~2028年)
- 北米:市場規模と予測 (2023~2028年)
- 中東・アフリカ:市場規模と予測 (2023~2028年)
- 南米:市場規模と予測 (2023~2028年)
- 中国:市場規模と予測 (2023~2028年)
- ドイツ:市場規模と予測 (2023~2028年)
- 米国:市場規模と予測 (2023~2028年)
- 英国:市場規模と予測 (2023~2028年)
- インド:市場規模と予測 (2023~2028年)
- 市場機会:地域別
第9章 促進要因・課題・機会・抑制要因
- 市場促進要因
- 市場の課題
- 促進要因と課題の影響
- 市場の機会・抑制要因
第10章 競合情勢
- 概要
- 競合情勢
- 混乱の状況
- 業界のリスク
第11章 競合分析
- 企業プロファイル
- 企業の市場ポジショニング
- Bucher Industries AG
- CIRCOR International Inc.
- Delta Elevator Co. Ltd.
- Kleemann Hellas S.A.
- Mitsubishi Electric Corp.
- Otis Worldwide Corp.
- Schindler Holding Ltd.
- Schumacher Elevator Co.
- thyssenkrupp AG
- Vantage Elevation LLC
第12章 付録
Exhibits:
- Exhibits1: Executive Summary - Chart on Market Overview
- Exhibits2: Executive Summary - Data Table on Market Overview
- Exhibits3: Executive Summary - Chart on Global Market Characteristics
- Exhibits4: Executive Summary - Chart on Market By Geographical Landscape
- Exhibits5: Executive Summary - Chart on Market Segmentation by Type
- Exhibits6: Executive Summary - Chart on Incremental Growth
- Exhibits7: Executive Summary - Data Table on Incremental Growth
- Exhibits8: Executive Summary - Chart on Company Market Positioning
- Exhibits9: Parent Market
- Exhibits10: Data Table on - Parent Market
- Exhibits11: Market characteristics analysis
- Exhibits12: Value Chain Analysis
- Exhibits13: Offerings of companies included in the market definition
- Exhibits14: Market segments
- Exhibits15: Chart on Global - Market size and forecast 2023-2028 ($ million)
- Exhibits16: Data Table on Global - Market size and forecast 2023-2028 ($ million)
- Exhibits17: Chart on Global Market: Year-over-year growth 2023-2028 (%)
- Exhibits18: Data Table on Global Market: Year-over-year growth 2023-2028 (%)
- Exhibits19: Historic Market Size - Data Table on Global Hydraulic Elevators Market 2018 - 2022 ($ million)
- Exhibits20: Historic Market Size - Type Segment 2018 - 2022 ($ million)
- Exhibits21: Historic Market Size - Geography Segment 2018 - 2022 ($ million)
- Exhibits22: Historic Market Size - Country Segment 2018 - 2022 ($ million)
- Exhibits23: Five forces analysis - Comparison between 2023 and 2028
- Exhibits24: Bargaining power of buyers - Impact of key factors 2023 and 2028
- Exhibits25: Bargaining power of suppliers - Impact of key factors in 2023 and 2028
- Exhibits26: Threat of new entrants - Impact of key factors in 2023 and 2028
- Exhibits27: Threat of substitutes - Impact of key factors in 2023 and 2028
- Exhibits28: Threat of rivalry - Impact of key factors in 2023 and 2028
- Exhibits29: Chart on Market condition - Five forces 2023 and 2028
- Exhibits30: Chart on Type - Market share 2023-2028 (%)
- Exhibits31: Data Table on Type - Market share 2023-2028 (%)
- Exhibits32: Chart on Comparison by Type
- Exhibits33: Data Table on Comparison by Type
- Exhibits34: Chart on Hole-less hydraulic elevators - Market size and forecast 2023-2028 ($ million)
- Exhibits35: Data Table on Hole-less hydraulic elevators - Market size and forecast 2023-2028 ($ million)
- Exhibits36: Chart on Hole-less hydraulic elevators - Year-over-year growth 2023-2028 (%)
- Exhibits37: Data Table on Hole-less hydraulic elevators - Year-over-year growth 2023-2028 (%)
- Exhibits38: Chart on Holed hydraulic elevators - Market size and forecast 2023-2028 ($ million)
- Exhibits39: Data Table on Holed hydraulic elevators - Market size and forecast 2023-2028 ($ million)
- Exhibits40: Chart on Holed hydraulic elevators - Year-over-year growth 2023-2028 (%)
- Exhibits41: Data Table on Holed hydraulic elevators - Year-over-year growth 2023-2028 (%)
- Exhibits42: Chart on Roped hydraulic elevators - Market size and forecast 2023-2028 ($ million)
- Exhibits43: Data Table on Roped hydraulic elevators - Market size and forecast 2023-2028 ($ million)
- Exhibits44: Chart on Roped hydraulic elevators - Year-over-year growth 2023-2028 (%)
- Exhibits45: Data Table on Roped hydraulic elevators - Year-over-year growth 2023-2028 (%)
- Exhibits46: Market opportunity by Type ($ million)
- Exhibits47: Data Table on Market opportunity by Type ($ million)
- Exhibits48: Analysis of price sensitivity, lifecycle, customer purchase basket, adoption rates, and purchase criteria
- Exhibits49: Chart on Market share By Geographical Landscape 2023-2028 (%)
- Exhibits50: Data Table on Market share By Geographical Landscape 2023-2028 (%)
- Exhibits51: Chart on Geographic comparison
- Exhibits52: Data Table on Geographic comparison
- Exhibits53: Chart on APAC - Market size and forecast 2023-2028 ($ million)
- Exhibits54: Data Table on APAC - Market size and forecast 2023-2028 ($ million)
- Exhibits55: Chart on APAC - Year-over-year growth 2023-2028 (%)
- Exhibits56: Data Table on APAC - Year-over-year growth 2023-2028 (%)
- Exhibits57: Chart on Europe - Market size and forecast 2023-2028 ($ million)
- Exhibits58: Data Table on Europe - Market size and forecast 2023-2028 ($ million)
- Exhibits59: Chart on Europe - Year-over-year growth 2023-2028 (%)
- Exhibits60: Data Table on Europe - Year-over-year growth 2023-2028 (%)
- Exhibits61: Chart on North America - Market size and forecast 2023-2028 ($ million)
- Exhibits62: Data Table on North America - Market size and forecast 2023-2028 ($ million)
- Exhibits63: Chart on North America - Year-over-year growth 2023-2028 (%)
- Exhibits64: Data Table on North America - Year-over-year growth 2023-2028 (%)
- Exhibits65: Chart on Middle East and Africa - Market size and forecast 2023-2028 ($ million)
- Exhibits66: Data Table on Middle East and Africa - Market size and forecast 2023-2028 ($ million)
- Exhibits67: Chart on Middle East and Africa - Year-over-year growth 2023-2028 (%)
- Exhibits68: Data Table on Middle East and Africa - Year-over-year growth 2023-2028 (%)
- Exhibits69: Chart on South America - Market size and forecast 2023-2028 ($ million)
- Exhibits70: Data Table on South America - Market size and forecast 2023-2028 ($ million)
- Exhibits71: Chart on South America - Year-over-year growth 2023-2028 (%)
- Exhibits72: Data Table on South America - Year-over-year growth 2023-2028 (%)
- Exhibits73: Chart on China - Market size and forecast 2023-2028 ($ million)
- Exhibits74: Data Table on China - Market size and forecast 2023-2028 ($ million)
- Exhibits75: Chart on China - Year-over-year growth 2023-2028 (%)
- Exhibits76: Data Table on China - Year-over-year growth 2023-2028 (%)
- Exhibits77: Chart on Germany - Market size and forecast 2023-2028 ($ million)
- Exhibits78: Data Table on Germany - Market size and forecast 2023-2028 ($ million)
- Exhibits79: Chart on Germany - Year-over-year growth 2023-2028 (%)
- Exhibits80: Data Table on Germany - Year-over-year growth 2023-2028 (%)
- Exhibits81: Chart on US - Market size and forecast 2023-2028 ($ million)
- Exhibits82: Data Table on US - Market size and forecast 2023-2028 ($ million)
- Exhibits83: Chart on US - Year-over-year growth 2023-2028 (%)
- Exhibits84: Data Table on US - Year-over-year growth 2023-2028 (%)
- Exhibits85: Chart on UK - Market size and forecast 2023-2028 ($ million)
- Exhibits86: Data Table on UK - Market size and forecast 2023-2028 ($ million)
- Exhibits87: Chart on UK - Year-over-year growth 2023-2028 (%)
- Exhibits88: Data Table on UK - Year-over-year growth 2023-2028 (%)
- Exhibits89: Chart on India - Market size and forecast 2023-2028 ($ million)
- Exhibits90: Data Table on India - Market size and forecast 2023-2028 ($ million)
- Exhibits91: Chart on India - Year-over-year growth 2023-2028 (%)
- Exhibits92: Data Table on India - Year-over-year growth 2023-2028 (%)
- Exhibits93: Market opportunity By Geographical Landscape ($ million)
- Exhibits94: Data Tables on Market opportunity By Geographical Landscape ($ million)
- Exhibits95: Impact of drivers and challenges in 2023 and 2028
- Exhibits96: Overview on criticality of inputs and factors of differentiation
- Exhibits97: Overview on factors of disruption
- Exhibits98: Impact of key risks on business
- Exhibits99: Companies covered
- Exhibits100: Matrix on companies position and classification
- Exhibits101: Bucher Industries AG - Overview
- Exhibits102: Bucher Industries AG - Business segments
- Exhibits103: Bucher Industries AG - Key offerings
- Exhibits104: Bucher Industries AG - Segment focus
- Exhibits105: CIRCOR International Inc. - Overview
- Exhibits106: CIRCOR International Inc. - Business segments
- Exhibits107: CIRCOR International Inc. - Key offerings
- Exhibits108: CIRCOR International Inc. - Segment focus
- Exhibits109: Delta Elevator Co. Ltd. - Overview
- Exhibits110: Delta Elevator Co. Ltd. - Product / Service
- Exhibits111: Delta Elevator Co. Ltd. - Key offerings
- Exhibits112: Kleemann Hellas S.A. - Overview
- Exhibits113: Kleemann Hellas S.A. - Product / Service
- Exhibits114: Kleemann Hellas S.A. - Key offerings
- Exhibits115: Mitsubishi Electric Corp. - Overview
- Exhibits116: Mitsubishi Electric Corp. - Business segments
- Exhibits117: Mitsubishi Electric Corp. - Key offerings
- Exhibits118: Mitsubishi Electric Corp. - Segment focus
- Exhibits119: Otis Worldwide Corp. - Overview
- Exhibits120: Otis Worldwide Corp. - Business segments
- Exhibits121: Otis Worldwide Corp. - Key offerings
- Exhibits122: Otis Worldwide Corp. - Segment focus
- Exhibits123: Schindler Holding Ltd. - Overview
- Exhibits124: Schindler Holding Ltd. - Product / Service
- Exhibits125: Schindler Holding Ltd. - Key offerings
- Exhibits126: Schumacher Elevator Co. - Overview
- Exhibits127: Schumacher Elevator Co. - Product / Service
- Exhibits128: Schumacher Elevator Co. - Key offerings
- Exhibits129: thyssenkrupp AG - Overview
- Exhibits130: thyssenkrupp AG - Business segments
- Exhibits131: thyssenkrupp AG - Key news
- Exhibits132: thyssenkrupp AG - Key offerings
- Exhibits133: thyssenkrupp AG - Segment focus
- Exhibits134: Vantage Elevation LLC - Overview
- Exhibits135: Vantage Elevation LLC - Product / Service
- Exhibits136: Vantage Elevation LLC - Key offerings
- Exhibits137: Inclusions checklist
- Exhibits138: Exclusions checklist
- Exhibits139: Currency conversion rates for US$
- Exhibits140: Research methodology
- Exhibits141: Information sources
- Exhibits142: Data validation
- Exhibits143: Validation techniques employed for market sizing
- Exhibits144: Data synthesis
- Exhibits145: 360 degree market analysis
- Exhibits146: List of abbreviations
Hydraulic Elevators Market 2024-2028
The hydraulic elevators market is forecasted to grow by USD 595.1 mn during 2023-2028, accelerating at a CAGR of 1.4% during the forecast period. The report on the hydraulic elevators market provides a holistic analysis, market size and forecast, trends, growth drivers, and challenges, as well as vendor analysis covering around 25 vendors.
The report offers an up-to-date analysis regarding the current market scenario, the latest trends and drivers, and the overall market environment. The market is driven by lesser installation cost of hydraulic elevators compared to traction elevators, lower maintenance expenses and higher safety of hydraulic elevators, and increase in preference for hydraulic elevators in low- and mid-rise buildings.
| Market Scope | |
|---|---|
| Base Year | 2024 |
| End Year | 2028 |
| Series Year | 2024-2028 |
| Growth Momentum | Accelerate |
| YOY 2024 | 1.3% |
| CAGR | 1.4% |
| Incremental Value | $595.1 mn |
Technavio's hydraulic elevators market is segmented as below:
By Type
- Hole-less hydraulic elevators
- Holed hydraulic elevators
- Roped hydraulic elevators
By Geographical Landscape
- APAC
- Europe
- North America
- Middle East and Africa
- South America
This study identifies the development of hydraulic infinite linear actuator (HILA) system as one of the prime reasons driving the hydraulic elevators market growth during the next few years. Also, advances in field of elevator maintenance and growing emphasis on modernizing elevator components will lead to sizable demand in the market.
The report on the hydraulic elevators market covers the following areas:
- Hydraulic Elevators Market sizing
- Hydraulic Elevators Market forecast
- Hydraulic Elevators Market industry analysis
The robust vendor analysis is designed to help clients improve their market position, and in line with this, this report provides a detailed analysis of several leading hydraulic elevators market vendors that include Advance Lifts Inc., Bonsdag Industries Pvt. Ltd., Bucher Industries AG, CIRCOR International Inc., Custom Elevator Manufacturing Inc., Delta Elevator Co. Ltd., GMV Polska Sp. z o.o., Kleemann Hellas S.A., Mahe Lifts, Mitsubishi Electric Corp., Modern Elevator Innovations, Morris Vermaport Ltd., Otis Worldwide Corp., PFlow Industries Inc., Schindler Holding Ltd., Schumacher Elevator Co., thyssenkrupp AG, Vantage Elevation LLC, VRS Elevators Pvt. Ltd., and Waupaca Elevator Co.. Also, the hydraulic elevators market analysis report includes information on upcoming trends and challenges that will influence market growth. This is to help companies strategize and leverage all forthcoming growth opportunities.
The study was conducted using an objective combination of primary and secondary information including inputs from key participants in the industry. The report contains a comprehensive market and vendor landscape in addition to an analysis of the key vendors.
The publisher presents a detailed picture of the market by the way of study, synthesis, and summation of data from multiple sources by an analysis of key parameters such as profit, pricing, competition, and promotions. It presents various market facets by identifying the key industry influencers. The data presented is comprehensive, reliable, and a result of extensive primary and secondary research. The market research reports provide a complete competitive landscape and an in-depth vendor selection methodology and analysis using qualitative and quantitative research to forecast accurate market growth.
Table of Contents
1 Executive Summary
- 1.1 Market overview
- Executive Summary - Chart on Market Overview
- Executive Summary - Data Table on Market Overview
- Executive Summary - Chart on Global Market Characteristics
- Executive Summary - Chart on Market By Geographical Landscape
- Executive Summary - Chart on Market Segmentation by Type
- Executive Summary - Chart on Incremental Growth
- Executive Summary - Data Table on Incremental Growth
- Executive Summary - Chart on Company Market Positioning
2 Market Landscape
- 2.1 Market ecosystem
- Parent Market
- Data Table on - Parent Market
- 2.2 Market characteristics
- Market characteristics analysis
- 2.3 Value chain analysis
- Value Chain Analysis
3 Market Sizing
- 3.1 Market definition
- Offerings of companies included in the market definition
- 3.2 Market segment analysis
- Market segments
- 3.3 Market size 2023
- 3.4 Market outlook: Forecast for 2023-2028
- Chart on Global - Market size and forecast 2023-2028 ($ million)
- Data Table on Global - Market size and forecast 2023-2028 ($ million)
- Chart on Global Market: Year-over-year growth 2023-2028 (%)
- Data Table on Global Market: Year-over-year growth 2023-2028 (%)
4 Historic Market Size
- 4.1 Global Hydraulic Elevators Market 2018 - 2022
- Historic Market Size - Data Table on Global Hydraulic Elevators Market 2018 - 2022 ($ million)
- 4.2 Type segment analysis 2018 - 2022
- Historic Market Size - Type Segment 2018 - 2022 ($ million)
- 4.3 Geography segment analysis 2018 - 2022
- Historic Market Size - Geography Segment 2018 - 2022 ($ million)
- 4.4 Country segment analysis 2018 - 2022
- Historic Market Size - Country Segment 2018 - 2022 ($ million)
5 Five Forces Analysis
- 5.1 Five forces summary
- Five forces analysis - Comparison between 2023 and 2028
- 5.2 Bargaining power of buyers
- Bargaining power of buyers - Impact of key factors 2023 and 2028
- 5.3 Bargaining power of suppliers
- Bargaining power of suppliers - Impact of key factors in 2023 and 2028
- 5.4 Threat of new entrants
- Threat of new entrants - Impact of key factors in 2023 and 2028
- 5.5 Threat of substitutes
- Threat of substitutes - Impact of key factors in 2023 and 2028
- 5.6 Threat of rivalry
- Threat of rivalry - Impact of key factors in 2023 and 2028
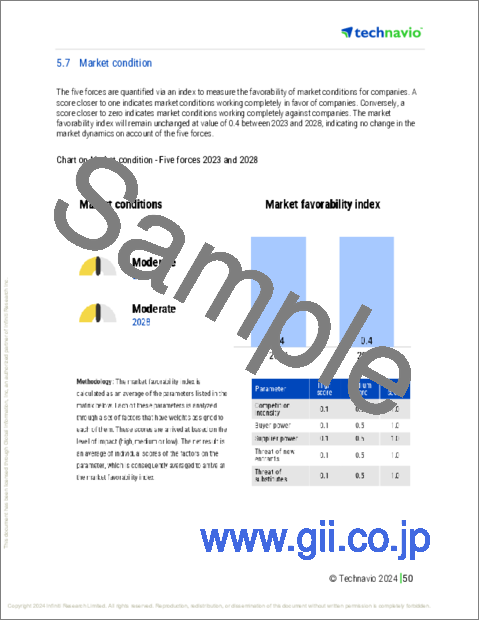
- 5.7 Market condition
- Chart on Market condition - Five forces 2023 and 2028
6 Market Segmentation by Type
- 6.1 Market segments
- Chart on Type - Market share 2023-2028 (%)
- Data Table on Type - Market share 2023-2028 (%)
- 6.2 Comparison by Type
- Chart on Comparison by Type
- Data Table on Comparison by Type
- 6.3 Hole-less hydraulic elevators - Market size and forecast 2023-2028
- Chart on Hole-less hydraulic elevators - Market size and forecast 2023-2028 ($ million)
- Data Table on Hole-less hydraulic elevators - Market size and forecast 2023-2028 ($ million)
- Chart on Hole-less hydraulic elevators - Year-over-year growth 2023-2028 (%)
- Data Table on Hole-less hydraulic elevators - Year-over-year growth 2023-2028 (%)
- 6.4 Holed hydraulic elevators - Market size and forecast 2023-2028
- Chart on Holed hydraulic elevators - Market size and forecast 2023-2028 ($ million)
- Data Table on Holed hydraulic elevators - Market size and forecast 2023-2028 ($ million)
- Chart on Holed hydraulic elevators - Year-over-year growth 2023-2028 (%)
- Data Table on Holed hydraulic elevators - Year-over-year growth 2023-2028 (%)
- 6.5 Roped hydraulic elevators - Market size and forecast 2023-2028
- Chart on Roped hydraulic elevators - Market size and forecast 2023-2028 ($ million)
- Data Table on Roped hydraulic elevators - Market size and forecast 2023-2028 ($ million)
- Chart on Roped hydraulic elevators - Year-over-year growth 2023-2028 (%)
- Data Table on Roped hydraulic elevators - Year-over-year growth 2023-2028 (%)
- 6.6 Market opportunity by Type
- Market opportunity by Type ($ million)
- Data Table on Market opportunity by Type ($ million)
7 Customer Landscape
- 7.1 Customer landscape overview
- Analysis of price sensitivity, lifecycle, customer purchase basket, adoption rates, and purchase criteria
8 Geographic Landscape
- 8.1 Geographic segmentation
- Chart on Market share By Geographical Landscape 2023-2028 (%)
- Data Table on Market share By Geographical Landscape 2023-2028 (%)
- 8.2 Geographic comparison
- Chart on Geographic comparison
- Data Table on Geographic comparison
- 8.3 APAC - Market size and forecast 2023-2028
- Chart on APAC - Market size and forecast 2023-2028 ($ million)
- Data Table on APAC - Market size and forecast 2023-2028 ($ million)
- Chart on APAC - Year-over-year growth 2023-2028 (%)
- Data Table on APAC - Year-over-year growth 2023-2028 (%)
- 8.4 Europe - Market size and forecast 2023-2028
- Chart on Europe - Market size and forecast 2023-2028 ($ million)
- Data Table on Europe - Market size and forecast 2023-2028 ($ million)
- Chart on Europe - Year-over-year growth 2023-2028 (%)
- Data Table on Europe - Year-over-year growth 2023-2028 (%)
- 8.5 North America - Market size and forecast 2023-2028
- Chart on North America - Market size and forecast 2023-2028 ($ million)
- Data Table on North America - Market size and forecast 2023-2028 ($ million)
- Chart on North America - Year-over-year growth 2023-2028 (%)
- Data Table on North America - Year-over-year growth 2023-2028 (%)
- 8.6 Middle East and Africa - Market size and forecast 2023-2028
- Chart on Middle East and Africa - Market size and forecast 2023-2028 ($ million)
- Data Table on Middle East and Africa - Market size and forecast 2023-2028 ($ million)
- Chart on Middle East and Africa - Year-over-year growth 2023-2028 (%)
- Data Table on Middle East and Africa - Year-over-year growth 2023-2028 (%)
- 8.7 South America - Market size and forecast 2023-2028
- Chart on South America - Market size and forecast 2023-2028 ($ million)
- Data Table on South America - Market size and forecast 2023-2028 ($ million)
- Chart on South America - Year-over-year growth 2023-2028 (%)
- Data Table on South America - Year-over-year growth 2023-2028 (%)
- 8.8 China - Market size and forecast 2023-2028
- Chart on China - Market size and forecast 2023-2028 ($ million)
- Data Table on China - Market size and forecast 2023-2028 ($ million)
- Chart on China - Year-over-year growth 2023-2028 (%)
- Data Table on China - Year-over-year growth 2023-2028 (%)
- 8.9 Germany - Market size and forecast 2023-2028
- Chart on Germany - Market size and forecast 2023-2028 ($ million)
- Data Table on Germany - Market size and forecast 2023-2028 ($ million)
- Chart on Germany - Year-over-year growth 2023-2028 (%)
- Data Table on Germany - Year-over-year growth 2023-2028 (%)
- 8.10 US - Market size and forecast 2023-2028
- Chart on US - Market size and forecast 2023-2028 ($ million)
- Data Table on US - Market size and forecast 2023-2028 ($ million)
- Chart on US - Year-over-year growth 2023-2028 (%)
- Data Table on US - Year-over-year growth 2023-2028 (%)
- 8.11 UK - Market size and forecast 2023-2028
- Chart on UK - Market size and forecast 2023-2028 ($ million)
- Data Table on UK - Market size and forecast 2023-2028 ($ million)
- Chart on UK - Year-over-year growth 2023-2028 (%)
- Data Table on UK - Year-over-year growth 2023-2028 (%)
- 8.12 India - Market size and forecast 2023-2028
- Chart on India - Market size and forecast 2023-2028 ($ million)
- Data Table on India - Market size and forecast 2023-2028 ($ million)
- Chart on India - Year-over-year growth 2023-2028 (%)
- Data Table on India - Year-over-year growth 2023-2028 (%)
- 8.13 Market opportunity By Geographical Landscape
- Market opportunity By Geographical Landscape ($ million)
- Data Tables on Market opportunity By Geographical Landscape ($ million)
9 Drivers, Challenges, and Opportunity/Restraints
- 9.1 Market drivers
- 9.2 Market challenges
- 9.3 Impact of drivers and challenges
- Impact of drivers and challenges in 2023 and 2028
- 9.4 Market opportunities/restraints
10 Competitive Landscape
- 10.1 Overview
- 10.2 Competitive Landscape
- Overview on criticality of inputs and factors of differentiation
- 10.3 Landscape disruption
- Overview on factors of disruption
- 10.4 Industry risks
- Impact of key risks on business
11 Competitive Analysis
- 11.1 Companies profiled
- Companies covered
- 11.2 Market positioning of companies
- Matrix on companies position and classification
- 11.3 Bucher Industries AG
- Bucher Industries AG - Overview
- Bucher Industries AG - Business segments
- Bucher Industries AG - Key offerings
- Bucher Industries AG - Segment focus
- 11.4 CIRCOR International Inc.
- CIRCOR International Inc. - Overview
- CIRCOR International Inc. - Business segments
- CIRCOR International Inc. - Key offerings
- CIRCOR International Inc. - Segment focus
- 11.5 Delta Elevator Co. Ltd.
- Delta Elevator Co. Ltd. - Overview
- Delta Elevator Co. Ltd. - Product / Service
- Delta Elevator Co. Ltd. - Key offerings
- 11.6 Kleemann Hellas S.A.
- Kleemann Hellas S.A. - Overview
- Kleemann Hellas S.A. - Product / Service
- Kleemann Hellas S.A. - Key offerings
- 11.7 Mitsubishi Electric Corp.
- Mitsubishi Electric Corp. - Overview
- Mitsubishi Electric Corp. - Business segments
- Mitsubishi Electric Corp. - Key offerings
- Mitsubishi Electric Corp. - Segment focus
- 11.8 Otis Worldwide Corp.
- Otis Worldwide Corp. - Overview
- Otis Worldwide Corp. - Business segments
- Otis Worldwide Corp. - Key offerings
- Otis Worldwide Corp. - Segment focus
- 11.9 Schindler Holding Ltd.
- Schindler Holding Ltd. - Overview
- Schindler Holding Ltd. - Product / Service
- Schindler Holding Ltd. - Key offerings
- 11.10 Schumacher Elevator Co.
- Schumacher Elevator Co. - Overview
- Schumacher Elevator Co. - Product / Service
- Schumacher Elevator Co. - Key offerings
- 11.11 thyssenkrupp AG
- thyssenkrupp AG - Overview
- thyssenkrupp AG - Business segments
- thyssenkrupp AG - Key news
- thyssenkrupp AG - Key offerings
- thyssenkrupp AG - Segment focus
- 11.12 Vantage Elevation LLC
- Vantage Elevation LLC - Overview
- Vantage Elevation LLC - Product / Service
- Vantage Elevation LLC - Key offerings
12 Appendix
- 12.1 Scope of the report
- 12.2 Inclusions and exclusions checklist
- Inclusions checklist
- Exclusions checklist
- 12.3 Currency conversion rates for US$
- Currency conversion rates for US$
- 12.4 Research methodology
- Research methodology
- 12.5 Data procurement
- Information sources
- 12.6 Data validation
- Data validation
- 12.7 Validation techniques employed for market sizing
- Validation techniques employed for market sizing
- 12.8 Data synthesis
- Data synthesis
- 12.9 360 degree market analysis
- 360 degree market analysis
- 12.10 List of abbreviations
- List of abbreviations

