|
|
市場調査レポート
商品コード
1604058
繊維ベース包装の世界市場 (2024~2028年)Global Fiber Based Packaging Market 2024-2028 |
||||||

|
|||||||
カスタマイズ可能
|
|||||||


| 繊維ベース包装の世界市場 (2024~2028年) |
|
出版日: 2024年10月22日
発行: TechNavio
ページ情報: 英文 156 Pages
納期: 即納可能
|

全表示
- 概要
- 図表
- 目次
繊維ベース包装市場 (2024~2028年)
繊維ベース包装市場は2023-2028年に498億米ドル分拡大し、予測期間中に3%のCAGRで成長すると予測されます。当レポートでは、繊維ベース包装市場の全体的な分析、市場規模・予測、動向、成長促進要因、課題、約25のベンダーを網羅したベンダー分析などを掲載しています。
当レポートでは、現在の市場シナリオ、最新動向と促進要因、市場環境全体に関する最新分析を提供しています。同市場は、装置の効率の高さ、消費者による環境に優しい製品への関心増大、可処分所得の増加によって牽引されています。
| 市場範囲 | |
|---|---|
| 基準年 | 2024年 |
| 終了年 | 2028年 |
| 予測期間 | 2024~2028年 |
| 成長モメンタム | 加速 |
| 前年比 (2024年) | 2.9% |
| CAGR | 3% |
| 増分額 | 498億米ドル |
当レポートでは、持続可能な製品に対する需要が、今後数年間の繊維ベース包装市場の成長を促進する主要な理由の1つであると特定しています。また、食品・飲料業界における包装需要の増加、eコマース業界による持続可能で革新的な包装ソリューションへの需要の増加が、市場の大きな需要につながります。
目次
第1章 エグゼクティブサマリー
- 市場概要
第2章 市場情勢
- 市場エコシステム
- 市場の特徴
- バリューチェーン分析
第3章 市場規模
- 市場の定義
- 市場セグメント分析
- 市場規模 (2023年)
- 市場の見通し (2023~2028年)
第4章 市場規模実績
- 繊維ベース包装の世界市場 (2018~2022年)
- エンドユーザー別分析 (2018~2022年)
- 地域別分析 (2018~2022年)
- 国別分析 (2018~2022年)
第5章 ファイブフォース分析
- ファイブフォースの要約
- 買い手の交渉力
- 供給企業の交渉力
- 新規参入業者の脅威
- 代替品の脅威
- 競争の脅威
- 市況
第6章 市場セグメンテーション:エンドユーザー別
- 市場セグメント
- 比較:エンドユーザー別
- 化学:市場規模と予測 (2023~2028年)
- 食品・飲料:市場規模と予測 (2023~2028年)
- 民生用電子機器:市場規模と予測 (2023~2028年)
- 建設:市場規模と予測 (2023~2028年)
- その他:市場規模と予測 (2023~2028年)
- 市場機会:エンドユーザー別
第7章 顧客情勢
- 顧客情勢の概要
第8章 地域別情勢
- 地域別セグメンテーション
- 地域別比較
- アジア太平洋:市場規模と予測 (2023~2028年)
- 欧州:市場規模と予測 (2023~2028年)
- 北米:市場規模と予測 (2023~2028年)
- 南米:市場規模と予測 (2023~2028年)
- 中東・アフリカ:市場規模と予測 (2023~2028年)
- 中国:市場規模と予測 (2023~2028年)
- 米国:市場規模と予測 (2023~2028年)
- 英国:市場規模と予測 (2023~2028年)
- インド:市場規模と予測 (2023~2028年)
- フランス:市場規模と予測 (2023~2028年)
- 市場機会:地域別
第9章 促進要因・課題・機会・抑制要因
- 市場促進要因
- 市場の課題
- 促進要因と課題の影響
- 市場の機会・抑制要因
第10章 競合情勢
- 概要
- 競合情勢
- 混乱の状況
- 業界のリスク
第11章 競合分析
- 企業プロファイル
- 企業の市場ポジショニング
- BillerudKorsnas AB
- Brodrene Hartmann AS
- DS Smith Plc
- Evergreen Packaging LLC
- Huhtamaki Oyj
- International Paper Co.
- Koch Industries Inc.
- McKinley Packaging
- Mondi Plc
- Rengo Co. Ltd.
- Smurfit Kappa Group
- Sonoco Products Co.
- Stora Enso Oyj
- UFP Technologies Inc.
- WestRock Co.
第12章 付録
Exhibits:
- Exhibits1: Executive Summary - Chart on Market Overview
- Exhibits2: Executive Summary - Data Table on Market Overview
- Exhibits3: Executive Summary - Chart on Global Market Characteristics
- Exhibits4: Executive Summary - Chart on Market By Geographical Landscape
- Exhibits5: Executive Summary - Chart on Market Segmentation by End-user
- Exhibits6: Executive Summary - Chart on Incremental Growth
- Exhibits7: Executive Summary - Data Table on Incremental Growth
- Exhibits8: Executive Summary - Chart on Company Market Positioning
- Exhibits9: Parent Market
- Exhibits10: Data Table on - Parent Market
- Exhibits11: Market characteristics analysis
- Exhibits12: Value Chain Analysis
- Exhibits13: Offerings of companies included in the market definition
- Exhibits14: Market segments
- Exhibits15: Chart on Global - Market size and forecast 2023-2028 ($ billion)
- Exhibits16: Data Table on Global - Market size and forecast 2023-2028 ($ billion)
- Exhibits17: Chart on Global Market: Year-over-year growth 2023-2028 (%)
- Exhibits18: Data Table on Global Market: Year-over-year growth 2023-2028 (%)
- Exhibits19: Historic Market Size - Data Table on Global Fiber Based Packaging Market 2018 - 2022 ($ billion)
- Exhibits20: Historic Market Size - End-user Segment 2018 - 2022 ($ billion)
- Exhibits21: Historic Market Size - Geography Segment 2018 - 2022 ($ billion)
- Exhibits22: Historic Market Size - Country Segment 2018 - 2022 ($ billion)
- Exhibits23: Five forces analysis - Comparison between 2023 and 2028
- Exhibits24: Bargaining power of buyers - Impact of key factors 2023 and 2028
- Exhibits25: Bargaining power of suppliers - Impact of key factors in 2023 and 2028
- Exhibits26: Threat of new entrants - Impact of key factors in 2023 and 2028
- Exhibits27: Threat of substitutes - Impact of key factors in 2023 and 2028
- Exhibits28: Threat of rivalry - Impact of key factors in 2023 and 2028
- Exhibits29: Chart on Market condition - Five forces 2023 and 2028
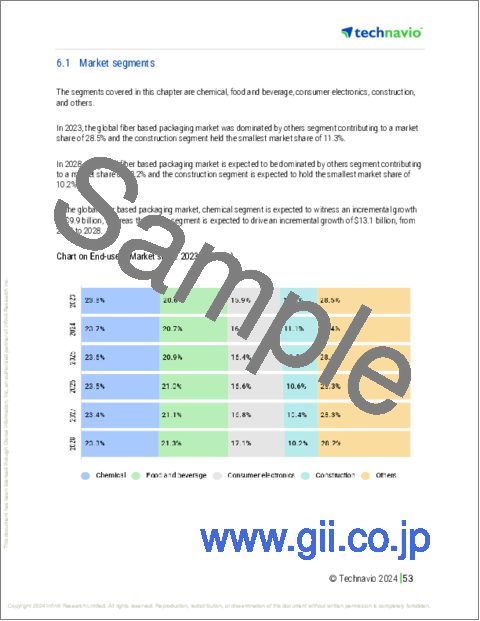
- Exhibits30: Chart on End-user - Market share 2023-2028 (%)
- Exhibits31: Data Table on End-user - Market share 2023-2028 (%)
- Exhibits32: Chart on Comparison by End-user
- Exhibits33: Data Table on Comparison by End-user
- Exhibits34: Chart on Chemical - Market size and forecast 2023-2028 ($ billion)
- Exhibits35: Data Table on Chemical - Market size and forecast 2023-2028 ($ billion)
- Exhibits36: Chart on Chemical - Year-over-year growth 2023-2028 (%)
- Exhibits37: Data Table on Chemical - Year-over-year growth 2023-2028 (%)
- Exhibits38: Chart on Food and beverage - Market size and forecast 2023-2028 ($ billion)
- Exhibits39: Data Table on Food and beverage - Market size and forecast 2023-2028 ($ billion)
- Exhibits40: Chart on Food and beverage - Year-over-year growth 2023-2028 (%)
- Exhibits41: Data Table on Food and beverage - Year-over-year growth 2023-2028 (%)
- Exhibits42: Chart on Consumer electronics - Market size and forecast 2023-2028 ($ billion)
- Exhibits43: Data Table on Consumer electronics - Market size and forecast 2023-2028 ($ billion)
- Exhibits44: Chart on Consumer electronics - Year-over-year growth 2023-2028 (%)
- Exhibits45: Data Table on Consumer electronics - Year-over-year growth 2023-2028 (%)
- Exhibits46: Chart on Construction - Market size and forecast 2023-2028 ($ billion)
- Exhibits47: Data Table on Construction - Market size and forecast 2023-2028 ($ billion)
- Exhibits48: Chart on Construction - Year-over-year growth 2023-2028 (%)
- Exhibits49: Data Table on Construction - Year-over-year growth 2023-2028 (%)
- Exhibits50: Chart on Others - Market size and forecast 2023-2028 ($ billion)
- Exhibits51: Data Table on Others - Market size and forecast 2023-2028 ($ billion)
- Exhibits52: Chart on Others - Year-over-year growth 2023-2028 (%)
- Exhibits53: Data Table on Others - Year-over-year growth 2023-2028 (%)
- Exhibits54: Market opportunity by End-user ($ billion)
- Exhibits55: Data Table on Market opportunity by End-user ($ billion)
- Exhibits56: Analysis of price sensitivity, lifecycle, customer purchase basket, adoption rates, and purchase criteria
- Exhibits57: Chart on Market share By Geographical Landscape 2023-2028 (%)
- Exhibits58: Data Table on Market share By Geographical Landscape 2023-2028 (%)
- Exhibits59: Chart on Geographic comparison
- Exhibits60: Data Table on Geographic comparison
- Exhibits61: Chart on APAC - Market size and forecast 2023-2028 ($ billion)
- Exhibits62: Data Table on APAC - Market size and forecast 2023-2028 ($ billion)
- Exhibits63: Chart on APAC - Year-over-year growth 2023-2028 (%)
- Exhibits64: Data Table on APAC - Year-over-year growth 2023-2028 (%)
- Exhibits65: Chart on Europe - Market size and forecast 2023-2028 ($ billion)
- Exhibits66: Data Table on Europe - Market size and forecast 2023-2028 ($ billion)
- Exhibits67: Chart on Europe - Year-over-year growth 2023-2028 (%)
- Exhibits68: Data Table on Europe - Year-over-year growth 2023-2028 (%)
- Exhibits69: Chart on North America - Market size and forecast 2023-2028 ($ billion)
- Exhibits70: Data Table on North America - Market size and forecast 2023-2028 ($ billion)
- Exhibits71: Chart on North America - Year-over-year growth 2023-2028 (%)
- Exhibits72: Data Table on North America - Year-over-year growth 2023-2028 (%)
- Exhibits73: Chart on South America - Market size and forecast 2023-2028 ($ billion)
- Exhibits74: Data Table on South America - Market size and forecast 2023-2028 ($ billion)
- Exhibits75: Chart on South America - Year-over-year growth 2023-2028 (%)
- Exhibits76: Data Table on South America - Year-over-year growth 2023-2028 (%)
- Exhibits77: Chart on Middle East and Africa - Market size and forecast 2023-2028 ($ billion)
- Exhibits78: Data Table on Middle East and Africa - Market size and forecast 2023-2028 ($ billion)
- Exhibits79: Chart on Middle East and Africa - Year-over-year growth 2023-2028 (%)
- Exhibits80: Data Table on Middle East and Africa - Year-over-year growth 2023-2028 (%)
- Exhibits81: Chart on China - Market size and forecast 2023-2028 ($ billion)
- Exhibits82: Data Table on China - Market size and forecast 2023-2028 ($ billion)
- Exhibits83: Chart on China - Year-over-year growth 2023-2028 (%)
- Exhibits84: Data Table on China - Year-over-year growth 2023-2028 (%)
- Exhibits85: Chart on US - Market size and forecast 2023-2028 ($ billion)
- Exhibits86: Data Table on US - Market size and forecast 2023-2028 ($ billion)
- Exhibits87: Chart on US - Year-over-year growth 2023-2028 (%)
- Exhibits88: Data Table on US - Year-over-year growth 2023-2028 (%)
- Exhibits89: Chart on UK - Market size and forecast 2023-2028 ($ billion)
- Exhibits90: Data Table on UK - Market size and forecast 2023-2028 ($ billion)
- Exhibits91: Chart on UK - Year-over-year growth 2023-2028 (%)
- Exhibits92: Data Table on UK - Year-over-year growth 2023-2028 (%)
- Exhibits93: Chart on India - Market size and forecast 2023-2028 ($ billion)
- Exhibits94: Data Table on India - Market size and forecast 2023-2028 ($ billion)
- Exhibits95: Chart on India - Year-over-year growth 2023-2028 (%)
- Exhibits96: Data Table on India - Year-over-year growth 2023-2028 (%)
- Exhibits97: Chart on France - Market size and forecast 2023-2028 ($ billion)
- Exhibits98: Data Table on France - Market size and forecast 2023-2028 ($ billion)
- Exhibits99: Chart on France - Year-over-year growth 2023-2028 (%)
- Exhibits100: Data Table on France - Year-over-year growth 2023-2028 (%)
- Exhibits101: Market opportunity By Geographical Landscape ($ billion)
- Exhibits102: Data Tables on Market opportunity By Geographical Landscape ($ billion)
- Exhibits103: Impact of drivers and challenges in 2023 and 2028
- Exhibits104: Overview on criticality of inputs and factors of differentiation
- Exhibits105: Overview on factors of disruption
- Exhibits106: Impact of key risks on business
- Exhibits107: Companies covered
- Exhibits108: Matrix on companies position and classification
- Exhibits109: BillerudKorsnas AB - Overview
- Exhibits110: BillerudKorsnas AB - Business segments
- Exhibits111: BillerudKorsnas AB - Key offerings
- Exhibits112: BillerudKorsnas AB - Segment focus
- Exhibits113: Brodrene Hartmann AS - Overview
- Exhibits114: Brodrene Hartmann AS - Business segments
- Exhibits115: Brodrene Hartmann AS - Key offerings
- Exhibits116: Brodrene Hartmann AS - Segment focus
- Exhibits117: DS Smith Plc - Overview
- Exhibits118: DS Smith Plc - Business segments
- Exhibits119: DS Smith Plc - Key news
- Exhibits120: DS Smith Plc - Key offerings
- Exhibits121: DS Smith Plc - Segment focus
- Exhibits122: Evergreen Packaging LLC - Overview
- Exhibits123: Evergreen Packaging LLC - Product / Service
- Exhibits124: Evergreen Packaging LLC - Key offerings
- Exhibits125: Huhtamaki Oyj - Overview
- Exhibits126: Huhtamaki Oyj - Business segments
- Exhibits127: Huhtamaki Oyj - Key news
- Exhibits128: Huhtamaki Oyj - Key offerings
- Exhibits129: Huhtamaki Oyj - Segment focus
- Exhibits130: International Paper Co. - Overview
- Exhibits131: International Paper Co. - Business segments
- Exhibits132: International Paper Co. - Key news
- Exhibits133: International Paper Co. - Key offerings
- Exhibits134: International Paper Co. - Segment focus
- Exhibits135: Koch Industries Inc. - Overview
- Exhibits136: Koch Industries Inc. - Product / Service
- Exhibits137: Koch Industries Inc. - Key offerings
- Exhibits138: McKinley Packaging - Overview
- Exhibits139: McKinley Packaging - Product / Service
- Exhibits140: McKinley Packaging - Key offerings
- Exhibits141: Mondi Plc - Overview
- Exhibits142: Mondi Plc - Business segments
- Exhibits143: Mondi Plc - Key news
- Exhibits144: Mondi Plc - Key offerings
- Exhibits145: Mondi Plc - Segment focus
- Exhibits146: Rengo Co. Ltd. - Overview
- Exhibits147: Rengo Co. Ltd. - Business segments
- Exhibits148: Rengo Co. Ltd. - Key offerings
- Exhibits149: Rengo Co. Ltd. - Segment focus
- Exhibits150: Smurfit Kappa Group - Overview
- Exhibits151: Smurfit Kappa Group - Business segments
- Exhibits152: Smurfit Kappa Group - Key news
- Exhibits153: Smurfit Kappa Group - Key offerings
- Exhibits154: Smurfit Kappa Group - Segment focus
- Exhibits155: Sonoco Products Co. - Overview
- Exhibits156: Sonoco Products Co. - Business segments
- Exhibits157: Sonoco Products Co. - Key news
- Exhibits158: Sonoco Products Co. - Key offerings
- Exhibits159: Sonoco Products Co. - Segment focus
- Exhibits160: Stora Enso Oyj - Overview
- Exhibits161: Stora Enso Oyj - Business segments
- Exhibits162: Stora Enso Oyj - Key offerings
- Exhibits163: Stora Enso Oyj - Segment focus
- Exhibits164: UFP Technologies Inc. - Overview
- Exhibits165: UFP Technologies Inc. - Product / Service
- Exhibits166: UFP Technologies Inc. - Key offerings
- Exhibits167: WestRock Co. - Overview
- Exhibits168: WestRock Co. - Business segments
- Exhibits169: WestRock Co. - Key news
- Exhibits170: WestRock Co. - Key offerings
- Exhibits171: WestRock Co. - Segment focus
- Exhibits172: Inclusions checklist
- Exhibits173: Exclusions checklist
- Exhibits174: Currency conversion rates for US$
- Exhibits175: Research methodology
- Exhibits176: Information sources
- Exhibits177: Data validation
- Exhibits178: Validation techniques employed for market sizing
- Exhibits179: Data synthesis
- Exhibits180: 360 degree market analysis
- Exhibits181: List of abbreviations
Fiber Based Packaging Market 2024-2028
The fiber based packaging market is forecasted to grow by USD 49.8 bn during 2023-2028, accelerating at a CAGR of 3% during the forecast period. The report on the fiber based packaging market provides a holistic analysis, market size and forecast, trends, growth drivers, and challenges, as well as vendor analysis covering around 25 vendors.
The report offers an up-to-date analysis regarding the current market scenario, the latest trends and drivers, and the overall market environment. The market is driven by highly efficient for equipment, rising focus on eco-friendly products by consumers, and rising disposable incomes.
| Market Scope | |
|---|---|
| Base Year | 2024 |
| End Year | 2028 |
| Series Year | 2024-2028 |
| Growth Momentum | Accelerate |
| YOY 2024 | 2.9% |
| CAGR | 3% |
| Incremental Value | $49.8 bn |
Technavio's fiber based packaging market is segmented as below:
By End-user
- Chemical
- Food and beverage
- Consumer electronics
- Construction
- Others
By Geographical Landscape
- APAC
- Europe
- North America
- South America
- Middle East and Africa
This study identifies the demand for sustainable products as one of the prime reasons driving the fiber based packaging market growth during the next few years. Also, increasing demand for packaging in food and beverages industry and increased demand for sustainable and innovative packaging solutions by e-commerce industry will lead to sizable demand in the market.
The report on the fiber based packaging market covers the following areas:
- Fiber Based Packaging Market sizing
- Fiber Based Packaging Market forecast
- Fiber Based Packaging Market industry analysis
The robust vendor analysis is designed to help clients improve their market position, and in line with this, this report provides a detailed analysis of several leading fiber based packaging market vendors that include AR Packaging Group AB, BillerudKorsnas AB, Blue Lake Packaging Inc., Brodrene Hartmann AS, BrUCkner Group Gmbh, DS Smith Plc, Evergreen Packaging LLC, Huhtamaki Oyj, International Paper Co., Koch Industries Inc., Mayr-Melnhof Karton AG, McKinley Packaging, Mondi Plc, PulPac AB, Rengo Co. Ltd., Smurfit Kappa Group, Sonoco Products Co., Stora Enso Oyj, UFP Technologies Inc., and WestRock Co.. Also, the fiber based packaging market analysis report includes information on upcoming trends and challenges that will influence market growth. This is to help companies strategize and leverage all forthcoming growth opportunities.
The study was conducted using an objective combination of primary and secondary information including inputs from key participants in the industry. The report contains a comprehensive market and vendor landscape in addition to an analysis of the key vendors.
The publisher presents a detailed picture of the market by the way of study, synthesis, and summation of data from multiple sources by an analysis of key parameters such as profit, pricing, competition, and promotions. It presents various market facets by identifying the key industry influencers. The data presented is comprehensive, reliable, and a result of extensive primary and secondary research. The market research reports provide a complete competitive landscape and an in-depth vendor selection methodology and analysis using qualitative and quantitative research to forecast accurate market growth.
Table of Contents
1 Executive Summary
- 1.1 Market overview
- Executive Summary - Chart on Market Overview
- Executive Summary - Data Table on Market Overview
- Executive Summary - Chart on Global Market Characteristics
- Executive Summary - Chart on Market By Geographical Landscape
- Executive Summary - Chart on Market Segmentation by End-user
- Executive Summary - Chart on Incremental Growth
- Executive Summary - Data Table on Incremental Growth
- Executive Summary - Chart on Company Market Positioning
2 Market Landscape
- 2.1 Market ecosystem
- Parent Market
- Data Table on - Parent Market
- 2.2 Market characteristics
- Market characteristics analysis
- 2.3 Value chain analysis
- Value Chain Analysis
3 Market Sizing
- 3.1 Market definition
- Offerings of companies included in the market definition
- 3.2 Market segment analysis
- Market segments
- 3.3 Market size 2023
- 3.4 Market outlook: Forecast for 2023-2028
- Chart on Global - Market size and forecast 2023-2028 ($ billion)
- Data Table on Global - Market size and forecast 2023-2028 ($ billion)
- Chart on Global Market: Year-over-year growth 2023-2028 (%)
- Data Table on Global Market: Year-over-year growth 2023-2028 (%)
4 Historic Market Size
- 4.1 Global Fiber Based Packaging Market 2018 - 2022
- Historic Market Size - Data Table on Global Fiber Based Packaging Market 2018 - 2022 ($ billion)
- 4.2 End-user segment analysis 2018 - 2022
- Historic Market Size - End-user Segment 2018 - 2022 ($ billion)
- 4.3 Geography segment analysis 2018 - 2022
- Historic Market Size - Geography Segment 2018 - 2022 ($ billion)
- 4.4 Country segment analysis 2018 - 2022
- Historic Market Size - Country Segment 2018 - 2022 ($ billion)
5 Five Forces Analysis
- 5.1 Five forces summary
- Five forces analysis - Comparison between 2023 and 2028
- 5.2 Bargaining power of buyers
- Bargaining power of buyers - Impact of key factors 2023 and 2028
- 5.3 Bargaining power of suppliers
- Bargaining power of suppliers - Impact of key factors in 2023 and 2028
- 5.4 Threat of new entrants
- Threat of new entrants - Impact of key factors in 2023 and 2028
- 5.5 Threat of substitutes
- Threat of substitutes - Impact of key factors in 2023 and 2028
- 5.6 Threat of rivalry
- Threat of rivalry - Impact of key factors in 2023 and 2028
- 5.7 Market condition
- Chart on Market condition - Five forces 2023 and 2028
6 Market Segmentation by End-user
- 6.1 Market segments
- Chart on End-user - Market share 2023-2028 (%)
- Data Table on End-user - Market share 2023-2028 (%)
- 6.2 Comparison by End-user
- Chart on Comparison by End-user
- Data Table on Comparison by End-user
- 6.3 Chemical - Market size and forecast 2023-2028
- Chart on Chemical - Market size and forecast 2023-2028 ($ billion)
- Data Table on Chemical - Market size and forecast 2023-2028 ($ billion)
- Chart on Chemical - Year-over-year growth 2023-2028 (%)
- Data Table on Chemical - Year-over-year growth 2023-2028 (%)
- 6.4 Food and beverage - Market size and forecast 2023-2028
- Chart on Food and beverage - Market size and forecast 2023-2028 ($ billion)
- Data Table on Food and beverage - Market size and forecast 2023-2028 ($ billion)
- Chart on Food and beverage - Year-over-year growth 2023-2028 (%)
- Data Table on Food and beverage - Year-over-year growth 2023-2028 (%)
- 6.5 Consumer electronics - Market size and forecast 2023-2028
- Chart on Consumer electronics - Market size and forecast 2023-2028 ($ billion)
- Data Table on Consumer electronics - Market size and forecast 2023-2028 ($ billion)
- Chart on Consumer electronics - Year-over-year growth 2023-2028 (%)
- Data Table on Consumer electronics - Year-over-year growth 2023-2028 (%)
- 6.6 Construction - Market size and forecast 2023-2028
- Chart on Construction - Market size and forecast 2023-2028 ($ billion)
- Data Table on Construction - Market size and forecast 2023-2028 ($ billion)
- Chart on Construction - Year-over-year growth 2023-2028 (%)
- Data Table on Construction - Year-over-year growth 2023-2028 (%)
- 6.7 Others - Market size and forecast 2023-2028
- Chart on Others - Market size and forecast 2023-2028 ($ billion)
- Data Table on Others - Market size and forecast 2023-2028 ($ billion)
- Chart on Others - Year-over-year growth 2023-2028 (%)
- Data Table on Others - Year-over-year growth 2023-2028 (%)
- 6.8 Market opportunity by End-user
- Market opportunity by End-user ($ billion)
- Data Table on Market opportunity by End-user ($ billion)
7 Customer Landscape
- 7.1 Customer landscape overview
- Analysis of price sensitivity, lifecycle, customer purchase basket, adoption rates, and purchase criteria
8 Geographic Landscape
- 8.1 Geographic segmentation
- Chart on Market share By Geographical Landscape 2023-2028 (%)
- Data Table on Market share By Geographical Landscape 2023-2028 (%)
- 8.2 Geographic comparison
- Chart on Geographic comparison
- Data Table on Geographic comparison
- 8.3 APAC - Market size and forecast 2023-2028
- Chart on APAC - Market size and forecast 2023-2028 ($ billion)
- Data Table on APAC - Market size and forecast 2023-2028 ($ billion)
- Chart on APAC - Year-over-year growth 2023-2028 (%)
- Data Table on APAC - Year-over-year growth 2023-2028 (%)
- 8.4 Europe - Market size and forecast 2023-2028
- Chart on Europe - Market size and forecast 2023-2028 ($ billion)
- Data Table on Europe - Market size and forecast 2023-2028 ($ billion)
- Chart on Europe - Year-over-year growth 2023-2028 (%)
- Data Table on Europe - Year-over-year growth 2023-2028 (%)
- 8.5 North America - Market size and forecast 2023-2028
- Chart on North America - Market size and forecast 2023-2028 ($ billion)
- Data Table on North America - Market size and forecast 2023-2028 ($ billion)
- Chart on North America - Year-over-year growth 2023-2028 (%)
- Data Table on North America - Year-over-year growth 2023-2028 (%)
- 8.6 South America - Market size and forecast 2023-2028
- Chart on South America - Market size and forecast 2023-2028 ($ billion)
- Data Table on South America - Market size and forecast 2023-2028 ($ billion)
- Chart on South America - Year-over-year growth 2023-2028 (%)
- Data Table on South America - Year-over-year growth 2023-2028 (%)
- 8.7 Middle East and Africa - Market size and forecast 2023-2028
- Chart on Middle East and Africa - Market size and forecast 2023-2028 ($ billion)
- Data Table on Middle East and Africa - Market size and forecast 2023-2028 ($ billion)
- Chart on Middle East and Africa - Year-over-year growth 2023-2028 (%)
- Data Table on Middle East and Africa - Year-over-year growth 2023-2028 (%)
- 8.8 China - Market size and forecast 2023-2028
- Chart on China - Market size and forecast 2023-2028 ($ billion)
- Data Table on China - Market size and forecast 2023-2028 ($ billion)
- Chart on China - Year-over-year growth 2023-2028 (%)
- Data Table on China - Year-over-year growth 2023-2028 (%)
- 8.9 US - Market size and forecast 2023-2028
- Chart on US - Market size and forecast 2023-2028 ($ billion)
- Data Table on US - Market size and forecast 2023-2028 ($ billion)
- Chart on US - Year-over-year growth 2023-2028 (%)
- Data Table on US - Year-over-year growth 2023-2028 (%)
- 8.10 UK - Market size and forecast 2023-2028
- Chart on UK - Market size and forecast 2023-2028 ($ billion)
- Data Table on UK - Market size and forecast 2023-2028 ($ billion)
- Chart on UK - Year-over-year growth 2023-2028 (%)
- Data Table on UK - Year-over-year growth 2023-2028 (%)
- 8.11 India - Market size and forecast 2023-2028
- Chart on India - Market size and forecast 2023-2028 ($ billion)
- Data Table on India - Market size and forecast 2023-2028 ($ billion)
- Chart on India - Year-over-year growth 2023-2028 (%)
- Data Table on India - Year-over-year growth 2023-2028 (%)
- 8.12 France - Market size and forecast 2023-2028
- Chart on France - Market size and forecast 2023-2028 ($ billion)
- Data Table on France - Market size and forecast 2023-2028 ($ billion)
- Chart on France - Year-over-year growth 2023-2028 (%)
- Data Table on France - Year-over-year growth 2023-2028 (%)
- 8.13 Market opportunity By Geographical Landscape
- Market opportunity By Geographical Landscape ($ billion)
- Data Tables on Market opportunity By Geographical Landscape ($ billion)
9 Drivers, Challenges, and Opportunity/Restraints
- 9.1 Market drivers
- 9.2 Market challenges
- 9.3 Impact of drivers and challenges
- Impact of drivers and challenges in 2023 and 2028
- 9.4 Market opportunities/restraints
10 Competitive Landscape
- 10.1 Overview
- 10.2 Competitive Landscape
- Overview on criticality of inputs and factors of differentiation
- 10.3 Landscape disruption
- Overview on factors of disruption
- 10.4 Industry risks
- Impact of key risks on business
11 Competitive Analysis
- 11.1 Companies profiled
- Companies covered
- 11.2 Market positioning of companies
- Matrix on companies position and classification
- 11.3 BillerudKorsnas AB
- BillerudKorsnas AB - Overview
- BillerudKorsnas AB - Business segments
- BillerudKorsnas AB - Key offerings
- BillerudKorsnas AB - Segment focus
- 11.4 Brodrene Hartmann AS
- Brodrene Hartmann AS - Overview
- Brodrene Hartmann AS - Business segments
- Brodrene Hartmann AS - Key offerings
- Brodrene Hartmann AS - Segment focus
- 11.5 DS Smith Plc
- DS Smith Plc - Overview
- DS Smith Plc - Business segments
- DS Smith Plc - Key news
- DS Smith Plc - Key offerings
- DS Smith Plc - Segment focus
- 11.6 Evergreen Packaging LLC
- Evergreen Packaging LLC - Overview
- Evergreen Packaging LLC - Product / Service
- Evergreen Packaging LLC - Key offerings
- 11.7 Huhtamaki Oyj
- Huhtamaki Oyj - Overview
- Huhtamaki Oyj - Business segments
- Huhtamaki Oyj - Key news
- Huhtamaki Oyj - Key offerings
- Huhtamaki Oyj - Segment focus
- 11.8 International Paper Co.
- International Paper Co. - Overview
- International Paper Co. - Business segments
- International Paper Co. - Key news
- International Paper Co. - Key offerings
- International Paper Co. - Segment focus
- 11.9 Koch Industries Inc.
- Koch Industries Inc. - Overview
- Koch Industries Inc. - Product / Service
- Koch Industries Inc. - Key offerings
- 11.10 McKinley Packaging
- McKinley Packaging - Overview
- McKinley Packaging - Product / Service
- McKinley Packaging - Key offerings
- 11.11 Mondi Plc
- Mondi Plc - Overview
- Mondi Plc - Business segments
- Mondi Plc - Key news
- Mondi Plc - Key offerings
- Mondi Plc - Segment focus
- 11.12 Rengo Co. Ltd.
- Rengo Co. Ltd. - Overview
- Rengo Co. Ltd. - Business segments
- Rengo Co. Ltd. - Key offerings
- Rengo Co. Ltd. - Segment focus
- 11.13 Smurfit Kappa Group
- Smurfit Kappa Group - Overview
- Smurfit Kappa Group - Business segments
- Smurfit Kappa Group - Key news
- Smurfit Kappa Group - Key offerings
- Smurfit Kappa Group - Segment focus
- 11.14 Sonoco Products Co.
- Sonoco Products Co. - Overview
- Sonoco Products Co. - Business segments
- Sonoco Products Co. - Key news
- Sonoco Products Co. - Key offerings
- Sonoco Products Co. - Segment focus
- 11.15 Stora Enso Oyj
- Stora Enso Oyj - Overview
- Stora Enso Oyj - Business segments
- Stora Enso Oyj - Key offerings
- Stora Enso Oyj - Segment focus
- 11.16 UFP Technologies Inc.
- UFP Technologies Inc. - Overview
- UFP Technologies Inc. - Product / Service
- UFP Technologies Inc. - Key offerings
- 11.17 WestRock Co.
- WestRock Co. - Overview
- WestRock Co. - Business segments
- WestRock Co. - Key news
- WestRock Co. - Key offerings
- WestRock Co. - Segment focus
12 Appendix
- 12.1 Scope of the report
- 12.2 Inclusions and exclusions checklist
- Inclusions checklist
- Exclusions checklist
- 12.3 Currency conversion rates for US$
- Currency conversion rates for US$
- 12.4 Research methodology
- Research methodology
- 12.5 Data procurement
- Information sources
- 12.6 Data validation
- Data validation
- 12.7 Validation techniques employed for market sizing
- Validation techniques employed for market sizing
- 12.8 Data synthesis
- Data synthesis
- 12.9 360 degree market analysis
- 360 degree market analysis
- 12.10 List of abbreviations
- List of abbreviations

