|
|
市場調査レポート
商品コード
2005539
パッケージサブステーションの世界市場 2026年~2030年Global Packaged Substation Market 2026-2030 |
||||||
|
|||||||
カスタマイズ可能
|
|||||||

| パッケージサブステーションの世界市場 2026年~2030年 |
|
出版日: 2026年04月01日
発行: TechNavio
ページ情報: 英文 296 Pages
納期: 即納可能
|

概要
世界のパッケージ型変電所市場は、2025年から2030年にかけて48億6,230万米ドル成長し、予測期間中のCAGRは7.2%になると予測されています。
本レポートでは、世界のパッケージ型変電所市場について、包括的な分析、市場規模と予測、動向、成長要因、課題に加え、約25社のベンダーを対象としたベンダー分析を提供しています。
本レポートでは、現在の市場状況、最新の動向と促進要因、および市場環境全体に関する最新の分析を提供しています。この市場は、急速な都市化と工業化、再生可能エネルギー源の統合、送電網の近代化、およびスマートグリッドの取り組みによって牽引されています。
本調査は、業界の主要関係者からの意見を含む一次情報と二次情報を客観的に組み合わせて実施されました。本レポートには、主要企業の分析に加え、包括的な市場規模データ、地域別分析を伴うセグメント、およびベンダー情勢が含まれています。レポートには、過去データと予測データが掲載されています。
| 市場の範囲 | |
|---|---|
| 基準年 | 2026年 |
| 終了年 | 2030 |
| 調査期間 | 2026年~2030年 |
| 成長モメンタム | 加速 |
| 2026年比 | 6.9% |
| CAGR | 7.2% |
| 増分額 | 48億6,230万米ドル |
本調査では、今後数年間における世界のパッケージ型変電所市場の成長を牽引する主な要因の一つとして、デジタル化とスマート統合を挙げています。また、迅速な導入を可能にするモジュール化やプレハブ化、さらには持続可能性と環境に配慮したソリューションも、市場において相当な需要を生み出すと見込まれます。
目次
第1章 エグゼクティブサマリー
第2章 Technavio分析
- 価格・ライフサイクル・顧客購入バスケット・採用率・購入基準の分析
- インプットの重要性と差別化の要因
- 混乱の要因
- 促進要因と課題の影響
第3章 市場情勢
- 市場エコシステム
- 市場の特徴
- バリューチェーン分析
第4章 市場規模
- 市場の定義
- 市場セグメント分析
- 市場規模 2025
- 市場の見通し 2025-2030
第5章 市場規模実績
- パッケージサブステーションの世界市場 2020-2024
- 用途別セグメント分析 2020-2024
- 定格出力セグメント分析 2020-2024
- タイプセグメント分析 2020-2024
- 地域別セグメント分析 2020-2024
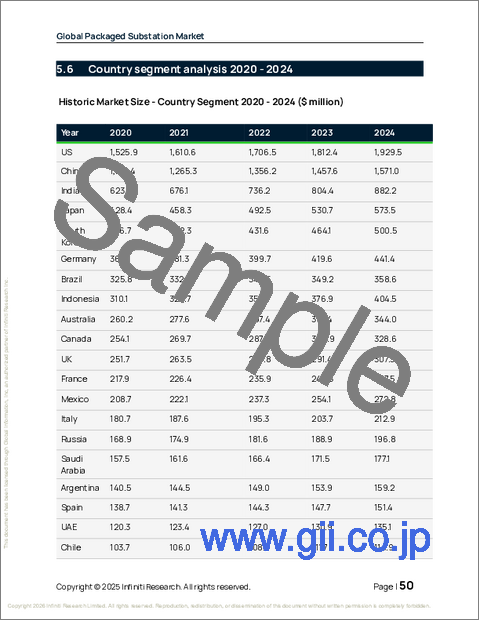
- 国別セグメント分析 2020-2024
第6章 定性分析
- AIの影響:パッケージサブステーションの世界市場
- 地政学的紛争がパッケージサブステーションの世界市場
第7章 ファイブフォース分析
- ファイブフォースの要約
- 買い手の交渉力
- 供給企業の交渉力
- 新規参入業者の脅威
- 代替品の脅威
- 競争の脅威
- 市況
第8章 市場セグメンテーション:用途別
- 比較:用途別
- 産業
- インフラ
- 発電・公益事業
- 市場機会:用途別
第9章 市場セグメンテーション:出力定格別
- 比較:出力定格別
- 中
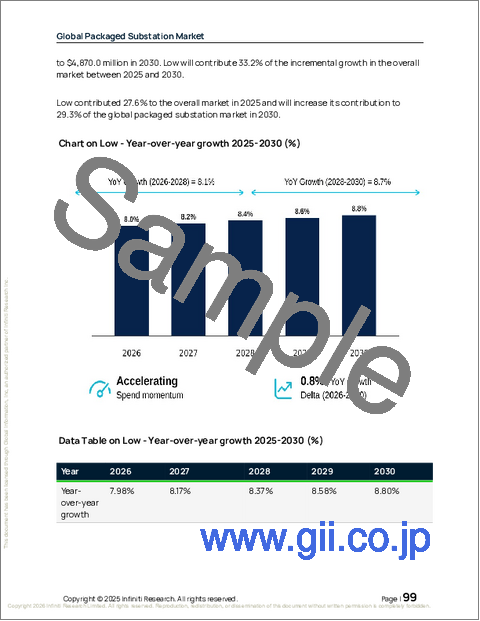
- 低
- 高
- 市場機会:出力定格別
第10章 市場セグメンテーション:タイプ別
- 比較:タイプ別
- 屋外型パッケージ変電所
- 屋内型パッケージ変電所
- 地下型パッケージ変電所
- 市場機会:タイプ別
第11章 顧客情勢
第12章 地域別情勢
- 地域別セグメンテーション
- 地域別比較
- アジア太平洋
- 中国
- インド
- 日本
- 韓国
- インドネシア
- オーストラリア
- 北米
- 米国
- カナダ
- メキシコ
- 欧州
- ドイツ
- 英国
- フランス
- イタリア
- ロシア
- スペイン
- 中東・アフリカ
- サウジアラビア
- アラブ首長国連邦
- 南アフリカ
- トルコ
- カタール
- 南米
- ブラジル
- アルゼンチン
- チリ
- 市場機会:地域別
第13章 促進要因・課題・機会
- 市場促進要因
- 市場の課題
- 促進要因と課題の影響
- 市場機会
第14章 競合情勢
- 概要
- 競合情勢
- 混乱の状況
- 業界のリスク
第15章 競合分析
- 企業プロファイル
- 企業ランキング指標
- 企業の市場ポジショニング
- ABB Ltd.
- alfanar Group
- Ames Impex Electricals Pvt Ltd
- C and S Electric Ltd.
- CG Power and Industrial Ltd.
- Eaton Corp. Plc
- GE Vernova Inc.
- Hitachi Energy Ltd.
- Hyosung Heavy Industries Corp.
- Larsen and Toubro Ltd.
- Meidensha Corp.
- Mitsubishi Electric
- Schneider Electric SE
- Siemens Energy AG
- Toshiba Corp.
