|
|
市場調査レポート
商品コード
1603963
マイクロアレイバイオチップの世界市場、2024~2028年Global Microarray Biochips Market 2024-2028 |
||||||
|
|||||||
カスタマイズ可能
|
|||||||


| マイクロアレイバイオチップの世界市場、2024~2028年 |
|
出版日: 2024年10月24日
発行: TechNavio
ページ情報: 英文 162 Pages
納期: 即納可能
|

全表示
- 概要
- 図表
- 目次
マイクロアレイバイオチップ市場、2024~2028年
マイクロアレイバイオチップ市場は2023~2028年に172億7,560万米ドル、予測期間中のCAGRは22.2%で成長すると予測されます。当レポートでは、マイクロアレイバイオチップ市場の全体的な分析、市場規模・予測、動向、成長促進要因、課題、約25のベンダーを網羅したベンダー分析などを掲載しています。
現在の市場シナリオ、最新動向と促進要因、市場環境全体に関する最新分析を提供しています。市場を牽引しているのは、コラボレーション戦略による市場プレゼンス向上、個別化医薬品の利用拡大、ゲノミクスとプロテオミクスにおけるマイクロアレイバイオチップ需要の高まりです。
| 市場範囲 | |
|---|---|
| 基準年 | 2024年 |
| 終了年 | 2028年 |
| 予測期間 | 2024~2028年 |
| 成長モメンタム | 加速 |
| 前年比[2024年] | 17.9% |
| CAGR | 22.2% |
| 増分額 | 172億7,560万米ドル |
本調査では、今後数年間のマイクロアレイバイオチップ市場成長を牽引する主要要因の1つとして、新興のLC技術を挙げています。また、バイオインフォマティクスソフトウェア産業の成長と費用対効果の高い技術の出現は、市場の大きな需要につながります。
目次
第1章 エグゼクティブサマリー
- 市場概要
第2章 市場情勢
- 市場エコシステム
- 市場の特徴
- バリューチェーン分析
第3章 市場規模
- 市場の定義
- 市場セグメント分析
- 市場規模 2023年
- 市場の展望 2023~2028年
第4章 市場規模実績
- マイクロアレイバイオチップの世界市場 2018~2022年
- 用途別セグメント分析 2018~2022年
- 地域別セグメント分析 2018~2022年
- 国別セグメント分析 2018~2022年
第5章 ファイブフォース分析
- ファイブフォースの要約
- 買い手の交渉力
- 供給企業の交渉力
- 新規参入業者の脅威
- 代替品の脅威
- 競争の脅威
- 市況
第6章 市場セグメンテーション:用途別
- 市場セグメント
- 比較:用途別
- 医薬品の発見と開発:市場規模と予測 2023~2028年
- 診断と治療:市場規模と予測 2023~2028年
- 研究と消耗品:市場規模と予測 2023~2028年
- 法医学:市場規模と予測 2023~2028年
- その他:市場規模と予測 2023~2028年
- 市場機会:用途別
第7章 顧客情勢
- 顧客情勢概要
第8章 地域別情勢
- 地域別セグメンテーション
- 比較:地域別
- 北米:市場規模と予測 2023~2028年
- 欧州:市場規模と予測 2023~2028年
- アジア:市場規模と予測 2023~2028年
- その他:市場規模と予測 2023~2028年
- 米国:市場規模と予測 2023~2028年
- 英国:市場規模と予測 2023~2028年
- ドイツ:市場規模と予測 2023~2028年
- 中国:市場規模と予測 2023~2028年
- 日本:市場規模と予測 2023~2028年
- 地域情勢による市場機会
第9章 促進要因・課題・機会・抑制要因
- 市場促進要因
- 市場課題
- 促進要因と課題の影響
- 市場機会・抑制要因
第10章 競合情勢
- 概要
- 競合情勢
- 混乱の状況
- 産業のリスク
第11章 競合分析
- 企業プロファイル
- 企業の市場ポジショニング
- Agilent Technologies Inc.
- BioChain Institute Inc.
- Bio Rad Laboratories Inc.
- Danaher Corp.
- Fluidigm Corp.
- General Electric Co.
- Illumina Inc.
- Merck KGaA
- Perkin Elmer Inc.
- Thermo Fisher Scientific Inc.
第12章 付録
Exhibits:
- Exhibits1: Executive Summary - Chart on Market Overview
- Exhibits2: Executive Summary - Data Table on Market Overview
- Exhibits3: Executive Summary - Chart on Global Market Characteristics
- Exhibits4: Executive Summary - Chart on Market By Geographical Landscape
- Exhibits5: Executive Summary - Chart on Market Segmentation by Application
- Exhibits6: Executive Summary - Chart on Incremental Growth
- Exhibits7: Executive Summary - Data Table on Incremental Growth
- Exhibits8: Executive Summary - Chart on Company Market Positioning
- Exhibits9: Parent Market
- Exhibits10: Data Table on - Parent Market
- Exhibits11: Market characteristics analysis
- Exhibits12: Value Chain Analysis
- Exhibits13: Offerings of companies included in the market definition
- Exhibits14: Market segments
- Exhibits15: Chart on Global - Market size and forecast 2023-2028 ($ million)
- Exhibits16: Data Table on Global - Market size and forecast 2023-2028 ($ million)
- Exhibits17: Chart on Global Market: Year-over-year growth 2023-2028 (%)
- Exhibits18: Data Table on Global Market: Year-over-year growth 2023-2028 (%)
- Exhibits19: Historic Market Size - Data Table on Global Microarray Biochips Market 2018 - 2022 ($ million)
- Exhibits20: Historic Market Size - Application Segment 2018 - 2022 ($ million)
- Exhibits21: Historic Market Size - Geography Segment 2018 - 2022 ($ million)
- Exhibits22: Historic Market Size - Country Segment 2018 - 2022 ($ million)
- Exhibits23: Five forces analysis - Comparison between 2023 and 2028
- Exhibits24: Bargaining power of buyers - Impact of key factors 2023 and 2028
- Exhibits25: Bargaining power of suppliers - Impact of key factors in 2023 and 2028
- Exhibits26: Threat of new entrants - Impact of key factors in 2023 and 2028
- Exhibits27: Threat of substitutes - Impact of key factors in 2023 and 2028
- Exhibits28: Threat of rivalry - Impact of key factors in 2023 and 2028
- Exhibits29: Chart on Market condition - Five forces 2023 and 2028
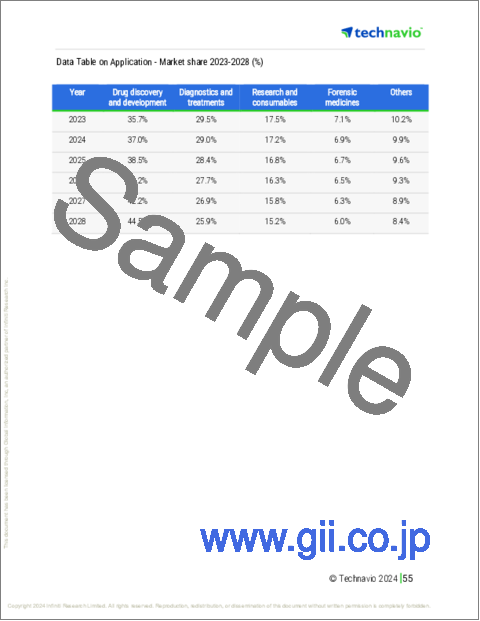
- Exhibits30: Chart on Application - Market share 2023-2028 (%)
- Exhibits31: Data Table on Application - Market share 2023-2028 (%)
- Exhibits32: Chart on Comparison by Application
- Exhibits33: Data Table on Comparison by Application
- Exhibits34: Chart on Drug discovery and development - Market size and forecast 2023-2028 ($ million)
- Exhibits35: Data Table on Drug discovery and development - Market size and forecast 2023-2028 ($ million)
- Exhibits36: Chart on Drug discovery and development - Year-over-year growth 2023-2028 (%)
- Exhibits37: Data Table on Drug discovery and development - Year-over-year growth 2023-2028 (%)
- Exhibits38: Chart on Diagnostics and treatments - Market size and forecast 2023-2028 ($ million)
- Exhibits39: Data Table on Diagnostics and treatments - Market size and forecast 2023-2028 ($ million)
- Exhibits40: Chart on Diagnostics and treatments - Year-over-year growth 2023-2028 (%)
- Exhibits41: Data Table on Diagnostics and treatments - Year-over-year growth 2023-2028 (%)
- Exhibits42: Chart on Research and consumables - Market size and forecast 2023-2028 ($ million)
- Exhibits43: Data Table on Research and consumables - Market size and forecast 2023-2028 ($ million)
- Exhibits44: Chart on Research and consumables - Year-over-year growth 2023-2028 (%)
- Exhibits45: Data Table on Research and consumables - Year-over-year growth 2023-2028 (%)
- Exhibits46: Chart on Forensic medicines - Market size and forecast 2023-2028 ($ million)
- Exhibits47: Data Table on Forensic medicines - Market size and forecast 2023-2028 ($ million)
- Exhibits48: Chart on Forensic medicines - Year-over-year growth 2023-2028 (%)
- Exhibits49: Data Table on Forensic medicines - Year-over-year growth 2023-2028 (%)
- Exhibits50: Chart on Others - Market size and forecast 2023-2028 ($ million)
- Exhibits51: Data Table on Others - Market size and forecast 2023-2028 ($ million)
- Exhibits52: Chart on Others - Year-over-year growth 2023-2028 (%)
- Exhibits53: Data Table on Others - Year-over-year growth 2023-2028 (%)
- Exhibits54: Market opportunity by Application ($ million)
- Exhibits55: Data Table on Market opportunity by Application ($ million)
- Exhibits56: Analysis of price sensitivity, lifecycle, customer purchase basket, adoption rates, and purchase criteria
- Exhibits57: Chart on Market share By Geographical Landscape 2023-2028 (%)
- Exhibits58: Data Table on Market share By Geographical Landscape 2023-2028 (%)
- Exhibits59: Chart on Geographic comparison
- Exhibits60: Data Table on Geographic comparison
- Exhibits61: Chart on North America - Market size and forecast 2023-2028 ($ million)
- Exhibits62: Data Table on North America - Market size and forecast 2023-2028 ($ million)
- Exhibits63: Chart on North America - Year-over-year growth 2023-2028 (%)
- Exhibits64: Data Table on North America - Year-over-year growth 2023-2028 (%)
- Exhibits65: Chart on Europe - Market size and forecast 2023-2028 ($ million)
- Exhibits66: Data Table on Europe - Market size and forecast 2023-2028 ($ million)
- Exhibits67: Chart on Europe - Year-over-year growth 2023-2028 (%)
- Exhibits68: Data Table on Europe - Year-over-year growth 2023-2028 (%)
- Exhibits69: Chart on Asia - Market size and forecast 2023-2028 ($ million)
- Exhibits70: Data Table on Asia - Market size and forecast 2023-2028 ($ million)
- Exhibits71: Chart on Asia - Year-over-year growth 2023-2028 (%)
- Exhibits72: Data Table on Asia - Year-over-year growth 2023-2028 (%)
- Exhibits73: Chart on Rest of World (ROW) - Market size and forecast 2023-2028 ($ million)
- Exhibits74: Data Table on Rest of World (ROW) - Market size and forecast 2023-2028 ($ million)
- Exhibits75: Chart on Rest of World (ROW) - Year-over-year growth 2023-2028 (%)
- Exhibits76: Data Table on Rest of World (ROW) - Year-over-year growth 2023-2028 (%)
- Exhibits77: Chart on US - Market size and forecast 2023-2028 ($ million)
- Exhibits78: Data Table on US - Market size and forecast 2023-2028 ($ million)
- Exhibits79: Chart on US - Year-over-year growth 2023-2028 (%)
- Exhibits80: Data Table on US - Year-over-year growth 2023-2028 (%)
- Exhibits81: Chart on UK - Market size and forecast 2023-2028 ($ million)
- Exhibits82: Data Table on UK - Market size and forecast 2023-2028 ($ million)
- Exhibits83: Chart on UK - Year-over-year growth 2023-2028 (%)
- Exhibits84: Data Table on UK - Year-over-year growth 2023-2028 (%)
- Exhibits85: Chart on Germany - Market size and forecast 2023-2028 ($ million)
- Exhibits86: Data Table on Germany - Market size and forecast 2023-2028 ($ million)
- Exhibits87: Chart on Germany - Year-over-year growth 2023-2028 (%)
- Exhibits88: Data Table on Germany - Year-over-year growth 2023-2028 (%)
- Exhibits89: Chart on China - Market size and forecast 2023-2028 ($ million)
- Exhibits90: Data Table on China - Market size and forecast 2023-2028 ($ million)
- Exhibits91: Chart on China - Year-over-year growth 2023-2028 (%)
- Exhibits92: Data Table on China - Year-over-year growth 2023-2028 (%)
- Exhibits93: Chart on Japan - Market size and forecast 2023-2028 ($ million)
- Exhibits94: Data Table on Japan - Market size and forecast 2023-2028 ($ million)
- Exhibits95: Chart on Japan - Year-over-year growth 2023-2028 (%)
- Exhibits96: Data Table on Japan - Year-over-year growth 2023-2028 (%)
- Exhibits97: Market opportunity By Geographical Landscape ($ million)
- Exhibits98: Data Tables on Market opportunity By Geographical Landscape ($ million)
- Exhibits99: Impact of drivers and challenges in 2023 and 2028
- Exhibits100: Overview on criticality of inputs and factors of differentiation
- Exhibits101: Overview on factors of disruption
- Exhibits102: Impact of key risks on business
- Exhibits103: Companies covered
- Exhibits104: Matrix on companies position and classification
- Exhibits105: Agilent Technologies Inc. - Overview
- Exhibits106: Agilent Technologies Inc. - Business segments
- Exhibits107: Agilent Technologies Inc. - Key news
- Exhibits108: Agilent Technologies Inc. - Key offerings
- Exhibits109: Agilent Technologies Inc. - Segment focus
- Exhibits110: BioChain Institute Inc. - Overview
- Exhibits111: BioChain Institute Inc. - Product / Service
- Exhibits112: BioChain Institute Inc. - Key offerings
- Exhibits113: Bio Rad Laboratories Inc. - Overview
- Exhibits114: Bio Rad Laboratories Inc. - Business segments
- Exhibits115: Bio Rad Laboratories Inc. - Key news
- Exhibits116: Bio Rad Laboratories Inc. - Key offerings
- Exhibits117: Bio Rad Laboratories Inc. - Segment focus
- Exhibits118: Danaher Corp. - Overview
- Exhibits119: Danaher Corp. - Business segments
- Exhibits120: Danaher Corp. - Key news
- Exhibits121: Danaher Corp. - Key offerings
- Exhibits122: Danaher Corp. - Segment focus
- Exhibits123: Fluidigm Corp. - Overview
- Exhibits124: Fluidigm Corp. - Product / Service
- Exhibits125: Fluidigm Corp. - Key offerings
- Exhibits126: General Electric Co. - Overview
- Exhibits127: General Electric Co. - Business segments
- Exhibits128: General Electric Co. - Key news
- Exhibits129: General Electric Co. - Key offerings
- Exhibits130: General Electric Co. - Segment focus
- Exhibits131: Illumina Inc. - Overview
- Exhibits132: Illumina Inc. - Business segments
- Exhibits133: Illumina Inc. - Key news
- Exhibits134: Illumina Inc. - Key offerings
- Exhibits135: Illumina Inc. - Segment focus
- Exhibits136: Merck KGaA - Overview
- Exhibits137: Merck KGaA - Business segments
- Exhibits138: Merck KGaA - Key news
- Exhibits139: Merck KGaA - Key offerings
- Exhibits140: Merck KGaA - Segment focus
- Exhibits141: Perkin Elmer Inc. - Overview
- Exhibits142: Perkin Elmer Inc. - Business segments
- Exhibits143: Perkin Elmer Inc. - Key news
- Exhibits144: Perkin Elmer Inc. - Key offerings
- Exhibits145: Perkin Elmer Inc. - Segment focus
- Exhibits146: Thermo Fisher Scientific Inc. - Overview
- Exhibits147: Thermo Fisher Scientific Inc. - Business segments
- Exhibits148: Thermo Fisher Scientific Inc. - Key news
- Exhibits149: Thermo Fisher Scientific Inc. - Key offerings
- Exhibits150: Thermo Fisher Scientific Inc. - Segment focus
- Exhibits151: Inclusions checklist
- Exhibits152: Exclusions checklist
- Exhibits153: Currency conversion rates for US$
- Exhibits154: Research methodology
- Exhibits155: Information sources
- Exhibits156: Data validation
- Exhibits157: Validation techniques employed for market sizing
- Exhibits158: Data synthesis
- Exhibits159: 360 degree market analysis
- Exhibits160: List of abbreviations
Microarray Biochips Market 2024-2028
The microarray biochips market is forecasted to grow by USD 17275.6 mn during 2023-2028, accelerating at a CAGR of 22.2% during the forecast period. The report on the microarray biochips market provides a holistic analysis, market size and forecast, trends, growth drivers, and challenges, as well as vendor analysis covering around 25 vendors.
The report offers an up-to-date analysis regarding the current market scenario, the latest trends and drivers, and the overall market environment. The market is driven by increase in market presence with collaboration strategy, growing use of personalized medicines, and rising demand for microarray biochips in genomics and proteomics.
| Market Scope | |
|---|---|
| Base Year | 2024 |
| End Year | 2028 |
| Series Year | 2024-2028 |
| Growth Momentum | Accelerate |
| YOY 2024 | 17.9% |
| CAGR | 22.2% |
| Incremental Value | $17275.6 mn |
Technavio's microarray biochips market is segmented as below:
By Application
- Drug discovery and development
- Diagnostics and treatments
- Research and consumables
- Forensic medicines
- Others
By Geographical Landscape
- North America
- Europe
- Asia
- Rest of World (ROW)
This study identifies the emerging loc technology as one of the prime reasons driving the microarray biochips market growth during the next few years. Also, growth in bioinformatics software industry and emergence of cost-effective technologies will lead to sizable demand in the market.
The report on the microarray biochips market covers the following areas:
- Microarray Biochips Market sizing
- Microarray Biochips Market forecast
- Microarray Biochips Market industry analysis
The robust vendor analysis is designed to help clients improve their market position, and in line with this, this report provides a detailed analysis of several leading microarray biochips market vendors that include Agilent Technologies Inc., Applied Microarrays Inc., Arrayit Corp., BioChain Institute Inc., Bio Rad Laboratories Inc., BioIVT LLC, Biometrix Technology Inc., Danaher Corp., F. Hoffmann La Roche Ltd., Fluidigm Corp., General Electric Co., Illumina Inc., Merck KGaA, Pantomics Inc., Perkin Elmer Inc., Protein Biotechnologies Inc., RayBiotech Life Inc., Sengenics Corp. LLC, Super BioChips Laboratories, and Thermo Fisher Scientific Inc.. Also, the microarray biochips market analysis report includes information on upcoming trends and challenges that will influence market growth. This is to help companies strategize and leverage all forthcoming growth opportunities.
The study was conducted using an objective combination of primary and secondary information including inputs from key participants in the industry. The report contains a comprehensive market and vendor landscape in addition to an analysis of the key vendors.
The publisher presents a detailed picture of the market by the way of study, synthesis, and summation of data from multiple sources by an analysis of key parameters such as profit, pricing, competition, and promotions. It presents various market facets by identifying the key industry influencers. The data presented is comprehensive, reliable, and a result of extensive primary and secondary research. The market research reports provide a complete competitive landscape and an in-depth vendor selection methodology and analysis using qualitative and quantitative research to forecast accurate market growth.
Table of Contents
1 Executive Summary
- 1.1 Market overview
- Executive Summary - Chart on Market Overview
- Executive Summary - Data Table on Market Overview
- Executive Summary - Chart on Global Market Characteristics
- Executive Summary - Chart on Market By Geographical Landscape
- Executive Summary - Chart on Market Segmentation by Application
- Executive Summary - Chart on Incremental Growth
- Executive Summary - Data Table on Incremental Growth
- Executive Summary - Chart on Company Market Positioning
2 Market Landscape
- 2.1 Market ecosystem
- Parent Market
- Data Table on - Parent Market
- 2.2 Market characteristics
- Market characteristics analysis
- 2.3 Value chain analysis
- Value Chain Analysis
3 Market Sizing
- 3.1 Market definition
- Offerings of companies included in the market definition
- 3.2 Market segment analysis
- Market segments
- 3.3 Market size 2023
- 3.4 Market outlook: Forecast for 2023-2028
- Chart on Global - Market size and forecast 2023-2028 ($ million)
- Data Table on Global - Market size and forecast 2023-2028 ($ million)
- Chart on Global Market: Year-over-year growth 2023-2028 (%)
- Data Table on Global Market: Year-over-year growth 2023-2028 (%)
4 Historic Market Size
- 4.1 Global Microarray Biochips Market 2018 - 2022
- Historic Market Size - Data Table on Global Microarray Biochips Market 2018 - 2022 ($ million)
- 4.2 Application segment analysis 2018 - 2022
- Historic Market Size - Application Segment 2018 - 2022 ($ million)
- 4.3 Geography segment analysis 2018 - 2022
- Historic Market Size - Geography Segment 2018 - 2022 ($ million)
- 4.4 Country segment analysis 2018 - 2022
- Historic Market Size - Country Segment 2018 - 2022 ($ million)
5 Five Forces Analysis
- 5.1 Five forces summary
- Five forces analysis - Comparison between 2023 and 2028
- 5.2 Bargaining power of buyers
- Bargaining power of buyers - Impact of key factors 2023 and 2028
- 5.3 Bargaining power of suppliers
- Bargaining power of suppliers - Impact of key factors in 2023 and 2028
- 5.4 Threat of new entrants
- Threat of new entrants - Impact of key factors in 2023 and 2028
- 5.5 Threat of substitutes
- Threat of substitutes - Impact of key factors in 2023 and 2028
- 5.6 Threat of rivalry
- Threat of rivalry - Impact of key factors in 2023 and 2028
- 5.7 Market condition
- Chart on Market condition - Five forces 2023 and 2028
6 Market Segmentation by Application
- 6.1 Market segments
- Chart on Application - Market share 2023-2028 (%)
- Data Table on Application - Market share 2023-2028 (%)
- 6.2 Comparison by Application
- Chart on Comparison by Application
- Data Table on Comparison by Application
- 6.3 Drug discovery and development - Market size and forecast 2023-2028
- Chart on Drug discovery and development - Market size and forecast 2023-2028 ($ million)
- Data Table on Drug discovery and development - Market size and forecast 2023-2028 ($ million)
- Chart on Drug discovery and development - Year-over-year growth 2023-2028 (%)
- Data Table on Drug discovery and development - Year-over-year growth 2023-2028 (%)
- 6.4 Diagnostics and treatments - Market size and forecast 2023-2028
- Chart on Diagnostics and treatments - Market size and forecast 2023-2028 ($ million)
- Data Table on Diagnostics and treatments - Market size and forecast 2023-2028 ($ million)
- Chart on Diagnostics and treatments - Year-over-year growth 2023-2028 (%)
- Data Table on Diagnostics and treatments - Year-over-year growth 2023-2028 (%)
- 6.5 Research and consumables - Market size and forecast 2023-2028
- Chart on Research and consumables - Market size and forecast 2023-2028 ($ million)
- Data Table on Research and consumables - Market size and forecast 2023-2028 ($ million)
- Chart on Research and consumables - Year-over-year growth 2023-2028 (%)
- Data Table on Research and consumables - Year-over-year growth 2023-2028 (%)
- 6.6 Forensic medicines - Market size and forecast 2023-2028
- Chart on Forensic medicines - Market size and forecast 2023-2028 ($ million)
- Data Table on Forensic medicines - Market size and forecast 2023-2028 ($ million)
- Chart on Forensic medicines - Year-over-year growth 2023-2028 (%)
- Data Table on Forensic medicines - Year-over-year growth 2023-2028 (%)
- 6.7 Others - Market size and forecast 2023-2028
- Chart on Others - Market size and forecast 2023-2028 ($ million)
- Data Table on Others - Market size and forecast 2023-2028 ($ million)
- Chart on Others - Year-over-year growth 2023-2028 (%)
- Data Table on Others - Year-over-year growth 2023-2028 (%)
- 6.8 Market opportunity by Application
- Market opportunity by Application ($ million)
- Data Table on Market opportunity by Application ($ million)
7 Customer Landscape
- 7.1 Customer landscape overview
- Analysis of price sensitivity, lifecycle, customer purchase basket, adoption rates, and purchase criteria
8 Geographic Landscape
- 8.1 Geographic segmentation
- Chart on Market share By Geographical Landscape 2023-2028 (%)
- Data Table on Market share By Geographical Landscape 2023-2028 (%)
- 8.2 Geographic comparison
- Chart on Geographic comparison
- Data Table on Geographic comparison
- 8.3 North America - Market size and forecast 2023-2028
- Chart on North America - Market size and forecast 2023-2028 ($ million)
- Data Table on North America - Market size and forecast 2023-2028 ($ million)
- Chart on North America - Year-over-year growth 2023-2028 (%)
- Data Table on North America - Year-over-year growth 2023-2028 (%)
- 8.4 Europe - Market size and forecast 2023-2028
- Chart on Europe - Market size and forecast 2023-2028 ($ million)
- Data Table on Europe - Market size and forecast 2023-2028 ($ million)
- Chart on Europe - Year-over-year growth 2023-2028 (%)
- Data Table on Europe - Year-over-year growth 2023-2028 (%)
- 8.5 Asia - Market size and forecast 2023-2028
- Chart on Asia - Market size and forecast 2023-2028 ($ million)
- Data Table on Asia - Market size and forecast 2023-2028 ($ million)
- Chart on Asia - Year-over-year growth 2023-2028 (%)
- Data Table on Asia - Year-over-year growth 2023-2028 (%)
- 8.6 Rest of World (ROW) - Market size and forecast 2023-2028
- Chart on Rest of World (ROW) - Market size and forecast 2023-2028 ($ million)
- Data Table on Rest of World (ROW) - Market size and forecast 2023-2028 ($ million)
- Chart on Rest of World (ROW) - Year-over-year growth 2023-2028 (%)
- Data Table on Rest of World (ROW) - Year-over-year growth 2023-2028 (%)
- 8.7 US - Market size and forecast 2023-2028
- Chart on US - Market size and forecast 2023-2028 ($ million)
- Data Table on US - Market size and forecast 2023-2028 ($ million)
- Chart on US - Year-over-year growth 2023-2028 (%)
- Data Table on US - Year-over-year growth 2023-2028 (%)
- 8.8 UK - Market size and forecast 2023-2028
- Chart on UK - Market size and forecast 2023-2028 ($ million)
- Data Table on UK - Market size and forecast 2023-2028 ($ million)
- Chart on UK - Year-over-year growth 2023-2028 (%)
- Data Table on UK - Year-over-year growth 2023-2028 (%)
- 8.9 Germany - Market size and forecast 2023-2028
- Chart on Germany - Market size and forecast 2023-2028 ($ million)
- Data Table on Germany - Market size and forecast 2023-2028 ($ million)
- Chart on Germany - Year-over-year growth 2023-2028 (%)
- Data Table on Germany - Year-over-year growth 2023-2028 (%)
- 8.10 China - Market size and forecast 2023-2028
- Chart on China - Market size and forecast 2023-2028 ($ million)
- Data Table on China - Market size and forecast 2023-2028 ($ million)
- Chart on China - Year-over-year growth 2023-2028 (%)
- Data Table on China - Year-over-year growth 2023-2028 (%)
- 8.11 Japan - Market size and forecast 2023-2028
- Chart on Japan - Market size and forecast 2023-2028 ($ million)
- Data Table on Japan - Market size and forecast 2023-2028 ($ million)
- Chart on Japan - Year-over-year growth 2023-2028 (%)
- Data Table on Japan - Year-over-year growth 2023-2028 (%)
- 8.12 Market opportunity By Geographical Landscape
- Market opportunity By Geographical Landscape ($ million)
- Data Tables on Market opportunity By Geographical Landscape ($ million)
9 Drivers, Challenges, and Opportunity/Restraints
- 9.1 Market drivers
- 9.2 Market challenges
- 9.3 Impact of drivers and challenges
- Impact of drivers and challenges in 2023 and 2028
- 9.4 Market opportunities/restraints
10 Competitive Landscape
- 10.1 Overview
- 10.2 Competitive Landscape
- Overview on criticality of inputs and factors of differentiation
- 10.3 Landscape disruption
- Overview on factors of disruption
- 10.4 Industry risks
- Impact of key risks on business
11 Competitive Analysis
- 11.1 Companies profiled
- Companies covered
- 11.2 Market positioning of companies
- Matrix on companies position and classification
- 11.3 Agilent Technologies Inc.
- Agilent Technologies Inc. - Overview
- Agilent Technologies Inc. - Business segments
- Agilent Technologies Inc. - Key news
- Agilent Technologies Inc. - Key offerings
- Agilent Technologies Inc. - Segment focus
- 11.4 BioChain Institute Inc.
- BioChain Institute Inc. - Overview
- BioChain Institute Inc. - Product / Service
- BioChain Institute Inc. - Key offerings
- 11.5 Bio Rad Laboratories Inc.
- Bio Rad Laboratories Inc. - Overview
- Bio Rad Laboratories Inc. - Business segments
- Bio Rad Laboratories Inc. - Key news
- Bio Rad Laboratories Inc. - Key offerings
- Bio Rad Laboratories Inc. - Segment focus
- 11.6 Danaher Corp.
- Danaher Corp. - Overview
- Danaher Corp. - Business segments
- Danaher Corp. - Key news
- Danaher Corp. - Key offerings
- Danaher Corp. - Segment focus
- 11.7 Fluidigm Corp.
- Fluidigm Corp. - Overview
- Fluidigm Corp. - Product / Service
- Fluidigm Corp. - Key offerings
- 11.8 General Electric Co.
- General Electric Co. - Overview
- General Electric Co. - Business segments
- General Electric Co. - Key news
- General Electric Co. - Key offerings
- General Electric Co. - Segment focus
- 11.9 Illumina Inc.
- Illumina Inc. - Overview
- Illumina Inc. - Business segments
- Illumina Inc. - Key news
- Illumina Inc. - Key offerings
- Illumina Inc. - Segment focus
- 11.10 Merck KGaA
- Merck KGaA - Overview
- Merck KGaA - Business segments
- Merck KGaA - Key news
- Merck KGaA - Key offerings
- Merck KGaA - Segment focus
- 11.11 Perkin Elmer Inc.
- Perkin Elmer Inc. - Overview
- Perkin Elmer Inc. - Business segments
- Perkin Elmer Inc. - Key news
- Perkin Elmer Inc. - Key offerings
- Perkin Elmer Inc. - Segment focus
- 11.12 Thermo Fisher Scientific Inc.
- Thermo Fisher Scientific Inc. - Overview
- Thermo Fisher Scientific Inc. - Business segments
- Thermo Fisher Scientific Inc. - Key news
- Thermo Fisher Scientific Inc. - Key offerings
- Thermo Fisher Scientific Inc. - Segment focus
12 Appendix
- 12.1 Scope of the report
- 12.2 Inclusions and exclusions checklist
- Inclusions checklist
- Exclusions checklist
- 12.3 Currency conversion rates for US$
- Currency conversion rates for US$
- 12.4 Research methodology
- Research methodology
- 12.5 Data procurement
- Information sources
- 12.6 Data validation
- Data validation
- 12.7 Validation techniques employed for market sizing
- Validation techniques employed for market sizing
- 12.8 Data synthesis
- Data synthesis
- 12.9 360 degree market analysis
- 360 degree market analysis
- 12.10 List of abbreviations
- List of abbreviations

