|
|
市場調査レポート
商品コード
1603705
毛布の世界市場 2024年~2028年Global Blanket Market 2024-2028 |
||||||
|
|||||||
カスタマイズ可能
|
|||||||


| 毛布の世界市場 2024年~2028年 |
|
出版日: 2024年10月29日
発行: TechNavio
ページ情報: 英文 128 Pages
納期: 即納可能
|

全表示
- 概要
- 図表
- 目次
毛布市場2024年~2028年
毛布市場は2023年~2028年に15億9,560万米ドル、予測期間中のCAGRは3.8%で成長すると予測されます。当レポートでは、毛布市場の全体的な分析、市場規模・予測、動向、成長促進要因、課題、約25のベンダーを網羅したベンダー分析などを掲載しています。
現在の市場シナリオ、最新動向と促進要因、市場環境全体に関する最新分析を提供しています。住宅・商業建設業界の成長、新興国市場における消費者の可処分所得の増加、電気毛布の普及拡大などが市場を牽引しています。
| 市場範囲 | |
|---|---|
| 基準年 | 2024 |
| 終了年 | 2028 |
| 予測期間 | 2024-2028 |
| 成長モメンタム | 加速 |
| 前年比2024年 | 3.7% |
| CAGR | 3.8% |
| 増分額 | 15億9,560万米ドル |
本調査では、今後数年間の毛布市場の成長を促進する主な要因の1つとして、消費者の嗜好が持続可能な毛布にシフトしていることを挙げています。また、オンライン小売販売の急成長や旅行・アウトドア用毛布の人気の高まりは、市場の大きな需要につながると思われます。
目次
第1章 エグゼクティブサマリー
- 市場概要
第2章 市場情勢
- 市場エコシステム
- 市場の特徴
- バリューチェーン分析
第3章 市場規模
- 市場の定義
- 市場セグメント分析
- 市場規模 2023年
- 市場の見通し 2023年~2028年
第4章 市場規模実績
- 毛布の世界市場 2018年~2022年
- 流通チャネル別セグメント分析 2018年~2022年
- 地域別セグメント分析 2018年~2022年
- 国別セグメント分析 2018年~2022年
第5章 ファイブフォース分析
- ファイブフォースの要約
- 買い手の交渉力
- 供給企業の交渉力
- 新規参入業者の脅威
- 代替品の脅威
- 競争の脅威
- 市況
第6章 市場セグメンテーション:流通チャネル別
- 市場セグメント
- 比較:流通チャネル別
- オフライン:市場規模と予測 2023年~2028年
- オンライン:市場規模と予測 2023年~2028年
- 市場機会:流通チャネル別
第7章 顧客情勢
- 顧客情勢の概要
第8章 地域別情勢
- 地域別セグメンテーション
- 地域別比較
- アジア太平洋:市場規模と予測 2023年~2028年
- 北米:市場規模と予測 2023年~2028年
- 欧州:市場規模と予測 2023年~2028年
- 中東・アフリカ:市場規模と予測 2023年~2028年
- 南米:市場規模と予測 2023年~2028年
- 中国:市場規模と予測 2023年~2028年
- 米国:市場規模と予測 2023年~2028年
- インド:市場規模と予測 2023年~2028年
- ドイツ:市場規模と予測 2023年~2028年
- カナダ:市場規模と予測 2023年~2028年
- 市場機会:地域情勢別
第9章 促進要因・課題・機会・抑制要因
- 市場促進要因
- 市場の課題
- 促進要因と課題の影響
- 市場の機会・抑制要因
第10章 競合情勢
- 概要
- 競合情勢
- 混乱の状況
- 業界のリスク
第11章 競合分析
- 企業プロファイル
- 企業の市場ポジショニング
- American Blanket Co.
- Boll and Branch LLC
- Faribault Woolen Mill Co.
- Harshit International
- Kanata Blanket Co.
- Medline Industries LP
- New Zealand Wool Blankets Ltd.
- Newell Brands Inc.
- Pendleton Woolen Mills Inc.
- Urbanara GmbH
第12章 付録
Exhibits:
- Exhibits1: Executive Summary - Chart on Market Overview
- Exhibits2: Executive Summary - Data Table on Market Overview
- Exhibits3: Executive Summary - Chart on Global Market Characteristics
- Exhibits4: Executive Summary - Chart on Market By Geographical Landscape
- Exhibits5: Executive Summary - Chart on Market Segmentation by Distribution Channel
- Exhibits6: Executive Summary - Chart on Incremental Growth
- Exhibits7: Executive Summary - Data Table on Incremental Growth
- Exhibits8: Executive Summary - Chart on Company Market Positioning
- Exhibits9: Parent Market
- Exhibits10: Data Table on - Parent Market
- Exhibits11: Market characteristics analysis
- Exhibits12: Value Chain Analysis
- Exhibits13: Offerings of companies included in the market definition
- Exhibits14: Market segments
- Exhibits15: Chart on Global - Market size and forecast 2023-2028 ($ million)
- Exhibits16: Data Table on Global - Market size and forecast 2023-2028 ($ million)
- Exhibits17: Chart on Global Market: Year-over-year growth 2023-2028 (%)
- Exhibits18: Data Table on Global Market: Year-over-year growth 2023-2028 (%)
- Exhibits19: Historic Market Size - Data Table on Global Blanket Market 2018 - 2022 ($ million)
- Exhibits20: Historic Market Size - Distribution Channel Segment 2018 - 2022 ($ million)
- Exhibits21: Historic Market Size - Geography Segment 2018 - 2022 ($ million)
- Exhibits22: Historic Market Size - Country Segment 2018 - 2022 ($ million)
- Exhibits23: Five forces analysis - Comparison between 2023 and 2028
- Exhibits24: Bargaining power of buyers - Impact of key factors 2023 and 2028
- Exhibits25: Bargaining power of suppliers - Impact of key factors in 2023 and 2028
- Exhibits26: Threat of new entrants - Impact of key factors in 2023 and 2028
- Exhibits27: Threat of substitutes - Impact of key factors in 2023 and 2028
- Exhibits28: Threat of rivalry - Impact of key factors in 2023 and 2028
- Exhibits29: Chart on Market condition - Five forces 2023 and 2028
- Exhibits30: Chart on Distribution Channel - Market share 2023-2028 (%)
- Exhibits31: Data Table on Distribution Channel - Market share 2023-2028 (%)
- Exhibits32: Chart on Comparison by Distribution Channel
- Exhibits33: Data Table on Comparison by Distribution Channel
- Exhibits34: Chart on Offline - Market size and forecast 2023-2028 ($ million)
- Exhibits35: Data Table on Offline - Market size and forecast 2023-2028 ($ million)
- Exhibits36: Chart on Offline - Year-over-year growth 2023-2028 (%)
- Exhibits37: Data Table on Offline - Year-over-year growth 2023-2028 (%)
- Exhibits38: Chart on Online - Market size and forecast 2023-2028 ($ million)
- Exhibits39: Data Table on Online - Market size and forecast 2023-2028 ($ million)
- Exhibits40: Chart on Online - Year-over-year growth 2023-2028 (%)
- Exhibits41: Data Table on Online - Year-over-year growth 2023-2028 (%)
- Exhibits42: Market opportunity by Distribution Channel ($ million)
- Exhibits43: Data Table on Market opportunity by Distribution Channel ($ million)
- Exhibits44: Analysis of price sensitivity, lifecycle, customer purchase basket, adoption rates, and purchase criteria
- Exhibits45: Chart on Market share By Geographical Landscape 2023-2028 (%)
- Exhibits46: Data Table on Market share By Geographical Landscape 2023-2028 (%)
- Exhibits47: Chart on Geographic comparison
- Exhibits48: Data Table on Geographic comparison
- Exhibits49: Chart on APAC - Market size and forecast 2023-2028 ($ million)
- Exhibits50: Data Table on APAC - Market size and forecast 2023-2028 ($ million)
- Exhibits51: Chart on APAC - Year-over-year growth 2023-2028 (%)
- Exhibits52: Data Table on APAC - Year-over-year growth 2023-2028 (%)
- Exhibits53: Chart on North America - Market size and forecast 2023-2028 ($ million)
- Exhibits54: Data Table on North America - Market size and forecast 2023-2028 ($ million)
- Exhibits55: Chart on North America - Year-over-year growth 2023-2028 (%)
- Exhibits56: Data Table on North America - Year-over-year growth 2023-2028 (%)
- Exhibits57: Chart on Europe - Market size and forecast 2023-2028 ($ million)
- Exhibits58: Data Table on Europe - Market size and forecast 2023-2028 ($ million)
- Exhibits59: Chart on Europe - Year-over-year growth 2023-2028 (%)
- Exhibits60: Data Table on Europe - Year-over-year growth 2023-2028 (%)
- Exhibits61: Chart on Middle East and Africa - Market size and forecast 2023-2028 ($ million)
- Exhibits62: Data Table on Middle East and Africa - Market size and forecast 2023-2028 ($ million)
- Exhibits63: Chart on Middle East and Africa - Year-over-year growth 2023-2028 (%)
- Exhibits64: Data Table on Middle East and Africa - Year-over-year growth 2023-2028 (%)
- Exhibits65: Chart on South America - Market size and forecast 2023-2028 ($ million)
- Exhibits66: Data Table on South America - Market size and forecast 2023-2028 ($ million)
- Exhibits67: Chart on South America - Year-over-year growth 2023-2028 (%)
- Exhibits68: Data Table on South America - Year-over-year growth 2023-2028 (%)
- Exhibits69: Chart on China - Market size and forecast 2023-2028 ($ million)
- Exhibits70: Data Table on China - Market size and forecast 2023-2028 ($ million)
- Exhibits71: Chart on China - Year-over-year growth 2023-2028 (%)
- Exhibits72: Data Table on China - Year-over-year growth 2023-2028 (%)
- Exhibits73: Chart on US - Market size and forecast 2023-2028 ($ million)
- Exhibits74: Data Table on US - Market size and forecast 2023-2028 ($ million)
- Exhibits75: Chart on US - Year-over-year growth 2023-2028 (%)
- Exhibits76: Data Table on US - Year-over-year growth 2023-2028 (%)
- Exhibits77: Chart on India - Market size and forecast 2023-2028 ($ million)
- Exhibits78: Data Table on India - Market size and forecast 2023-2028 ($ million)
- Exhibits79: Chart on India - Year-over-year growth 2023-2028 (%)
- Exhibits80: Data Table on India - Year-over-year growth 2023-2028 (%)
- Exhibits81: Chart on Germany - Market size and forecast 2023-2028 ($ million)
- Exhibits82: Data Table on Germany - Market size and forecast 2023-2028 ($ million)
- Exhibits83: Chart on Germany - Year-over-year growth 2023-2028 (%)
- Exhibits84: Data Table on Germany - Year-over-year growth 2023-2028 (%)
- Exhibits85: Chart on Canada - Market size and forecast 2023-2028 ($ million)
- Exhibits86: Data Table on Canada - Market size and forecast 2023-2028 ($ million)
- Exhibits87: Chart on Canada - Year-over-year growth 2023-2028 (%)
- Exhibits88: Data Table on Canada - Year-over-year growth 2023-2028 (%)
- Exhibits89: Market opportunity By Geographical Landscape ($ million)
- Exhibits90: Data Tables on Market opportunity By Geographical Landscape ($ million)
- Exhibits91: Impact of drivers and challenges in 2023 and 2028
- Exhibits92: Overview on criticality of inputs and factors of differentiation
- Exhibits93: Overview on factors of disruption
- Exhibits94: Impact of key risks on business
- Exhibits95: Companies covered
- Exhibits96: Matrix on companies position and classification
- Exhibits97: American Blanket Co. - Overview
- Exhibits98: American Blanket Co. - Product / Service
- Exhibits99: American Blanket Co. - Key offerings
- Exhibits100: Boll and Branch LLC - Overview
- Exhibits101: Boll and Branch LLC - Product / Service
- Exhibits102: Boll and Branch LLC - Key offerings
- Exhibits103: Faribault Woolen Mill Co. - Overview
- Exhibits104: Faribault Woolen Mill Co. - Product / Service
- Exhibits105: Faribault Woolen Mill Co. - Key offerings
- Exhibits106: Harshit International - Overview
- Exhibits107: Harshit International - Product / Service
- Exhibits108: Harshit International - Key offerings
- Exhibits109: Kanata Blanket Co. - Overview
- Exhibits110: Kanata Blanket Co. - Product / Service
- Exhibits111: Kanata Blanket Co. - Key offerings
- Exhibits112: Medline Industries LP - Overview
- Exhibits113: Medline Industries LP - Product / Service
- Exhibits114: Medline Industries LP - Key offerings
- Exhibits115: New Zealand Wool Blankets Ltd. - Overview
- Exhibits116: New Zealand Wool Blankets Ltd. - Product / Service
- Exhibits117: New Zealand Wool Blankets Ltd. - Key offerings
- Exhibits118: Newell Brands Inc. - Overview
- Exhibits119: Newell Brands Inc. - Business segments
- Exhibits120: Newell Brands Inc. - Key news
- Exhibits121: Newell Brands Inc. - Key offerings
- Exhibits122: Newell Brands Inc. - Segment focus
- Exhibits123: Pendleton Woolen Mills Inc. - Overview
- Exhibits124: Pendleton Woolen Mills Inc. - Product / Service
- Exhibits125: Pendleton Woolen Mills Inc. - Key offerings
- Exhibits126: Urbanara GmbH - Overview
- Exhibits127: Urbanara GmbH - Product / Service
- Exhibits128: Urbanara GmbH - Key offerings
- Exhibits129: Inclusions checklist
- Exhibits130: Exclusions checklist
- Exhibits131: Currency conversion rates for US$
- Exhibits132: Research methodology
- Exhibits133: Information sources
- Exhibits134: Data validation
- Exhibits135: Validation techniques employed for market sizing
- Exhibits136: Data synthesis
- Exhibits137: 360 degree market analysis
- Exhibits138: List of abbreviations
Blanket Market 2024-2028
The blanket market is forecasted to grow by USD 1595.6 mn during 2023-2028, accelerating at a CAGR of 3.8% during the forecast period. The report on the blanket market provides a holistic analysis, market size and forecast, trends, growth drivers, and challenges, as well as vendor analysis covering around 25 vendors.
The report offers an up-to-date analysis regarding the current market scenario, the latest trends and drivers, and the overall market environment. The market is driven by growing residential and commercial construction industry, rise in disposable income of consumers in developing countries, and increasing penetration of electric blankets.
| Market Scope | |
|---|---|
| Base Year | 2024 |
| End Year | 2028 |
| Series Year | 2024-2028 |
| Growth Momentum | Accelerate |
| YOY 2024 | 3.7% |
| CAGR | 3.8% |
| Incremental Value | $1595.6 mn |
Technavio's blanket market is segmented as below:
By Distribution Channel
- Offline
- Online
By Geographical Landscape
- APAC
- North America
- Europe
- Middle East and Africa
- South America
This study identifies the consumer preferences shifting toward sustainable blankets as one of the prime reasons driving the blanket market growth during the next few years. Also, rapid growth in online retail sales and rising popularity of travel and outdoor blankets will lead to sizable demand in the market.
The report on the blanket market covers the following areas:
- Blanket Market sizing
- Blanket Market forecast
- Blanket Market industry analysis
The robust vendor analysis is designed to help clients improve their market position, and in line with this, this report provides a detailed analysis of several leading blanket market vendors that include American Blanket Co., Amritsar Swadeshi Textile Corp. Pvt. Ltd., Barker Textiles UAB, Biddeford Blankets LLC, Boll and Branch LLC, Chellco Industries Ltd., Faribault Woolen Mill Co., Geetanjali Woollens Pvt. Ltd., Harshit International, Jindal Woollen Industries Ltd., Kanata Blanket Co., Medline Industries LP, New Zealand Wool Blankets Ltd., Newell Brands Inc., Odessey Products, Pendleton Woolen Mills Inc., Prakash Woollen and Synthetic Mills Ltd., Qbedding Inc., Urbanara GmbH, and Youngman Woollen Mills Pvt. Ltd.. Also, the blanket market analysis report includes information on upcoming trends and challenges that will influence market growth. This is to help companies strategize and leverage all forthcoming growth opportunities.
The study was conducted using an objective combination of primary and secondary information including inputs from key participants in the industry. The report contains a comprehensive market and vendor landscape in addition to an analysis of the key vendors.
The publisher presents a detailed picture of the market by the way of study, synthesis, and summation of data from multiple sources by an analysis of key parameters such as profit, pricing, competition, and promotions. It presents various market facets by identifying the key industry influencers. The data presented is comprehensive, reliable, and a result of extensive primary and secondary research. The market research reports provide a complete competitive landscape and an in-depth vendor selection methodology and analysis using qualitative and quantitative research to forecast accurate market growth.
Table of Contents
1 Executive Summary
- 1.1 Market overview
- Executive Summary - Chart on Market Overview
- Executive Summary - Data Table on Market Overview
- Executive Summary - Chart on Global Market Characteristics
- Executive Summary - Chart on Market By Geographical Landscape
- Executive Summary - Chart on Market Segmentation by Distribution Channel
- Executive Summary - Chart on Incremental Growth
- Executive Summary - Data Table on Incremental Growth
- Executive Summary - Chart on Company Market Positioning
2 Market Landscape
- 2.1 Market ecosystem
- Parent Market
- Data Table on - Parent Market
- 2.2 Market characteristics
- Market characteristics analysis
- 2.3 Value chain analysis
- Value Chain Analysis
3 Market Sizing
- 3.1 Market definition
- Offerings of companies included in the market definition
- 3.2 Market segment analysis
- Market segments
- 3.3 Market size 2023
- 3.4 Market outlook: Forecast for 2023-2028
- Chart on Global - Market size and forecast 2023-2028 ($ million)
- Data Table on Global - Market size and forecast 2023-2028 ($ million)
- Chart on Global Market: Year-over-year growth 2023-2028 (%)
- Data Table on Global Market: Year-over-year growth 2023-2028 (%)
4 Historic Market Size
- 4.1 Global Blanket Market 2018 - 2022
- Historic Market Size - Data Table on Global Blanket Market 2018 - 2022 ($ million)
- 4.2 Distribution Channel segment analysis 2018 - 2022
- Historic Market Size - Distribution Channel Segment 2018 - 2022 ($ million)
- 4.3 Geography segment analysis 2018 - 2022
- Historic Market Size - Geography Segment 2018 - 2022 ($ million)
- 4.4 Country segment analysis 2018 - 2022
- Historic Market Size - Country Segment 2018 - 2022 ($ million)
5 Five Forces Analysis
- 5.1 Five forces summary
- Five forces analysis - Comparison between 2023 and 2028
- 5.2 Bargaining power of buyers
- Bargaining power of buyers - Impact of key factors 2023 and 2028
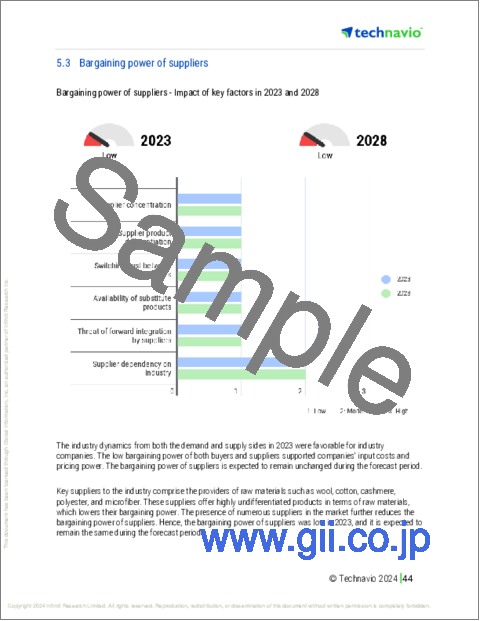
- 5.3 Bargaining power of suppliers
- Bargaining power of suppliers - Impact of key factors in 2023 and 2028
- 5.4 Threat of new entrants
- Threat of new entrants - Impact of key factors in 2023 and 2028
- 5.5 Threat of substitutes
- Threat of substitutes - Impact of key factors in 2023 and 2028
- 5.6 Threat of rivalry
- Threat of rivalry - Impact of key factors in 2023 and 2028
- 5.7 Market condition
- Chart on Market condition - Five forces 2023 and 2028
6 Market Segmentation by Distribution Channel
- 6.1 Market segments
- Chart on Distribution Channel - Market share 2023-2028 (%)
- Data Table on Distribution Channel - Market share 2023-2028 (%)
- 6.2 Comparison by Distribution Channel
- Chart on Comparison by Distribution Channel
- Data Table on Comparison by Distribution Channel
- 6.3 Offline - Market size and forecast 2023-2028
- Chart on Offline - Market size and forecast 2023-2028 ($ million)
- Data Table on Offline - Market size and forecast 2023-2028 ($ million)
- Chart on Offline - Year-over-year growth 2023-2028 (%)
- Data Table on Offline - Year-over-year growth 2023-2028 (%)
- 6.4 Online - Market size and forecast 2023-2028
- Chart on Online - Market size and forecast 2023-2028 ($ million)
- Data Table on Online - Market size and forecast 2023-2028 ($ million)
- Chart on Online - Year-over-year growth 2023-2028 (%)
- Data Table on Online - Year-over-year growth 2023-2028 (%)
- 6.5 Market opportunity by Distribution Channel
- Market opportunity by Distribution Channel ($ million)
- Data Table on Market opportunity by Distribution Channel ($ million)
7 Customer Landscape
- 7.1 Customer landscape overview
- Analysis of price sensitivity, lifecycle, customer purchase basket, adoption rates, and purchase criteria
8 Geographic Landscape
- 8.1 Geographic segmentation
- Chart on Market share By Geographical Landscape 2023-2028 (%)
- Data Table on Market share By Geographical Landscape 2023-2028 (%)
- 8.2 Geographic comparison
- Chart on Geographic comparison
- Data Table on Geographic comparison
- 8.3 APAC - Market size and forecast 2023-2028
- Chart on APAC - Market size and forecast 2023-2028 ($ million)
- Data Table on APAC - Market size and forecast 2023-2028 ($ million)
- Chart on APAC - Year-over-year growth 2023-2028 (%)
- Data Table on APAC - Year-over-year growth 2023-2028 (%)
- 8.4 North America - Market size and forecast 2023-2028
- Chart on North America - Market size and forecast 2023-2028 ($ million)
- Data Table on North America - Market size and forecast 2023-2028 ($ million)
- Chart on North America - Year-over-year growth 2023-2028 (%)
- Data Table on North America - Year-over-year growth 2023-2028 (%)
- 8.5 Europe - Market size and forecast 2023-2028
- Chart on Europe - Market size and forecast 2023-2028 ($ million)
- Data Table on Europe - Market size and forecast 2023-2028 ($ million)
- Chart on Europe - Year-over-year growth 2023-2028 (%)
- Data Table on Europe - Year-over-year growth 2023-2028 (%)
- 8.6 Middle East and Africa - Market size and forecast 2023-2028
- Chart on Middle East and Africa - Market size and forecast 2023-2028 ($ million)
- Data Table on Middle East and Africa - Market size and forecast 2023-2028 ($ million)
- Chart on Middle East and Africa - Year-over-year growth 2023-2028 (%)
- Data Table on Middle East and Africa - Year-over-year growth 2023-2028 (%)
- 8.7 South America - Market size and forecast 2023-2028
- Chart on South America - Market size and forecast 2023-2028 ($ million)
- Data Table on South America - Market size and forecast 2023-2028 ($ million)
- Chart on South America - Year-over-year growth 2023-2028 (%)
- Data Table on South America - Year-over-year growth 2023-2028 (%)
- 8.8 China - Market size and forecast 2023-2028
- Chart on China - Market size and forecast 2023-2028 ($ million)
- Data Table on China - Market size and forecast 2023-2028 ($ million)
- Chart on China - Year-over-year growth 2023-2028 (%)
- Data Table on China - Year-over-year growth 2023-2028 (%)
- 8.9 US - Market size and forecast 2023-2028
- Chart on US - Market size and forecast 2023-2028 ($ million)
- Data Table on US - Market size and forecast 2023-2028 ($ million)
- Chart on US - Year-over-year growth 2023-2028 (%)
- Data Table on US - Year-over-year growth 2023-2028 (%)
- 8.10 India - Market size and forecast 2023-2028
- Chart on India - Market size and forecast 2023-2028 ($ million)
- Data Table on India - Market size and forecast 2023-2028 ($ million)
- Chart on India - Year-over-year growth 2023-2028 (%)
- Data Table on India - Year-over-year growth 2023-2028 (%)
- 8.11 Germany - Market size and forecast 2023-2028
- Chart on Germany - Market size and forecast 2023-2028 ($ million)
- Data Table on Germany - Market size and forecast 2023-2028 ($ million)
- Chart on Germany - Year-over-year growth 2023-2028 (%)
- Data Table on Germany - Year-over-year growth 2023-2028 (%)
- 8.12 Canada - Market size and forecast 2023-2028
- Chart on Canada - Market size and forecast 2023-2028 ($ million)
- Data Table on Canada - Market size and forecast 2023-2028 ($ million)
- Chart on Canada - Year-over-year growth 2023-2028 (%)
- Data Table on Canada - Year-over-year growth 2023-2028 (%)
- 8.13 Market opportunity By Geographical Landscape
- Market opportunity By Geographical Landscape ($ million)
- Data Tables on Market opportunity By Geographical Landscape ($ million)
9 Drivers, Challenges, and Opportunity/Restraints
- 9.1 Market drivers
- 9.2 Market challenges
- 9.3 Impact of drivers and challenges
- Impact of drivers and challenges in 2023 and 2028
- 9.4 Market opportunities/restraints
10 Competitive Landscape
- 10.1 Overview
- 10.2 Competitive Landscape
- Overview on criticality of inputs and factors of differentiation
- 10.3 Landscape disruption
- Overview on factors of disruption
- 10.4 Industry risks
- Impact of key risks on business
11 Competitive Analysis
- 11.1 Companies profiled
- Companies covered
- 11.2 Market positioning of companies
- Matrix on companies position and classification
- 11.3 American Blanket Co.
- American Blanket Co. - Overview
- American Blanket Co. - Product / Service
- American Blanket Co. - Key offerings
- 11.4 Boll and Branch LLC
- Boll and Branch LLC - Overview
- Boll and Branch LLC - Product / Service
- Boll and Branch LLC - Key offerings
- 11.5 Faribault Woolen Mill Co.
- Faribault Woolen Mill Co. - Overview
- Faribault Woolen Mill Co. - Product / Service
- Faribault Woolen Mill Co. - Key offerings
- 11.6 Harshit International
- Harshit International - Overview
- Harshit International - Product / Service
- Harshit International - Key offerings
- 11.7 Kanata Blanket Co.
- Kanata Blanket Co. - Overview
- Kanata Blanket Co. - Product / Service
- Kanata Blanket Co. - Key offerings
- 11.8 Medline Industries LP
- Medline Industries LP - Overview
- Medline Industries LP - Product / Service
- Medline Industries LP - Key offerings
- 11.9 New Zealand Wool Blankets Ltd.
- New Zealand Wool Blankets Ltd. - Overview
- New Zealand Wool Blankets Ltd. - Product / Service
- New Zealand Wool Blankets Ltd. - Key offerings
- 11.10 Newell Brands Inc.
- Newell Brands Inc. - Overview
- Newell Brands Inc. - Business segments
- Newell Brands Inc. - Key news
- Newell Brands Inc. - Key offerings
- Newell Brands Inc. - Segment focus
- 11.11 Pendleton Woolen Mills Inc.
- Pendleton Woolen Mills Inc. - Overview
- Pendleton Woolen Mills Inc. - Product / Service
- Pendleton Woolen Mills Inc. - Key offerings
- 11.12 Urbanara GmbH
- Urbanara GmbH - Overview
- Urbanara GmbH - Product / Service
- Urbanara GmbH - Key offerings
12 Appendix
- 12.1 Scope of the report
- 12.2 Inclusions and exclusions checklist
- Inclusions checklist
- Exclusions checklist
- 12.3 Currency conversion rates for US$
- Currency conversion rates for US$
- 12.4 Research methodology
- Research methodology
- 12.5 Data procurement
- Information sources
- 12.6 Data validation
- Data validation
- 12.7 Validation techniques employed for market sizing
- Validation techniques employed for market sizing
- 12.8 Data synthesis
- Data synthesis
- 12.9 360 degree market analysis
- 360 degree market analysis
- 12.10 List of abbreviations
- List of abbreviations
