|
|
市場調査レポート
商品コード
1601931
尿失禁デバイスの世界市場 (2024~2028年)Global Urinary Incontinence Devices Market 2024-2028 |
||||||

|
|||||||
カスタマイズ可能
|
|||||||

| 尿失禁デバイスの世界市場 (2024~2028年) |
|
出版日: 2024年11月14日
発行: TechNavio
ページ情報: 英文 171 Pages
納期: 即納可能
|

全表示
- 概要
- 図表
- 目次
尿失禁デバイス市場 (2024~2028年)
尿失禁デバイス市場は2023-2028年に17億2,530万米ドル分拡大し、予測期間中に10.4%のCAGRで成長すると予測されます。当レポートでは、尿失禁デバイス市場の全体的な分析、市場規模・予測、動向、成長促進要因、課題、約25のベンダーを網羅したベンダー分析などを掲載しています。
当レポートでは、現在の市場シナリオ、最新動向と促進要因、市場環境全体に関する最新分析を提供しています。尿失禁につながる身体的・医学的疾患の有病率の増加、新発売による費用対効果の高い製品の拡大、戦略的提携による事業拡大などが市場を牽引しています。
| 市場範囲 | |
|---|---|
| 基準年 | 2024年 |
| 終了年 | 2028年 |
| 予測期間 | 2024~2028年 |
| 成長モメンタム | 加速 |
| 前年比 (2024年) | 9.1% |
| CAGR | 10.4% |
| 増分額 | 17億2,530万米ドル |
当レポートでは、今後数年間における尿失禁デバイス市場の成長を促進する主な要因の1つとして、泌尿器科専門医療の提供に注力していることを挙げています。また、製品の技術進歩、尿失禁に対するロボット手術の採用、尿失禁デバイスのマーケティングキャンペーンの活性化、オンライン販売の拡大が市場の大きな需要につながります。
目次
第1章 エグゼクティブサマリー
- 市場概要
第2章 Technavioによる分析
- 価格感応度・ライフサイクル・顧客購入バスケット・採用率・購入基準の分析
- インプットの重要性と差別化の要因
- 混乱の要因
- 促進要因と課題の影響
第3章 市場情勢
- 市場エコシステム
- 市場の特徴
- バリューチェーン分析
第4章 市場規模
- 市場の定義
- 市場セグメント分析
- 市場規模 (2023年)
- 市場の見通し (2023~2028年)
第5章 市場規模実績
- 尿失禁デバイスの世界市場 (2018~2022年)
- 製品別分析 (2018~2022年)
- 地域別分析 (2018~2022年)
- 国別分析 (2018~2022年)
第6章 定性分析
- AIの影響:尿失禁デバイスの世界市場
第7章 ファイブフォース分析
- ファイブフォースの要約
- 買い手の交渉力
- 供給企業の交渉力
- 新規参入業者の脅威
- 代替品の脅威
- 競争の脅威
- 市況
第8章 市場セグメンテーション:製品別
- 市場セグメント
- 比較:製品別
- 尿スリング:市場規模と予測 (2023~2028年)
- 神経調節装置:市場規模と予測 (2023~2028年)
- 尿道カテーテル:市場規模と予測 (2023~2028年)
- 市場機会:製品別
第9章 顧客情勢
- 顧客情勢の概要
第10章 地域別情勢
- 地域別セグメンテーション
- 地域別比較
- 北米:市場規模と予測 (2023~2028年)
- 欧州:市場規模と予測 (2023~2028年)
- アジア:市場規模と予測 (2023~2028年)
- 世界のその他の地域:市場規模と予測 (2023~2028年)
- 米国:市場規模と予測 (2023~2028年)
- ドイツ:市場規模と予測 (2023~2028年)
- 英国:市場規模と予測 (2023~2028年)
- カナダ:市場規模と予測 (2023~2028年)
- 中国:市場規模と予測 (2023~2028年)
- フランス:市場規模と予測 (2023~2028年)
- 日本:市場規模と予測 (2023~2028年)
- イタリア:市場規模と予測 (2023~2028年)
- インド:市場規模と予測 (2023~2028年)
- スペイン:市場規模と予測 (2023~2028年)
- 市場機会:地域別
第11章 促進要因・課題・機会・抑制要因
- 市場促進要因
- 市場の課題
- 促進要因と課題の影響
- 市場の機会・抑制要因
第12章 競合情勢
- 概要
- 競合情勢
- 混乱の状況
- 業界のリスク
第13章 競合分析
- 企業プロファイル
- 企業ランキング指数
- 企業の市場ポジショニング
- A.M.I. GmbH
- Becton Dickinson and Co.
- Caldera Medical Inc.
- Coloplast AS
- Control Flo Medical LLC
- ConvaTec Group Plc
- Hollister Inc.
- Johnson and Johnson Inc.
- Medtronic Plc
- Teleflex Inc.
第14章 付録
Exhibits:
- Exhibits1: Executive Summary - Chart on Market Overview
- Exhibits2: Executive Summary - Data Table on Market Overview
- Exhibits3: Executive Summary - Chart on Global Market Characteristics
- Exhibits4: Executive Summary - Chart on Market By Geographical Landscape
- Exhibits5: Executive Summary - Chart on Market Segmentation by Product
- Exhibits6: Executive Summary - Chart on Incremental Growth
- Exhibits7: Executive Summary - Data Table on Incremental Growth
- Exhibits8: Executive Summary - Chart on Company Market Positioning
- Exhibits9: Analysis of price sensitivity, lifecycle, customer purchase basket, adoption rates, and purchase criteria
- Exhibits10: Overview on criticality of inputs and factors of differentiation
- Exhibits11: Overview on factors of disruption
- Exhibits12: Impact of drivers and challenges in 2023 and 2028
- Exhibits13: Parent Market
- Exhibits14: Data Table on - Parent Market
- Exhibits15: Market characteristics analysis
- Exhibits16: Value Chain Analysis
- Exhibits17: Offerings of companies included in the market definition
- Exhibits18: Market segments
- Exhibits19: Chart on Global - Market size and forecast 2023-2028 ($ million)
- Exhibits20: Data Table on Global - Market size and forecast 2023-2028 ($ million)
- Exhibits21: Chart on Global Market: Year-over-year growth 2023-2028 (%)
- Exhibits22: Data Table on Global Market: Year-over-year growth 2023-2028 (%)
- Exhibits23: Historic Market Size - Data Table on Global Urinary Incontinence Devices Market 2018 - 2022 ($ million)
- Exhibits24: Historic Market Size - Product Segment 2018 - 2022 ($ million)
- Exhibits25: Historic Market Size - Geography Segment 2018 - 2022 ($ million)
- Exhibits26: Historic Market Size - Country Segment 2018 - 2022 ($ million)
- Exhibits27: Five forces analysis - Comparison between 2023 and 2028
- Exhibits28: Bargaining power of buyers - Impact of key factors 2023 and 2028
- Exhibits29: Bargaining power of suppliers - Impact of key factors in 2023 and 2028
- Exhibits30: Threat of new entrants - Impact of key factors in 2023 and 2028
- Exhibits31: Threat of substitutes - Impact of key factors in 2023 and 2028
- Exhibits32: Threat of rivalry - Impact of key factors in 2023 and 2028
- Exhibits33: Chart on Market condition - Five forces 2023 and 2028
- Exhibits34: Chart on Product - Market share 2023-2028 (%)
- Exhibits35: Data Table on Product - Market share 2023-2028 (%)
- Exhibits36: Chart on Comparison by Product
- Exhibits37: Data Table on Comparison by Product
- Exhibits38: Chart on Urinary slings - Market size and forecast 2023-2028 ($ million)
- Exhibits39: Data Table on Urinary slings - Market size and forecast 2023-2028 ($ million)
- Exhibits40: Chart on Urinary slings - Year-over-year growth 2023-2028 (%)
- Exhibits41: Data Table on Urinary slings - Year-over-year growth 2023-2028 (%)
- Exhibits42: Chart on Neuromodulation devices - Market size and forecast 2023-2028 ($ million)
- Exhibits43: Data Table on Neuromodulation devices - Market size and forecast 2023-2028 ($ million)
- Exhibits44: Chart on Neuromodulation devices - Year-over-year growth 2023-2028 (%)
- Exhibits45: Data Table on Neuromodulation devices - Year-over-year growth 2023-2028 (%)
- Exhibits46: Chart on Urinary catheters - Market size and forecast 2023-2028 ($ million)
- Exhibits47: Data Table on Urinary catheters - Market size and forecast 2023-2028 ($ million)
- Exhibits48: Chart on Urinary catheters - Year-over-year growth 2023-2028 (%)
- Exhibits49: Data Table on Urinary catheters - Year-over-year growth 2023-2028 (%)
- Exhibits50: Market opportunity by Product ($ million)
- Exhibits51: Data Table on Market opportunity by Product ($ million)
- Exhibits52: Analysis of price sensitivity, lifecycle, customer purchase basket, adoption rates, and purchase criteria
- Exhibits53: Chart on Market share By Geographical Landscape 2023-2028 (%)
- Exhibits54: Data Table on Market share By Geographical Landscape 2023-2028 (%)
- Exhibits55: Chart on Geographic comparison
- Exhibits56: Data Table on Geographic comparison
- Exhibits57: Chart on North America - Market size and forecast 2023-2028 ($ million)
- Exhibits58: Data Table on North America - Market size and forecast 2023-2028 ($ million)
- Exhibits59: Chart on North America - Year-over-year growth 2023-2028 (%)
- Exhibits60: Data Table on North America - Year-over-year growth 2023-2028 (%)
- Exhibits61: Chart on Europe - Market size and forecast 2023-2028 ($ million)
- Exhibits62: Data Table on Europe - Market size and forecast 2023-2028 ($ million)
- Exhibits63: Chart on Europe - Year-over-year growth 2023-2028 (%)
- Exhibits64: Data Table on Europe - Year-over-year growth 2023-2028 (%)
- Exhibits65: Chart on Asia - Market size and forecast 2023-2028 ($ million)
- Exhibits66: Data Table on Asia - Market size and forecast 2023-2028 ($ million)
- Exhibits67: Chart on Asia - Year-over-year growth 2023-2028 (%)
- Exhibits68: Data Table on Asia - Year-over-year growth 2023-2028 (%)
- Exhibits69: Chart on Rest of World (ROW) - Market size and forecast 2023-2028 ($ million)
- Exhibits70: Data Table on Rest of World (ROW) - Market size and forecast 2023-2028 ($ million)
- Exhibits71: Chart on Rest of World (ROW) - Year-over-year growth 2023-2028 (%)
- Exhibits72: Data Table on Rest of World (ROW) - Year-over-year growth 2023-2028 (%)
- Exhibits73: Chart on US - Market size and forecast 2023-2028 ($ million)
- Exhibits74: Data Table on US - Market size and forecast 2023-2028 ($ million)
- Exhibits75: Chart on US - Year-over-year growth 2023-2028 (%)
- Exhibits76: Data Table on US - Year-over-year growth 2023-2028 (%)
- Exhibits77: Chart on Germany - Market size and forecast 2023-2028 ($ million)
- Exhibits78: Data Table on Germany - Market size and forecast 2023-2028 ($ million)
- Exhibits79: Chart on Germany - Year-over-year growth 2023-2028 (%)
- Exhibits80: Data Table on Germany - Year-over-year growth 2023-2028 (%)
- Exhibits81: Chart on UK - Market size and forecast 2023-2028 ($ million)
- Exhibits82: Data Table on UK - Market size and forecast 2023-2028 ($ million)
- Exhibits83: Chart on UK - Year-over-year growth 2023-2028 (%)
- Exhibits84: Data Table on UK - Year-over-year growth 2023-2028 (%)
- Exhibits85: Chart on Canada - Market size and forecast 2023-2028 ($ million)
- Exhibits86: Data Table on Canada - Market size and forecast 2023-2028 ($ million)
- Exhibits87: Chart on Canada - Year-over-year growth 2023-2028 (%)
- Exhibits88: Data Table on Canada - Year-over-year growth 2023-2028 (%)
- Exhibits89: Chart on China - Market size and forecast 2023-2028 ($ million)
- Exhibits90: Data Table on China - Market size and forecast 2023-2028 ($ million)
- Exhibits91: Chart on China - Year-over-year growth 2023-2028 (%)
- Exhibits92: Data Table on China - Year-over-year growth 2023-2028 (%)
- Exhibits93: Chart on France - Market size and forecast 2023-2028 ($ million)
- Exhibits94: Data Table on France - Market size and forecast 2023-2028 ($ million)
- Exhibits95: Chart on France - Year-over-year growth 2023-2028 (%)
- Exhibits96: Data Table on France - Year-over-year growth 2023-2028 (%)
- Exhibits97: Chart on Japan - Market size and forecast 2023-2028 ($ million)
- Exhibits98: Data Table on Japan - Market size and forecast 2023-2028 ($ million)
- Exhibits99: Chart on Japan - Year-over-year growth 2023-2028 (%)
- Exhibits100: Data Table on Japan - Year-over-year growth 2023-2028 (%)
- Exhibits101: Chart on Italy - Market size and forecast 2023-2028 ($ million)
- Exhibits102: Data Table on Italy - Market size and forecast 2023-2028 ($ million)
- Exhibits103: Chart on Italy - Year-over-year growth 2023-2028 (%)
- Exhibits104: Data Table on Italy - Year-over-year growth 2023-2028 (%)
- Exhibits105: Chart on India - Market size and forecast 2023-2028 ($ million)
- Exhibits106: Data Table on India - Market size and forecast 2023-2028 ($ million)
- Exhibits107: Chart on India - Year-over-year growth 2023-2028 (%)
- Exhibits108: Data Table on India - Year-over-year growth 2023-2028 (%)
- Exhibits109: Chart on Spain - Market size and forecast 2023-2028 ($ million)
- Exhibits110: Data Table on Spain - Market size and forecast 2023-2028 ($ million)
- Exhibits111: Chart on Spain - Year-over-year growth 2023-2028 (%)
- Exhibits112: Data Table on Spain - Year-over-year growth 2023-2028 (%)
- Exhibits113: Market opportunity By Geographical Landscape ($ million)
- Exhibits114: Data Tables on Market opportunity By Geographical Landscape ($ million)
- Exhibits115: Impact of drivers and challenges in 2023 and 2028
- Exhibits116: Overview on criticality of inputs and factors of differentiation
- Exhibits117: Overview on factors of disruption
- Exhibits118: Impact of key risks on business
- Exhibits119: Companies covered
- Exhibits120: Company ranking index
- Exhibits121: Matrix on companies position and classification
- Exhibits122: A.M.I. GmbH - Overview
- Exhibits123: A.M.I. GmbH - Product / Service
- Exhibits124: A.M.I. GmbH - Key offerings
- Exhibits125: SWOT
- Exhibits126: Becton Dickinson and Co. - Overview
- Exhibits127: Becton Dickinson and Co. - Business segments
- Exhibits128: Becton Dickinson and Co. - Key news
- Exhibits129: Becton Dickinson and Co. - Key offerings
- Exhibits130: Becton Dickinson and Co. - Segment focus
- Exhibits131: SWOT
- Exhibits132: Caldera Medical Inc. - Overview
- Exhibits133: Caldera Medical Inc. - Product / Service
- Exhibits134: Caldera Medical Inc. - Key offerings
- Exhibits135: SWOT
- Exhibits136: Coloplast AS - Overview
- Exhibits137: Coloplast AS - Business segments
- Exhibits138: Coloplast AS - Key news
- Exhibits139: Coloplast AS - Key offerings
- Exhibits140: Coloplast AS - Segment focus
- Exhibits141: SWOT
- Exhibits142: Control Flo Medical LLC - Overview
- Exhibits143: Control Flo Medical LLC - Product / Service
- Exhibits144: Control Flo Medical LLC - Key offerings
- Exhibits145: SWOT
- Exhibits146: ConvaTec Group Plc - Overview
- Exhibits147: ConvaTec Group Plc - Product / Service
- Exhibits148: ConvaTec Group Plc - Key offerings
- Exhibits149: SWOT
- Exhibits150: Hollister Inc. - Overview
- Exhibits151: Hollister Inc. - Product / Service
- Exhibits152: Hollister Inc. - Key offerings
- Exhibits153: SWOT
- Exhibits154: Johnson and Johnson Inc. - Overview
- Exhibits155: Johnson and Johnson Inc. - Business segments
- Exhibits156: Johnson and Johnson Inc. - Key news
- Exhibits157: Johnson and Johnson Inc. - Key offerings
- Exhibits158: Johnson and Johnson Inc. - Segment focus
- Exhibits159: SWOT
- Exhibits160: Medtronic Plc - Overview
- Exhibits161: Medtronic Plc - Business segments
- Exhibits162: Medtronic Plc - Key news
- Exhibits163: Medtronic Plc - Key offerings
- Exhibits164: Medtronic Plc - Segment focus
- Exhibits165: SWOT
- Exhibits166: Teleflex Inc. - Overview
- Exhibits167: Teleflex Inc. - Business segments
- Exhibits168: Teleflex Inc. - Key news
- Exhibits169: Teleflex Inc. - Key offerings
- Exhibits170: Teleflex Inc. - Segment focus
- Exhibits171: SWOT
- Exhibits172: Inclusions checklist
- Exhibits173: Exclusions checklist
- Exhibits174: Currency conversion rates for US$
- Exhibits175: Research methodology
- Exhibits176: Information sources
- Exhibits177: Data validation
- Exhibits178: Validation techniques employed for market sizing
- Exhibits179: Data synthesis
- Exhibits180: 360 degree market analysis
- Exhibits181: List of abbreviations
Urinary Incontinence Devices Market 2024-2028
The urinary incontinence devices market is forecasted to grow by USD 1725.3 mn during 2023-2028, accelerating at a CAGR of 10.4% during the forecast period. The report on the urinary incontinence devices market provides a holistic analysis, market size and forecast, trends, growth drivers, and challenges, as well as vendor analysis covering around 25 vendors.
The report offers an up-to-date analysis regarding the current market scenario, the latest trends and drivers, and the overall market environment. The market is driven by growing prevalence of physical and medical conditions leading to urinary incontinence, expansion of cost-effective products through new launches, and expansion of business through strategic partnerships.
| Market Scope | |
|---|---|
| Base Year | 2024 |
| End Year | 2028 |
| Series Year | 2024-2028 |
| Growth Momentum | Accelerate |
| YOY 2024 | 9.1% |
| CAGR | 10.4% |
| Incremental Value | $1725.3 mn |
Technavio's urinary incontinence devices market is segmented as below:
By Product
- Urinary slings
- Neuromodulation devices
- Urinary catheters
By Geographical Landscape
- North America
- Europe
- Asia
- Rest of World (ROW)
This study identifies the focus on providing specialized urology care as one of the prime reasons driving the urinary incontinence devices market growth during the next few years. Also, technological advances in products and adoption of robotic surgery for urinary incontinence and reinvigorating marketing campaigns for urinary incontinence devices and growing online sales will lead to sizable demand in the market.
The report on the urinary incontinence devices market covers the following areas:
- Urinary Incontinence Devices Market sizing
- Urinary Incontinence Devices Market forecast
- Urinary Incontinence Devices Market industry analysis
The robust vendor analysis is designed to help clients improve their market position, and in line with this, this report provides a detailed analysis of several leading urinary incontinence devices market vendors that include A.M.I. GmbH, B.Braun SE, Becton Dickinson and Co., BioDerm Inc., Boston Scientific Corp., Caldera Medical Inc., Coloplast AS, Control Flo Medical LLC, ConvaTec Group Plc, Cook Group Inc., Hollister Inc., Johnson and Johnson Inc., KARL STORZ SE and Co. KG, Laborie, Medtronic Plc, Multigate Medical Products Pty Ltd., Teleflex Inc., UroDev Medical, and Zephyr Surgical Implants. Also, the urinary incontinence devices market analysis report includes information on upcoming trends and challenges that will influence market growth. This is to help companies strategize and leverage all forthcoming growth opportunities.
The study was conducted using an objective combination of primary and secondary information including inputs from key participants in the industry. The report contains a comprehensive market and vendor landscape in addition to an analysis of the key vendors.
The publisher presents a detailed picture of the market by the way of study, synthesis, and summation of data from multiple sources by an analysis of key parameters such as profit, pricing, competition, and promotions. It presents various market facets by identifying the key industry influencers. The data presented is comprehensive, reliable, and a result of extensive primary and secondary research. The market research reports provide a complete competitive landscape and an in-depth vendor selection methodology and analysis using qualitative and quantitative research to forecast accurate market growth.
Table of Contents
1 Executive Summary
- 1.1 Market overview
- Executive Summary - Chart on Market Overview
- Executive Summary - Data Table on Market Overview
- Executive Summary - Chart on Global Market Characteristics
- Executive Summary - Chart on Market By Geographical Landscape
- Executive Summary - Chart on Market Segmentation by Product
- Executive Summary - Chart on Incremental Growth
- Executive Summary - Data Table on Incremental Growth
- Executive Summary - Chart on Company Market Positioning
2 Technavio Analysis
- 2.1 Analysis of price sensitivity, lifecycle, customer purchase basket, adoption rates, and purchase criteria
- Analysis of price sensitivity, lifecycle, customer purchase basket, adoption rates, and purchase criteria
- 2.2 Criticality of inputs and Factors of differentiation
- Overview on criticality of inputs and factors of differentiation
- 2.3 Factors of disruption
- Overview on factors of disruption
- 2.4 Impact of drivers and challenges
- Impact of drivers and challenges in 2023 and 2028
3 Market Landscape
- 3.1 Market ecosystem
- Parent Market
- Data Table on - Parent Market
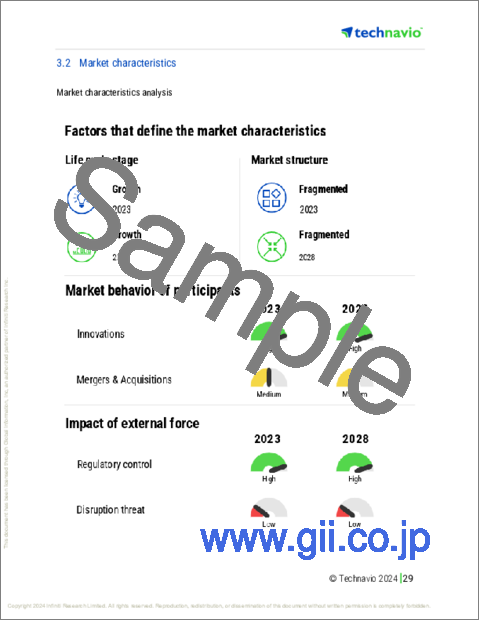
- 3.2 Market characteristics
- Market characteristics analysis
- 3.3 Value chain analysis
- Value Chain Analysis
4 Market Sizing
- 4.1 Market definition
- Offerings of companies included in the market definition
- 4.2 Market segment analysis
- Market segments
- 4.3 Market size 2023
- 4.4 Market outlook: Forecast for 2023-2028
- Chart on Global - Market size and forecast 2023-2028 ($ million)
- Data Table on Global - Market size and forecast 2023-2028 ($ million)
- Chart on Global Market: Year-over-year growth 2023-2028 (%)
- Data Table on Global Market: Year-over-year growth 2023-2028 (%)
5 Historic Market Size
- 5.1 Global Urinary Incontinence Devices Market 2018 - 2022
- Historic Market Size - Data Table on Global Urinary Incontinence Devices Market 2018 - 2022 ($ million)
- 5.2 Product segment analysis 2018 - 2022
- Historic Market Size - Product Segment 2018 - 2022 ($ million)
- 5.3 Geography segment analysis 2018 - 2022
- Historic Market Size - Geography Segment 2018 - 2022 ($ million)
- 5.4 Country segment analysis 2018 - 2022
- Historic Market Size - Country Segment 2018 - 2022 ($ million)
6 Qualitative Analysis
- 6.1 The AI impact on Global Urinary Incontinence Devices Market
7 Five Forces Analysis
- 7.1 Five forces summary
- Five forces analysis - Comparison between 2023 and 2028
- 7.2 Bargaining power of buyers
- Bargaining power of buyers - Impact of key factors 2023 and 2028
- 7.3 Bargaining power of suppliers
- Bargaining power of suppliers - Impact of key factors in 2023 and 2028
- 7.4 Threat of new entrants
- Threat of new entrants - Impact of key factors in 2023 and 2028
- 7.5 Threat of substitutes
- Threat of substitutes - Impact of key factors in 2023 and 2028
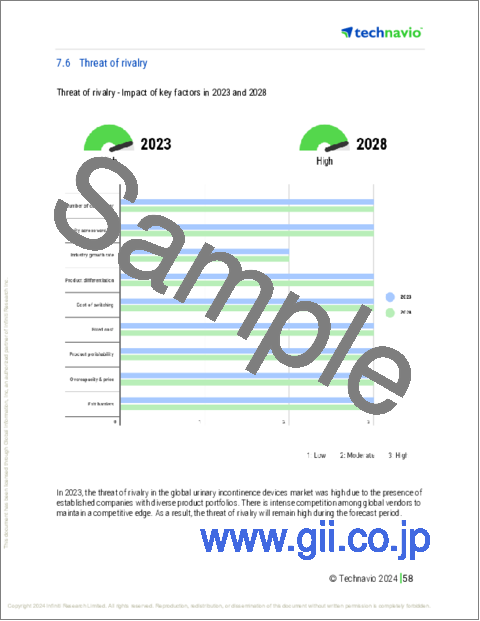
- 7.6 Threat of rivalry
- Threat of rivalry - Impact of key factors in 2023 and 2028
- 7.7 Market condition
- Chart on Market condition - Five forces 2023 and 2028
8 Market Segmentation by Product
- 8.1 Market segments
- Chart on Product - Market share 2023-2028 (%)
- Data Table on Product - Market share 2023-2028 (%)
- 8.2 Comparison by Product
- Chart on Comparison by Product
- Data Table on Comparison by Product
- 8.3 Urinary slings - Market size and forecast 2023-2028
- Chart on Urinary slings - Market size and forecast 2023-2028 ($ million)
- Data Table on Urinary slings - Market size and forecast 2023-2028 ($ million)
- Chart on Urinary slings - Year-over-year growth 2023-2028 (%)
- Data Table on Urinary slings - Year-over-year growth 2023-2028 (%)
- 8.4 Neuromodulation devices - Market size and forecast 2023-2028
- Chart on Neuromodulation devices - Market size and forecast 2023-2028 ($ million)
- Data Table on Neuromodulation devices - Market size and forecast 2023-2028 ($ million)
- Chart on Neuromodulation devices - Year-over-year growth 2023-2028 (%)
- Data Table on Neuromodulation devices - Year-over-year growth 2023-2028 (%)
- 8.5 Urinary catheters - Market size and forecast 2023-2028
- Chart on Urinary catheters - Market size and forecast 2023-2028 ($ million)
- Data Table on Urinary catheters - Market size and forecast 2023-2028 ($ million)
- Chart on Urinary catheters - Year-over-year growth 2023-2028 (%)
- Data Table on Urinary catheters - Year-over-year growth 2023-2028 (%)
- 8.6 Market opportunity by Product
- Market opportunity by Product ($ million)
- Data Table on Market opportunity by Product ($ million)
9 Customer Landscape
- 9.1 Customer landscape overview
- Analysis of price sensitivity, lifecycle, customer purchase basket, adoption rates, and purchase criteria
10 Geographic Landscape
- 10.1 Geographic segmentation
- Chart on Market share By Geographical Landscape 2023-2028 (%)
- Data Table on Market share By Geographical Landscape 2023-2028 (%)
- 10.2 Geographic comparison
- Chart on Geographic comparison
- Data Table on Geographic comparison
- 10.3 North America - Market size and forecast 2023-2028
- Chart on North America - Market size and forecast 2023-2028 ($ million)
- Data Table on North America - Market size and forecast 2023-2028 ($ million)
- Chart on North America - Year-over-year growth 2023-2028 (%)
- Data Table on North America - Year-over-year growth 2023-2028 (%)
- 10.4 Europe - Market size and forecast 2023-2028
- Chart on Europe - Market size and forecast 2023-2028 ($ million)
- Data Table on Europe - Market size and forecast 2023-2028 ($ million)
- Chart on Europe - Year-over-year growth 2023-2028 (%)
- Data Table on Europe - Year-over-year growth 2023-2028 (%)
- 10.5 Asia - Market size and forecast 2023-2028
- Chart on Asia - Market size and forecast 2023-2028 ($ million)
- Data Table on Asia - Market size and forecast 2023-2028 ($ million)
- Chart on Asia - Year-over-year growth 2023-2028 (%)
- Data Table on Asia - Year-over-year growth 2023-2028 (%)
- 10.6 Rest of World (ROW) - Market size and forecast 2023-2028
- Chart on Rest of World (ROW) - Market size and forecast 2023-2028 ($ million)
- Data Table on Rest of World (ROW) - Market size and forecast 2023-2028 ($ million)
- Chart on Rest of World (ROW) - Year-over-year growth 2023-2028 (%)
- Data Table on Rest of World (ROW) - Year-over-year growth 2023-2028 (%)
- 10.7 US - Market size and forecast 2023-2028
- Chart on US - Market size and forecast 2023-2028 ($ million)
- Data Table on US - Market size and forecast 2023-2028 ($ million)
- Chart on US - Year-over-year growth 2023-2028 (%)
- Data Table on US - Year-over-year growth 2023-2028 (%)
- 10.8 Germany - Market size and forecast 2023-2028
- Chart on Germany - Market size and forecast 2023-2028 ($ million)
- Data Table on Germany - Market size and forecast 2023-2028 ($ million)
- Chart on Germany - Year-over-year growth 2023-2028 (%)
- Data Table on Germany - Year-over-year growth 2023-2028 (%)
- 10.9 UK - Market size and forecast 2023-2028
- Chart on UK - Market size and forecast 2023-2028 ($ million)
- Data Table on UK - Market size and forecast 2023-2028 ($ million)
- Chart on UK - Year-over-year growth 2023-2028 (%)
- Data Table on UK - Year-over-year growth 2023-2028 (%)
- 10.10 Canada - Market size and forecast 2023-2028
- Chart on Canada - Market size and forecast 2023-2028 ($ million)
- Data Table on Canada - Market size and forecast 2023-2028 ($ million)
- Chart on Canada - Year-over-year growth 2023-2028 (%)
- Data Table on Canada - Year-over-year growth 2023-2028 (%)
- 10.11 China - Market size and forecast 2023-2028
- Chart on China - Market size and forecast 2023-2028 ($ million)
- Data Table on China - Market size and forecast 2023-2028 ($ million)
- Chart on China - Year-over-year growth 2023-2028 (%)
- Data Table on China - Year-over-year growth 2023-2028 (%)
- 10.12 France - Market size and forecast 2023-2028
- Chart on France - Market size and forecast 2023-2028 ($ million)
- Data Table on France - Market size and forecast 2023-2028 ($ million)
- Chart on France - Year-over-year growth 2023-2028 (%)
- Data Table on France - Year-over-year growth 2023-2028 (%)
- 10.13 Japan - Market size and forecast 2023-2028
- Chart on Japan - Market size and forecast 2023-2028 ($ million)
- Data Table on Japan - Market size and forecast 2023-2028 ($ million)
- Chart on Japan - Year-over-year growth 2023-2028 (%)
- Data Table on Japan - Year-over-year growth 2023-2028 (%)
- 10.14 Italy - Market size and forecast 2023-2028
- Chart on Italy - Market size and forecast 2023-2028 ($ million)
- Data Table on Italy - Market size and forecast 2023-2028 ($ million)
- Chart on Italy - Year-over-year growth 2023-2028 (%)
- Data Table on Italy - Year-over-year growth 2023-2028 (%)
- 10.15 India - Market size and forecast 2023-2028
- Chart on India - Market size and forecast 2023-2028 ($ million)
- Data Table on India - Market size and forecast 2023-2028 ($ million)
- Chart on India - Year-over-year growth 2023-2028 (%)
- Data Table on India - Year-over-year growth 2023-2028 (%)
- 10.16 Spain - Market size and forecast 2023-2028
- Chart on Spain - Market size and forecast 2023-2028 ($ million)
- Data Table on Spain - Market size and forecast 2023-2028 ($ million)
- Chart on Spain - Year-over-year growth 2023-2028 (%)
- Data Table on Spain - Year-over-year growth 2023-2028 (%)
- 10.17 Market opportunity By Geographical Landscape
- Market opportunity By Geographical Landscape ($ million)
- Data Tables on Market opportunity By Geographical Landscape ($ million)
11 Drivers, Challenges, and Opportunity/Restraints
- 11.1 Market drivers
- 11.2 Market challenges
- 11.3 Impact of drivers and challenges
- Impact of drivers and challenges in 2023 and 2028
- 11.4 Market opportunities/restraints
12 Competitive Landscape
- 12.1 Overview
- 12.2 Competitive Landscape
- Overview on criticality of inputs and factors of differentiation
- 12.3 Landscape disruption
- Overview on factors of disruption
- 12.4 Industry risks
- Impact of key risks on business
13 Competitive Analysis
- 13.1 Companies profiled
- Companies covered
- 13.2 Company ranking index
- Company ranking index
- 13.3 Market positioning of companies
- Matrix on companies position and classification
- 13.4 A.M.I. GmbH
- A.M.I. GmbH - Overview
- A.M.I. GmbH - Product / Service
- A.M.I. GmbH - Key offerings
- SWOT
- 13.5 Becton Dickinson and Co.
- Becton Dickinson and Co. - Overview
- Becton Dickinson and Co. - Business segments
- Becton Dickinson and Co. - Key news
- Becton Dickinson and Co. - Key offerings
- Becton Dickinson and Co. - Segment focus
- SWOT
- 13.6 Caldera Medical Inc.
- Caldera Medical Inc. - Overview
- Caldera Medical Inc. - Product / Service
- Caldera Medical Inc. - Key offerings
- SWOT
- 13.7 Coloplast AS
- Coloplast AS - Overview
- Coloplast AS - Business segments
- Coloplast AS - Key news
- Coloplast AS - Key offerings
- Coloplast AS - Segment focus
- SWOT
- 13.8 Control Flo Medical LLC
- Control Flo Medical LLC - Overview
- Control Flo Medical LLC - Product / Service
- Control Flo Medical LLC - Key offerings
- SWOT
- 13.9 ConvaTec Group Plc
- ConvaTec Group Plc - Overview
- ConvaTec Group Plc - Product / Service
- ConvaTec Group Plc - Key offerings
- SWOT
- 13.10 Hollister Inc.
- Hollister Inc. - Overview
- Hollister Inc. - Product / Service
- Hollister Inc. - Key offerings
- SWOT
- 13.11 Johnson and Johnson Inc.
- Johnson and Johnson Inc. - Overview
- Johnson and Johnson Inc. - Business segments
- Johnson and Johnson Inc. - Key news
- Johnson and Johnson Inc. - Key offerings
- Johnson and Johnson Inc. - Segment focus
- SWOT
- 13.12 Medtronic Plc
- Medtronic Plc - Overview
- Medtronic Plc - Business segments
- Medtronic Plc - Key news
- Medtronic Plc - Key offerings
- Medtronic Plc - Segment focus
- SWOT
- 13.13 Teleflex Inc.
- Teleflex Inc. - Overview
- Teleflex Inc. - Business segments
- Teleflex Inc. - Key news
- Teleflex Inc. - Key offerings
- Teleflex Inc. - Segment focus
- SWOT
14 Appendix
- 14.1 Scope of the report
- 14.2 Inclusions and exclusions checklist
- Inclusions checklist
- Exclusions checklist
- 14.3 Currency conversion rates for US$
- Currency conversion rates for US$
- 14.4 Research methodology
- Research methodology
- 14.5 Data procurement
- Information sources
- 14.6 Data validation
- Data validation
- 14.7 Validation techniques employed for market sizing
- Validation techniques employed for market sizing
- 14.8 Data synthesis
- Data synthesis
- 14.9 360 degree market analysis
- 360 degree market analysis
- 14.10 List of abbreviations
- List of abbreviations

