|
|
市場調査レポート
商品コード
1584045
医療シミュレーションの世界市場、2024~2028年Global Medical Simulation Market 2024-2028 |
||||||

|
|||||||
カスタマイズ可能
|
|||||||

| 医療シミュレーションの世界市場、2024~2028年 |
|
出版日: 2024年08月19日
発行: TechNavio
ページ情報: 英文 159 Pages
納期: 即納可能
|

全表示
- 概要
- 図表
- 目次
医療シミュレーション市場は2023~2028年に26億2,730万米ドル、予測期間中のCAGRは17.17%で成長すると予測されます。
当レポートでは、医療シミュレーション市場の全体的な分析、市場規模・予測、動向、成長促進要因、課題、約25のベンダーを網羅したベンダー分析などを掲載しています。
現在の市場シナリオ、最新動向と促進要因、市場環境全体に関する最新分析を提供しています。市場は、患者の安全性への関心の高まり、個別化またはカスタマイズ型医療シミュレーションへの需要の高まり、医療シミュレーションのコスト効率の上昇と生産性の向上が牽引しています。
| 市場範囲 | |
|---|---|
| 基準年 | 2024年 |
| 終了年 | 2028年 |
| 予測期間 | 2024~2028年 |
| 成長モメンタム | 加速 |
| 前年比[2024年] | 14.88% |
| CAGR | 17.17% |
| 増分額 | 26億2,730万米ドル |
本調査では、今後数年間における医療シミュレーション市場の成長を促進する主要要因の1つとして、AI技術の医療シミュレーションへの統合が進んでいることを挙げています。また、研究開発活動の増加や新興経済諸国におけるシミュレーショントレーニングに対する意識の高まりも、市場の大きな需要につながります。
目次
第1章 エグゼクティブサマリー
- 市場概要
第2章 市場情勢
- 市場エコシステム
- 市場の特徴
- バリューチェーン分析
第3章 市場規模の評価
- 市場の定義
- 市場セグメント分析
- 市場規模 2023年
- 市場の展望 2023~2028年
第4章 市場規模実績
- 医療シミュレーションの世界市場 2018~2022年
- エンドユーザー別セグメント分析 2018~2022年
- ソリューション別セグメント分析 2018~2022年
- 地域別セグメント分析 2018~2022年
- 国別セグメント分析 2018~2022年
第5章 ファイブフォース分析
- ファイブフォースの要約
- 買い手の交渉力
- 供給企業の交渉力
- 新規参入業者の脅威
- 代替品の脅威
- 競争の脅威
- 市況
第6章 エンドユーザー別市場セグメンテーション
- 市場セグメンテーション
- 比較:エンドユーザー別
- 学術機関:市場規模と予測 2023~2028年
- 軍事機関:市場規模と予測 2023~2028年
- 病院:市場規模と予測 2023~2028年
- その他:市場規模と予測 2023~2028年
- エンドユーザー別の市場機会
第7章 ソリューション別市場セグメンテーション
- 市場セグメンテーション
- 比較:ソリューション別
- 医療解剖モデル:市場規模と予測 2023~2028年
- ウェブベースシミュレーター:市場規模と予測 2023~2028年
- シミュレーショントレーニングサービス:市場規模と予測 2023~2028年
- 医療シミュレーションソフトウェア:市場規模と予測 2023~2028年
- ソリューション別の市場機会
第8章 顧客情勢
- 顧客情勢概要
第9章 地域別情勢
- 地域別セグメンテーション
- 比較:地域別
- 北米:市場規模と予測 2023~2028年
- 欧州:市場規模と予測 2023~2028年
- アジア:市場規模と予測 2023~2028年
- その他:市場規模と予測 2023~2028年
- 米国:市場規模と予測 2023~2028年
- 英国:市場規模と予測 2023~2028年
- カナダ:市場規模と予測 2023~2028年
- 中国:市場規模と予測 2023~2028年
- ドイツ:市場規模と予測 2023~2028年
- 地域情勢別の市場機会
第10章 促進要因・課題・機会・抑制要因
- 市場促進要因
- 市場課題
- 促進要因と課題の影響
- 市場機会・抑制要因
第11章 競合情勢
- 概要
- 競合情勢
- 混乱の状況
- 業界のリスク
第12章 競合分析
- 企業プロファイル
- 企業の市場ポジショニング
- Altay Scientific
- CAE Inc.
- Cardionics Inc.
- Gaumard Scientific Co. Inc.
- IngMar Medical
- Intelligent Ultrasound Group
- Kyoto Kagaku Co. Ltd.
- Laerdal Medical AS
- Limbs and Things Ltd.
- Medical-X
- Mentice AB
- Operative Experience Inc.
- Simulab Corp.
- Trucorp Ltd.
- VirtaMed AG
第13章 付録
Exhibits:
- Exhibits1: Executive Summary - Chart on Market Overview
- Exhibits2: Executive Summary - Data Table on Market Overview
- Exhibits3: Executive Summary - Chart on Global Market Characteristics
- Exhibits4: Executive Summary - Chart on Market By Geographical Landscape
- Exhibits5: Executive Summary - Chart on Market Segmentation by End-user
- Exhibits6: Executive Summary - Chart on Market Segmentation by Solution
- Exhibits7: Executive Summary - Chart on Incremental Growth
- Exhibits8: Executive Summary - Data Table on Incremental Growth
- Exhibits9: Executive Summary - Chart on Company Market Positioning
- Exhibits10: Parent Market
- Exhibits11: Data Table on - Parent Market
- Exhibits12: Market characteristics analysis
- Exhibits13: Value Chain Analysis
- Exhibits14: Offerings of companies included in the market definition
- Exhibits15: Market segments
- Exhibits16: Chart on Global - Market size and forecast 2023-2028 ($ million)
- Exhibits17: Data Table on Global - Market size and forecast 2023-2028 ($ million)
- Exhibits18: Chart on Global Market: Year-over-year growth 2023-2028 (%)
- Exhibits19: Data Table on Global Market: Year-over-year growth 2023-2028 (%)
- Exhibits20: Historic Market Size - Data Table on Global Medical Simulation Market 2018 - 2022 ($ million)
- Exhibits21: Historic Market Size - End-user Segment 2018 - 2022 ($ million)
- Exhibits22: Historic Market Size - Solution Segment 2018 - 2022 ($ million)
- Exhibits23: Historic Market Size - Geography Segment 2018 - 2022 ($ million)
- Exhibits24: Historic Market Size - Country Segment 2018 - 2022 ($ million)
- Exhibits25: Five forces analysis - Comparison between 2023 and 2028
- Exhibits26: Bargaining power of buyers - Impact of key factors 2023 and 2028
- Exhibits27: Bargaining power of suppliers - Impact of key factors in 2023 and 2028
- Exhibits28: Threat of new entrants - Impact of key factors in 2023 and 2028
- Exhibits29: Threat of substitutes - Impact of key factors in 2023 and 2028
- Exhibits30: Threat of rivalry - Impact of key factors in 2023 and 2028
- Exhibits31: Chart on Market condition - Five forces 2023 and 2028
- Exhibits32: Chart on End-user - Market share 2023-2028 (%)
- Exhibits33: Data Table on End-user - Market share 2023-2028 (%)
- Exhibits34: Chart on Comparison by End-user
- Exhibits35: Data Table on Comparison by End-user
- Exhibits36: Chart on Academic institutes - Market size and forecast 2023-2028 ($ million)
- Exhibits37: Data Table on Academic institutes - Market size and forecast 2023-2028 ($ million)
- Exhibits38: Chart on Academic institutes - Year-over-year growth 2023-2028 (%)
- Exhibits39: Data Table on Academic institutes - Year-over-year growth 2023-2028 (%)
- Exhibits40: Chart on Military organizations - Market size and forecast 2023-2028 ($ million)
- Exhibits41: Data Table on Military organizations - Market size and forecast 2023-2028 ($ million)
- Exhibits42: Chart on Military organizations - Year-over-year growth 2023-2028 (%)
- Exhibits43: Data Table on Military organizations - Year-over-year growth 2023-2028 (%)
- Exhibits44: Chart on Hospitals - Market size and forecast 2023-2028 ($ million)
- Exhibits45: Data Table on Hospitals - Market size and forecast 2023-2028 ($ million)
- Exhibits46: Chart on Hospitals - Year-over-year growth 2023-2028 (%)
- Exhibits47: Data Table on Hospitals - Year-over-year growth 2023-2028 (%)
- Exhibits48: Chart on Others - Market size and forecast 2023-2028 ($ million)
- Exhibits49: Data Table on Others - Market size and forecast 2023-2028 ($ million)
- Exhibits50: Chart on Others - Year-over-year growth 2023-2028 (%)
- Exhibits51: Data Table on Others - Year-over-year growth 2023-2028 (%)
- Exhibits52: Market opportunity by End-user ($ million)
- Exhibits53: Data Table on Market opportunity by End-user ($ million)
- Exhibits54: Chart on Solution - Market share 2023-2028 (%)
- Exhibits55: Data Table on Solution - Market share 2023-2028 (%)
- Exhibits56: Chart on Comparison by Solution
- Exhibits57: Data Table on Comparison by Solution
- Exhibits58: Chart on Healthcare anatomical models - Market size and forecast 2023-2028 ($ million)
- Exhibits59: Data Table on Healthcare anatomical models - Market size and forecast 2023-2028 ($ million)
- Exhibits60: Chart on Healthcare anatomical models - Year-over-year growth 2023-2028 (%)
- Exhibits61: Data Table on Healthcare anatomical models - Year-over-year growth 2023-2028 (%)
- Exhibits62: Chart on Web-based simulators - Market size and forecast 2023-2028 ($ million)
- Exhibits63: Data Table on Web-based simulators - Market size and forecast 2023-2028 ($ million)
- Exhibits64: Chart on Web-based simulators - Year-over-year growth 2023-2028 (%)
- Exhibits65: Data Table on Web-based simulators - Year-over-year growth 2023-2028 (%)
- Exhibits66: Chart on Simulation training services - Market size and forecast 2023-2028 ($ million)
- Exhibits67: Data Table on Simulation training services - Market size and forecast 2023-2028 ($ million)
- Exhibits68: Chart on Simulation training services - Year-over-year growth 2023-2028 (%)
- Exhibits69: Data Table on Simulation training services - Year-over-year growth 2023-2028 (%)
- Exhibits70: Chart on Healthcare simulation software - Market size and forecast 2023-2028 ($ million)
- Exhibits71: Data Table on Healthcare simulation software - Market size and forecast 2023-2028 ($ million)
- Exhibits72: Chart on Healthcare simulation software - Year-over-year growth 2023-2028 (%)
- Exhibits73: Data Table on Healthcare simulation software - Year-over-year growth 2023-2028 (%)
- Exhibits74: Market opportunity by Solution ($ million)
- Exhibits75: Data Table on Market opportunity by Solution ($ million)
- Exhibits76: Analysis of price sensitivity, lifecycle, customer purchase basket, adoption rates, and purchase criteria
- Exhibits77: Chart on Market share By Geographical Landscape 2023-2028 (%)
- Exhibits78: Data Table on Market share By Geographical Landscape 2023-2028 (%)
- Exhibits79: Chart on Geographic comparison
- Exhibits80: Data Table on Geographic comparison
- Exhibits81: Chart on North America - Market size and forecast 2023-2028 ($ million)
- Exhibits82: Data Table on North America - Market size and forecast 2023-2028 ($ million)
- Exhibits83: Chart on North America - Year-over-year growth 2023-2028 (%)
- Exhibits84: Data Table on North America - Year-over-year growth 2023-2028 (%)
- Exhibits85: Chart on Europe - Market size and forecast 2023-2028 ($ million)
- Exhibits86: Data Table on Europe - Market size and forecast 2023-2028 ($ million)
- Exhibits87: Chart on Europe - Year-over-year growth 2023-2028 (%)
- Exhibits88: Data Table on Europe - Year-over-year growth 2023-2028 (%)
- Exhibits89: Chart on Asia - Market size and forecast 2023-2028 ($ million)
- Exhibits90: Data Table on Asia - Market size and forecast 2023-2028 ($ million)
- Exhibits91: Chart on Asia - Year-over-year growth 2023-2028 (%)
- Exhibits92: Data Table on Asia - Year-over-year growth 2023-2028 (%)
- Exhibits93: Chart on Rest of World (ROW) - Market size and forecast 2023-2028 ($ million)
- Exhibits94: Data Table on Rest of World (ROW) - Market size and forecast 2023-2028 ($ million)
- Exhibits95: Chart on Rest of World (ROW) - Year-over-year growth 2023-2028 (%)
- Exhibits96: Data Table on Rest of World (ROW) - Year-over-year growth 2023-2028 (%)
- Exhibits97: Chart on US - Market size and forecast 2023-2028 ($ million)
- Exhibits98: Data Table on US - Market size and forecast 2023-2028 ($ million)
- Exhibits99: Chart on US - Year-over-year growth 2023-2028 (%)
- Exhibits100: Data Table on US - Year-over-year growth 2023-2028 (%)
- Exhibits101: Chart on UK - Market size and forecast 2023-2028 ($ million)
- Exhibits102: Data Table on UK - Market size and forecast 2023-2028 ($ million)
- Exhibits103: Chart on UK - Year-over-year growth 2023-2028 (%)
- Exhibits104: Data Table on UK - Year-over-year growth 2023-2028 (%)
- Exhibits105: Chart on Canada - Market size and forecast 2023-2028 ($ million)
- Exhibits106: Data Table on Canada - Market size and forecast 2023-2028 ($ million)
- Exhibits107: Chart on Canada - Year-over-year growth 2023-2028 (%)
- Exhibits108: Data Table on Canada - Year-over-year growth 2023-2028 (%)
- Exhibits109: Chart on China - Market size and forecast 2023-2028 ($ million)
- Exhibits110: Data Table on China - Market size and forecast 2023-2028 ($ million)
- Exhibits111: Chart on China - Year-over-year growth 2023-2028 (%)
- Exhibits112: Data Table on China - Year-over-year growth 2023-2028 (%)
- Exhibits113: Chart on Germany - Market size and forecast 2023-2028 ($ million)
- Exhibits114: Data Table on Germany - Market size and forecast 2023-2028 ($ million)
- Exhibits115: Chart on Germany - Year-over-year growth 2023-2028 (%)
- Exhibits116: Data Table on Germany - Year-over-year growth 2023-2028 (%)
- Exhibits117: Market opportunity By Geographical Landscape ($ million)
- Exhibits118: Data Tables on Market opportunity By Geographical Landscape ($ million)
- Exhibits119: Impact of drivers and challenges in 2023 and 2028
- Exhibits120: Overview on criticality of inputs and factors of differentiation
- Exhibits121: Overview on factors of disruption
- Exhibits122: Impact of key risks on business
- Exhibits123: Companies covered
- Exhibits124: Matrix on companies position and classification
- Exhibits125: Altay Scientific - Overview
- Exhibits126: Altay Scientific - Product / Service
- Exhibits127: Altay Scientific - Key offerings
- Exhibits128: CAE Inc. - Overview
- Exhibits129: CAE Inc. - Business segments
- Exhibits130: CAE Inc. - Key offerings
- Exhibits131: CAE Inc. - Segment focus
- Exhibits132: Cardionics Inc. - Overview
- Exhibits133: Cardionics Inc. - Product / Service
- Exhibits134: Cardionics Inc. - Key offerings
- Exhibits135: Gaumard Scientific Co. Inc. - Overview
- Exhibits136: Gaumard Scientific Co. Inc. - Product / Service
- Exhibits137: Gaumard Scientific Co. Inc. - Key offerings
- Exhibits138: IngMar Medical - Overview
- Exhibits139: IngMar Medical - Product / Service
- Exhibits140: IngMar Medical - Key offerings
- Exhibits141: Intelligent Ultrasound Group - Overview
- Exhibits142: Intelligent Ultrasound Group - Business segments
- Exhibits143: Intelligent Ultrasound Group - Key offerings
- Exhibits144: Intelligent Ultrasound Group - Segment focus
- Exhibits145: Kyoto Kagaku Co. Ltd. - Overview
- Exhibits146: Kyoto Kagaku Co. Ltd. - Product / Service
- Exhibits147: Kyoto Kagaku Co. Ltd. - Key offerings
- Exhibits148: Laerdal Medical AS - Overview
- Exhibits149: Laerdal Medical AS - Product / Service
- Exhibits150: Laerdal Medical AS - Key offerings
- Exhibits151: Limbs and Things Ltd. - Overview
- Exhibits152: Limbs and Things Ltd. - Product / Service
- Exhibits153: Limbs and Things Ltd. - Key offerings
- Exhibits154: Medical-X - Overview
- Exhibits155: Medical-X - Product / Service
- Exhibits156: Medical-X - Key offerings
- Exhibits157: Mentice AB - Overview
- Exhibits158: Mentice AB - Business segments
- Exhibits159: Mentice AB - Key offerings
- Exhibits160: Mentice AB - Segment focus
- Exhibits161: Operative Experience Inc. - Overview
- Exhibits162: Operative Experience Inc. - Product / Service
- Exhibits163: Operative Experience Inc. - Key offerings
- Exhibits164: Simulab Corp. - Overview
- Exhibits165: Simulab Corp. - Product / Service
- Exhibits166: Simulab Corp. - Key offerings
- Exhibits167: Trucorp Ltd. - Overview
- Exhibits168: Trucorp Ltd. - Product / Service
- Exhibits169: Trucorp Ltd. - Key offerings
- Exhibits170: VirtaMed AG - Overview
- Exhibits171: VirtaMed AG - Product / Service
- Exhibits172: VirtaMed AG - Key offerings
- Exhibits173: Inclusions checklist
- Exhibits174: Exclusions checklist
- Exhibits175: Currency conversion rates for US$
- Exhibits176: Research methodology
- Exhibits177: Information sources
- Exhibits178: Data validation
- Exhibits179: Validation techniques employed for market sizing
- Exhibits180: Data synthesis
- Exhibits181: 360 degree market analysis
- Exhibits182: List of abbreviations
The medical simulation market is forecasted to grow by USD 2627.3 mn during 2023-2028, accelerating at a CAGR of 17.17% during the forecast period. The report on the medical simulation market provides a holistic analysis, market size and forecast, trends, growth drivers, and challenges, as well as vendor analysis covering around 25 vendors.
The report offers an up-to-date analysis regarding the current market scenario, the latest trends and drivers, and the overall market environment. The market is driven by increasing focus on patient safety, increased demand for personalized or customized medical simulation, and rising cost efficiency and enhanced productivity of medical simulation.
Technavio's medical simulation market is segmented as below:
| Market Scope | |
|---|---|
| Base Year | 2024 |
| End Year | 2028 |
| Series Year | 2024-2028 |
| Growth Momentum | Accelerate |
| YOY 2024 | 14.88% |
| CAGR | 17.17% |
| Incremental Value | $2627.3 mn |
By End-user
- Academic institutes
- Military organizations
- Hospitals
- Others
By Solution
- Healthcare anatomical models
- Web-based simulators
- Simulation training services
- Healthcare simulation software
By Geographical Landscape
- North America
- Europe
- Asia
- Rest of World (ROW)
This study identifies the growing integration of ai technologies into medical simulation as one of the prime reasons driving the medical simulation market growth during the next few years. Also, increase in research and development activities and growing awareness about simulation training in emerging economies will lead to sizable demand in the market.
The report on the medical simulation market covers the following areas:
- Medical simulation market sizing
- Medical simulation market forecast
- Medical simulation market industry analysis
The robust vendor analysis is designed to help clients improve their market position, and in line with this, this report provides a detailed analysis of several leading medical simulation market vendors that include Altay Scientific, CAE Inc., Cardionics Inc., Gaumard Scientific Co. Inc., HAAG-STREIT DEUTSCHLAND GmbH, IngMar Medical, Inovus Ltd., Intelligent Ultrasound Group, KaVo Dental GmbH, Kyoto Kagaku Co. Ltd., Laerdal Medical AS, Limbs and Things Ltd., Medical-X, Mentice AB, Operative Experience Inc., Simendo BV, Simulab Corp., Symgery, Trucorp Ltd., and VirtaMed AG. Also, the medical simulation market analysis report includes information on upcoming trends and challenges that will influence market growth. This is to help companies strategize and leverage all forthcoming growth opportunities.
The study was conducted using an objective combination of primary and secondary information including inputs from key participants in the industry. The report contains a comprehensive market and vendor landscape in addition to an analysis of the key vendors.
The publisher presents a detailed picture of the market by the way of study, synthesis, and summation of data from multiple sources by an analysis of key parameters such as profit, pricing, competition, and promotions. It presents various market facets by identifying the key industry influencers. The data presented is comprehensive, reliable, and a result of extensive primary and secondary research. The market research reports provide a complete competitive landscape and an in-depth vendor selection methodology and analysis using qualitative and quantitative research to forecast accurate market growth.
Table of Contents
1 Executive Summary
- 1.1 Market overview
- Executive Summary - Chart on Market Overview
- Executive Summary - Data Table on Market Overview
- Executive Summary - Chart on Global Market Characteristics
- Executive Summary - Chart on Market By Geographical Landscape
- Executive Summary - Chart on Market Segmentation by End-user
- Executive Summary - Chart on Market Segmentation by Solution
- Executive Summary - Chart on Incremental Growth
- Executive Summary - Data Table on Incremental Growth
- Executive Summary - Chart on Company Market Positioning
2 Market Landscape
- 2.1 Market ecosystem
- Parent Market
- Data Table on - Parent Market
- 2.2 Market characteristics
- Market characteristics analysis
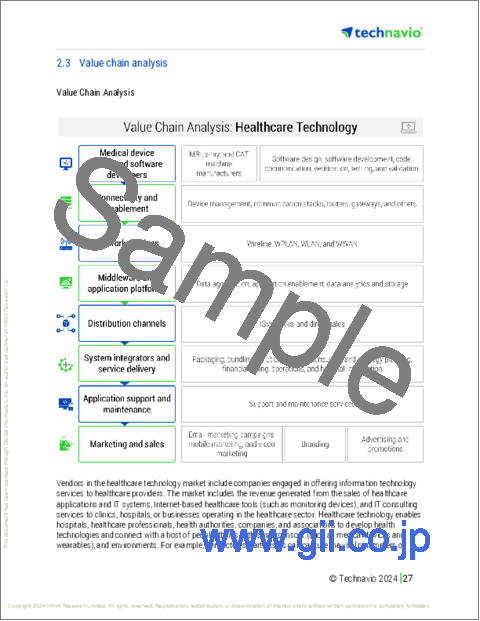
- 2.3 Value chain analysis
- Value Chain Analysis
3 Market Sizing
- 3.1 Market definition
- Offerings of companies included in the market definition
- 3.2 Market segment analysis
- Market segments
- 3.3 Market size 2023
- 3.4 Market outlook: Forecast for 2023-2028
- Chart on Global - Market size and forecast 2023-2028 ($ million)
- Data Table on Global - Market size and forecast 2023-2028 ($ million)
- Chart on Global Market: Year-over-year growth 2023-2028 (%)
- Data Table on Global Market: Year-over-year growth 2023-2028 (%)
4 Historic Market Size
- 4.1 Global Medical Simulation Market 2018 - 2022
- Historic Market Size - Data Table on Global Medical Simulation Market 2018 - 2022 ($ million)
- 4.2 End-user segment analysis 2018 - 2022
- Historic Market Size - End-user Segment 2018 - 2022 ($ million)
- 4.3 Solution segment analysis 2018 - 2022
- Historic Market Size - Solution Segment 2018 - 2022 ($ million)
- 4.4 Geography segment analysis 2018 - 2022
- Historic Market Size - Geography Segment 2018 - 2022 ($ million)
- 4.5 Country segment analysis 2018 - 2022
- Historic Market Size - Country Segment 2018 - 2022 ($ million)
5 Five Forces Analysis
- 5.1 Five forces summary
- Five forces analysis - Comparison between 2023 and 2028
- 5.2 Bargaining power of buyers
- Bargaining power of buyers - Impact of key factors 2023 and 2028
- 5.3 Bargaining power of suppliers
- Bargaining power of suppliers - Impact of key factors in 2023 and 2028
- 5.4 Threat of new entrants
- Threat of new entrants - Impact of key factors in 2023 and 2028
- 5.5 Threat of substitutes
- Threat of substitutes - Impact of key factors in 2023 and 2028
- 5.6 Threat of rivalry
- Threat of rivalry - Impact of key factors in 2023 and 2028
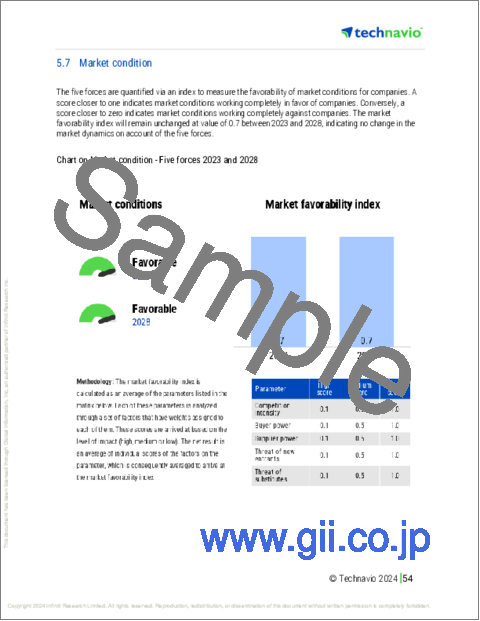
- 5.7 Market condition
- Chart on Market condition - Five forces 2023 and 2028
6 Market Segmentation by End-user
- 6.1 Market segments
- Chart on End-user - Market share 2023-2028 (%)
- Data Table on End-user - Market share 2023-2028 (%)
- 6.2 Comparison by End-user
- Chart on Comparison by End-user
- Data Table on Comparison by End-user
- 6.3 Academic institutes - Market size and forecast 2023-2028
- Chart on Academic institutes - Market size and forecast 2023-2028 ($ million)
- Data Table on Academic institutes - Market size and forecast 2023-2028 ($ million)
- Chart on Academic institutes - Year-over-year growth 2023-2028 (%)
- Data Table on Academic institutes - Year-over-year growth 2023-2028 (%)
- 6.4 Military organizations - Market size and forecast 2023-2028
- Chart on Military organizations - Market size and forecast 2023-2028 ($ million)
- Data Table on Military organizations - Market size and forecast 2023-2028 ($ million)
- Chart on Military organizations - Year-over-year growth 2023-2028 (%)
- Data Table on Military organizations - Year-over-year growth 2023-2028 (%)
- 6.5 Hospitals - Market size and forecast 2023-2028
- Chart on Hospitals - Market size and forecast 2023-2028 ($ million)
- Data Table on Hospitals - Market size and forecast 2023-2028 ($ million)
- Chart on Hospitals - Year-over-year growth 2023-2028 (%)
- Data Table on Hospitals - Year-over-year growth 2023-2028 (%)
- 6.6 Others - Market size and forecast 2023-2028
- Chart on Others - Market size and forecast 2023-2028 ($ million)
- Data Table on Others - Market size and forecast 2023-2028 ($ million)
- Chart on Others - Year-over-year growth 2023-2028 (%)
- Data Table on Others - Year-over-year growth 2023-2028 (%)
- 6.7 Market opportunity by End-user
- Market opportunity by End-user ($ million)
- Data Table on Market opportunity by End-user ($ million)
7 Market Segmentation by Solution
- 7.1 Market segments
- Chart on Solution - Market share 2023-2028 (%)
- Data Table on Solution - Market share 2023-2028 (%)
- 7.2 Comparison by Solution
- Chart on Comparison by Solution
- Data Table on Comparison by Solution
- 7.3 Healthcare anatomical models - Market size and forecast 2023-2028
- Chart on Healthcare anatomical models - Market size and forecast 2023-2028 ($ million)
- Data Table on Healthcare anatomical models - Market size and forecast 2023-2028 ($ million)
- Chart on Healthcare anatomical models - Year-over-year growth 2023-2028 (%)
- Data Table on Healthcare anatomical models - Year-over-year growth 2023-2028 (%)
- 7.4 Web-based simulators - Market size and forecast 2023-2028
- Chart on Web-based simulators - Market size and forecast 2023-2028 ($ million)
- Data Table on Web-based simulators - Market size and forecast 2023-2028 ($ million)
- Chart on Web-based simulators - Year-over-year growth 2023-2028 (%)
- Data Table on Web-based simulators - Year-over-year growth 2023-2028 (%)
- 7.5 Simulation training services - Market size and forecast 2023-2028
- Chart on Simulation training services - Market size and forecast 2023-2028 ($ million)
- Data Table on Simulation training services - Market size and forecast 2023-2028 ($ million)
- Chart on Simulation training services - Year-over-year growth 2023-2028 (%)
- Data Table on Simulation training services - Year-over-year growth 2023-2028 (%)
- 7.6 Healthcare simulation software - Market size and forecast 2023-2028
- Chart on Healthcare simulation software - Market size and forecast 2023-2028 ($ million)
- Data Table on Healthcare simulation software - Market size and forecast 2023-2028 ($ million)
- Chart on Healthcare simulation software - Year-over-year growth 2023-2028 (%)
- Data Table on Healthcare simulation software - Year-over-year growth 2023-2028 (%)
- 7.7 Market opportunity by Solution
- Market opportunity by Solution ($ million)
- Data Table on Market opportunity by Solution ($ million)
8 Customer Landscape
- 8.1 Customer landscape overview
- Analysis of price sensitivity, lifecycle, customer purchase basket, adoption rates, and purchase criteria
9 Geographic Landscape
- 9.1 Geographic segmentation
- Chart on Market share By Geographical Landscape 2023-2028 (%)
- Data Table on Market share By Geographical Landscape 2023-2028 (%)
- 9.2 Geographic comparison
- Chart on Geographic comparison
- Data Table on Geographic comparison
- 9.3 North America - Market size and forecast 2023-2028
- Chart on North America - Market size and forecast 2023-2028 ($ million)
- Data Table on North America - Market size and forecast 2023-2028 ($ million)
- Chart on North America - Year-over-year growth 2023-2028 (%)
- Data Table on North America - Year-over-year growth 2023-2028 (%)
- 9.4 Europe - Market size and forecast 2023-2028
- Chart on Europe - Market size and forecast 2023-2028 ($ million)
- Data Table on Europe - Market size and forecast 2023-2028 ($ million)
- Chart on Europe - Year-over-year growth 2023-2028 (%)
- Data Table on Europe - Year-over-year growth 2023-2028 (%)
- 9.5 Asia - Market size and forecast 2023-2028
- Chart on Asia - Market size and forecast 2023-2028 ($ million)
- Data Table on Asia - Market size and forecast 2023-2028 ($ million)
- Chart on Asia - Year-over-year growth 2023-2028 (%)
- Data Table on Asia - Year-over-year growth 2023-2028 (%)
- 9.6 Rest of World (ROW) - Market size and forecast 2023-2028
- Chart on Rest of World (ROW) - Market size and forecast 2023-2028 ($ million)
- Data Table on Rest of World (ROW) - Market size and forecast 2023-2028 ($ million)
- Chart on Rest of World (ROW) - Year-over-year growth 2023-2028 (%)
- Data Table on Rest of World (ROW) - Year-over-year growth 2023-2028 (%)
- 9.7 US - Market size and forecast 2023-2028
- Chart on US - Market size and forecast 2023-2028 ($ million)
- Data Table on US - Market size and forecast 2023-2028 ($ million)
- Chart on US - Year-over-year growth 2023-2028 (%)
- Data Table on US - Year-over-year growth 2023-2028 (%)
- 9.8 UK - Market size and forecast 2023-2028
- Chart on UK - Market size and forecast 2023-2028 ($ million)
- Data Table on UK - Market size and forecast 2023-2028 ($ million)
- Chart on UK - Year-over-year growth 2023-2028 (%)
- Data Table on UK - Year-over-year growth 2023-2028 (%)
- 9.9 Canada - Market size and forecast 2023-2028
- Chart on Canada - Market size and forecast 2023-2028 ($ million)
- Data Table on Canada - Market size and forecast 2023-2028 ($ million)
- Chart on Canada - Year-over-year growth 2023-2028 (%)
- Data Table on Canada - Year-over-year growth 2023-2028 (%)
- 9.10 China - Market size and forecast 2023-2028
- Chart on China - Market size and forecast 2023-2028 ($ million)
- Data Table on China - Market size and forecast 2023-2028 ($ million)
- Chart on China - Year-over-year growth 2023-2028 (%)
- Data Table on China - Year-over-year growth 2023-2028 (%)
- 9.11 Germany - Market size and forecast 2023-2028
- Chart on Germany - Market size and forecast 2023-2028 ($ million)
- Data Table on Germany - Market size and forecast 2023-2028 ($ million)
- Chart on Germany - Year-over-year growth 2023-2028 (%)
- Data Table on Germany - Year-over-year growth 2023-2028 (%)
- 9.12 Market opportunity By Geographical Landscape
- Market opportunity By Geographical Landscape ($ million)
- Data Tables on Market opportunity By Geographical Landscape ($ million)
10 Drivers, Challenges, and Opportunity/Restraints
- 10.1 Market drivers
- 10.2 Market challenges
- 10.3 Impact of drivers and challenges
- Impact of drivers and challenges in 2023 and 2028
- 10.4 Market opportunities/restraints
11 Competitive Landscape
- 11.1 Overview
- 11.2 Competitive Landscape
- Overview on criticality of inputs and factors of differentiation
- 11.3 Landscape disruption
- Overview on factors of disruption
- 11.4 Industry risks
- Impact of key risks on business
12 Competitive Analysis
- 12.1 Companies profiled
- Companies covered
- 12.2 Market positioning of companies
- Matrix on companies position and classification
- 12.3 Altay Scientific
- Altay Scientific - Overview
- Altay Scientific - Product / Service
- Altay Scientific - Key offerings
- 12.4 CAE Inc.
- CAE Inc. - Overview
- CAE Inc. - Business segments
- CAE Inc. - Key offerings
- CAE Inc. - Segment focus
- 12.5 Cardionics Inc.
- Cardionics Inc. - Overview
- Cardionics Inc. - Product / Service
- Cardionics Inc. - Key offerings
- 12.6 Gaumard Scientific Co. Inc.
- Gaumard Scientific Co. Inc. - Overview
- Gaumard Scientific Co. Inc. - Product / Service
- Gaumard Scientific Co. Inc. - Key offerings
- 12.7 IngMar Medical
- IngMar Medical - Overview
- IngMar Medical - Product / Service
- IngMar Medical - Key offerings
- 12.8 Intelligent Ultrasound Group
- Intelligent Ultrasound Group - Overview
- Intelligent Ultrasound Group - Business segments
- Intelligent Ultrasound Group - Key offerings
- Intelligent Ultrasound Group - Segment focus
- 12.9 Kyoto Kagaku Co. Ltd.
- Kyoto Kagaku Co. Ltd. - Overview
- Kyoto Kagaku Co. Ltd. - Product / Service
- Kyoto Kagaku Co. Ltd. - Key offerings
- 12.10 Laerdal Medical AS
- Laerdal Medical AS - Overview
- Laerdal Medical AS - Product / Service
- Laerdal Medical AS - Key offerings
- 12.11 Limbs and Things Ltd.
- Limbs and Things Ltd. - Overview
- Limbs and Things Ltd. - Product / Service
- Limbs and Things Ltd. - Key offerings
- 12.12 Medical-X
- Medical-X - Overview
- Medical-X - Product / Service
- Medical-X - Key offerings
- 12.13 Mentice AB
- Mentice AB - Overview
- Mentice AB - Business segments
- Mentice AB - Key offerings
- Mentice AB - Segment focus
- 12.14 Operative Experience Inc.
- Operative Experience Inc. - Overview
- Operative Experience Inc. - Product / Service
- Operative Experience Inc. - Key offerings
- 12.15 Simulab Corp.
- Simulab Corp. - Overview
- Simulab Corp. - Product / Service
- Simulab Corp. - Key offerings
- 12.16 Trucorp Ltd.
- Trucorp Ltd. - Overview
- Trucorp Ltd. - Product / Service
- Trucorp Ltd. - Key offerings
- 12.17 VirtaMed AG
- VirtaMed AG - Overview
- VirtaMed AG - Product / Service
- VirtaMed AG - Key offerings
13 Appendix
- 13.1 Scope of the report
- 13.2 Inclusions and exclusions checklist
- Inclusions checklist
- Exclusions checklist
- 13.3 Currency conversion rates for US$
- Currency conversion rates for US$
- 13.4 Research methodology
- Research methodology
- 13.5 Data procurement
- Information sources
- 13.6 Data validation
- Data validation
- 13.7 Validation techniques employed for market sizing
- Validation techniques employed for market sizing
- 13.8 Data synthesis
- Data synthesis
- 13.9 360 degree market analysis
- 360 degree market analysis
- 13.10 List of abbreviations
- List of abbreviations

