|
|
市場調査レポート
商品コード
1915358
自動車用ジャンクションボックスの世界市場、2025年~2029年Global Automotive Junction Box Market 2025-2029 |
||||||
|
|||||||
カスタマイズ可能
|
|||||||

| 自動車用ジャンクションボックスの世界市場、2025年~2029年 |
|
出版日: 2026年01月19日
発行: TechNavio
ページ情報: 英文 294 Pages
納期: 即納可能
|

概要
世界の自動車用ジャンクションボックス市場は、2024年から2029年の予測期間において、CAGR 10.5%で49億620万米ドルの成長が見込まれております。
本報告書では、世界の自動車用ジャンクションボックス市場に関する包括的な分析、市場規模と予測、動向、成長要因、課題に加え、約25社のベンダー分析を提供しております。
本レポートは、現在の市場状況、最新の動向と促進要因、市場環境全般に関する最新の分析を提供します。市場は、ハイブリッドおよび電気パワートレインの普及、車両における電子アプリケーションの増加、リセット可能なポリスイッチデバイスが自動車用ジャンクションボックス産業を牽引していることにより推進されています。
本調査は、業界の主要関係者からの情報を含む、一次情報と二次情報の客観的な組み合わせを用いて実施されました。本レポートには、主要企業の分析に加え、包括的な市場規模データ、地域別分析を伴うセグメント、ベンダー情勢が含まれています。レポートには過去データと予測データが掲載されています。
| 市場範囲 | |
|---|---|
| 基準年 | 2025年 |
| 終了年 | 2029年 |
| 予測期間 | 2025年~2029年 |
| 成長モメンタム | 加速 |
| 前年比 | 9% |
| CAGR | 10.5% |
| 増分額 | 49億620万米ドル |
本調査では、ジャンクションボックスの機能統合が、今後数年間における世界の自動車用ジャンクションボックス市場の成長を牽引する主要な要因の一つであると特定しております。また、自動車用ジャンクションボックス産業に恩恵をもたらす軽量かつ耐熱性のある電気部品用複合材料、ならびに自動運転車の普及拡大が、市場における相当な需要につながると予想されます。
目次
第1章 エグゼクティブサマリー
第2章 Technavio分析
- 価格・ライフサイクル・顧客購入バスケット・採用率・購入基準の分析
- インプットの重要性と差別化の要因
- 混乱の要因
- 促進要因と課題の影響
第3章 市場情勢
- 市場エコシステム
- 市場の特徴
- バリューチェーン分析
第4章 市場規模
- 市場の定義
- 市場セグメント分析
- 市場規模、2024年
- 市場の見通し、2024年~2029年
第5章 市場規模実績
- 世界の自動車用ジャンクションボックス市場、2019年~2023年
- 車両タイプ別セグメント分析、2019年~2023年
- 技術別セグメント分析、2019年~2023年
- チャネル別セグメント分析、2019年~2023年
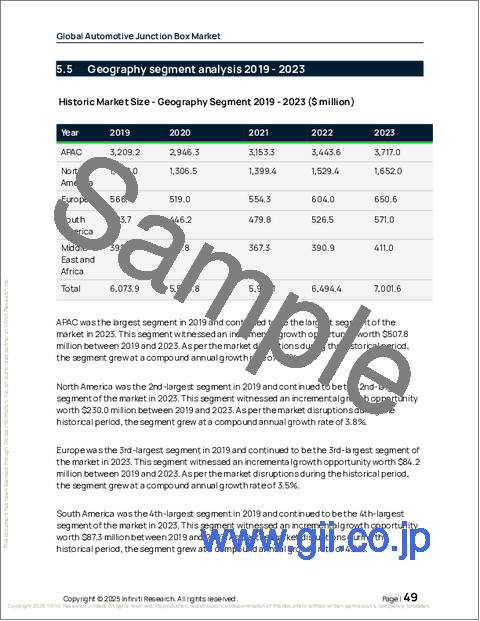
- 地域別セグメント分析、2019年~2023年
- 国別セグメント分析、2019年~2023年
第6章 定性分析
- AIの影響:世界の自動車用ジャンクションボックス市場
第7章 ファイブフォース分析
- ファイブフォースの要約
- 買い手の交渉力
- 供給企業の交渉力
- 新規参入業者の脅威
- 代替品の脅威
- 競争の脅威
- 市況
第8章 市場セグメンテーション:車両タイプ別
- 比較:車両タイプ別
- 乗用車
- 商用車
- 市場機会:車両タイプ別
第9章 市場セグメンテーション:技術別
- 比較:技術別
- スマートジャンクションボックス
- パッシブジャンクションボックス
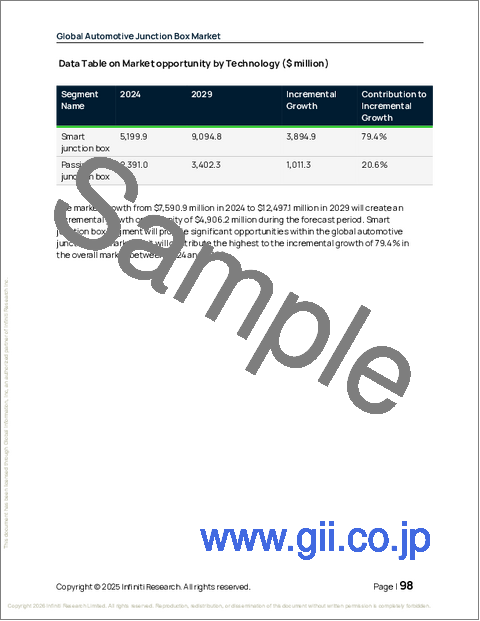
- 市場機会:技術別
第10章 市場セグメンテーション:チャネル別
- 比較:チャネル別
- OEM
- アフターマーケット
- 市場機会:チャネル別
第11章 顧客情勢
第12章 地域別情勢
- 地域別セグメンテーション
- 地域別比較
- アジア太平洋
- 日本
- 中国
- インド
- 韓国
- オーストラリア
- インドネシア
- 北米
- 米国
- カナダ
- メキシコ
- 欧州
- ドイツ
- 英国
- フランス
- イタリア
- スペイン
- オランダ
- 南米
- ブラジル
- アルゼンチン
- コロンビア
- 中東・アフリカ
- アラブ首長国連邦
- サウジアラビア
- 南アフリカ
- エジプト
- ナイジェリア
- 市場機会:地域別
第13章 促進要因・課題・機会
- 市場促進要因
- 市場の課題
- 促進要因と課題の影響
- 市場機会
第14章 競合情勢
- 概要
- 競合情勢
- 混乱の状況
- 業界のリスク
第15章 競合分析
- 企業プロファイル
- 企業ランキング指標
- 企業の市場ポジショニング
- Amphenol Corp.
- Aptiv Plc
- BorgWarner Inc.
- Continental AG
- Eaton Corp. plc
- Fujikura Co. Ltd.
- Lear Corp.
- Leoni AG
- Motherson Group
- ON Semiconductor Corp.
- Sumitomo Electric Industries Ltd.
- TE Connectivity Ltd.
- Valeo SA
- Vitesco Technologies Group AG
- Yazaki Corp.

