|
|
市場調査レポート
商品コード
1908365
世界の携帯型分析機器市場2026-2030年Global Portable Analytical Instrument Market 2026-2030 |
||||||
|
|||||||
カスタマイズ可能
|
|||||||

| 世界の携帯型分析機器市場2026-2030年 |
|
出版日: 2026年01月14日
発行: TechNavio
ページ情報: 英文 318 Pages
納期: 即納可能
|

概要
世界の携帯型分析機器市場は、2025年から2030年にかけて36億420万米ドルの成長が見込まれ、予測期間中のCAGRは6.0%と予測されております。
本報告書では、世界の携帯型分析機器市場に関する包括的な分析、市場規模と予測、動向、成長要因、課題に加え、約25社のベンダー分析を提供しております。
本レポートは、現在の市場状況、最新の動向と促進要因、市場環境全般に関する最新の分析を提供します。市場は、技術進歩と機器の小型化の普及、規制順守と安全基準の厳格化、重要エンドユーザー産業における現場分析の需要増加によって牽引されています。
本調査は、業界の主要関係者からの情報を含む、一次情報と二次情報の客観的な組み合わせを用いて実施されました。本レポートには、主要企業の分析に加え、包括的な市場規模データ、地域別分析を伴うセグメント、ベンダー情勢が含まれています。レポートには過去データと予測データが掲載されています。
| 市場範囲 | |
|---|---|
| 基準年 | 2026年 |
| 対象年度 | 2030年 |
| 予測期間 | 2026-2030 |
| 成長モメンタム | 加速 |
| 前年比2026年 | 5.7% |
| CAGR | 6% |
| 増分額 | 36億420万米ドル |
本調査では、接続型計測機器およびデータ・アズ・ア・サービス(Data as a Service)モデルの台頭が、今後数年間における世界の携帯型分析機器市場の成長を牽引する主要な要因の一つであると特定しております。また、専用設計機器の普及、分析技術の民主化、ならびにマルチモーダル機器やセンサー融合機器による分析技術の融合が進むことで、市場において相当な需要が生じると見込まれます。
目次
第1章 エグゼクティブサマリー
- 市場概要
第2章 Technavio分析
- 価格・ライフサイクル・顧客購入バスケット・採用率・購入基準の分析
- インプットの重要性と差別化の要因
- 混乱の要因
- 促進要因と課題の影響
第3章 市場情勢
- 市場エコシステム
- 市場の特徴
- バリューチェーン分析
第4章 市場規模
- 市場の定義
- 市場セグメント分析
- 市場規模 2025
- 市場の見通し 2025-2030
第5章 市場規模実績
- 世界の携帯型分析機器市場 2020-2024
- 製品セグメント分析 2020-2024
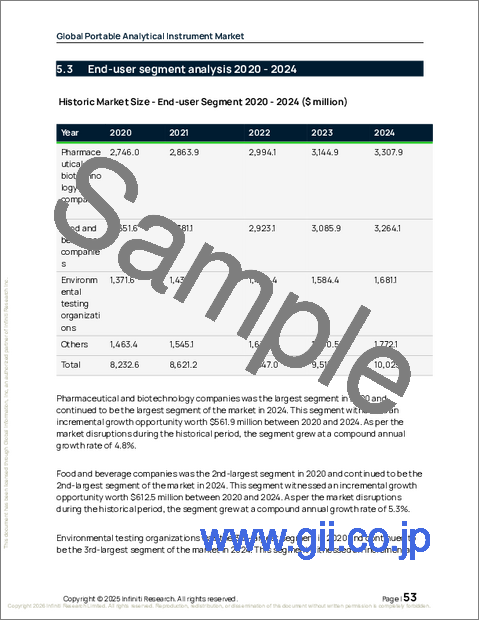
- エンドユーザーセグメント分析 2020-2024
- 技術セグメント分析 2020-2024
- 地域別セグメント分析 2020-2024
- 国別セグメント分析 2020-2024
第6章 定性分析
- AIの影響:世界の携帯型分析機器市場
第7章 ファイブフォース分析
- ファイブフォースの要約
- 買い手の交渉力
- 供給企業の交渉力
- 新規参入業者の脅威
- 代替品の脅威
- 競争の脅威
- 市況
第8章 市場セグメンテーション:製品別
- 市場セグメント
- 比較:製品別
- 分光計:市場規模と予測 2025-2030
- ガス・TOC分析装置:市場規模と予測 2025-2030
- 熱分析装置:市場規模と予測 2025-2030
- その他:市場規模と予測 2025-2030
- 市場機会:製品別
第9章 市場セグメンテーション:エンドユーザー別
- 市場セグメント
- 比較:エンドユーザー別
- 製薬・バイオテクノロジー企業:市場規模と予測 2025-2030
- 食品・飲料メーカー:市場規模と予測 2025-2030
- 環境試験機関:市場規模と予測 2025-2030
- その他:市場規模と予測 2025-2030
- 市場機会:エンドユーザー別
第10章 市場セグメンテーション:技術別
- 市場セグメント
- 比較:技術別
- 分光分析:市場規模と予測 2025-2030
- 元素分析:市場規模と予測 2025-2030
- その他:市場規模と予測 2025-2030
- 市場機会:技術別
第11章 顧客情勢
- 顧客情勢の概要
第12章 地域別情勢
- 地域別セグメンテーション
- 地域別比較
- アジア:市場規模と予測 2025-2030
- 北米:市場規模と予測 2025-2030
- 欧州:市場規模と予測 2025-2030
- 世界のその他の地域:市場規模と予測 2025-2030
- 市場機会:地域別
第13章 促進要因、課題、および機会
- 市場促進要因
- 市場の課題
- 促進要因と課題の影響
- 市場機会
第14章 競合情勢
- 概要
- 競合情勢
- 混乱の状況
- 業界のリスク
第15章 競合分析
- 企業プロファイル
- 企業ランキング指標
- 企業の市場ポジショニング
- Agilent Technologies Inc.
- Bio Rad Laboratories Inc.
- Bruker Corp.
- Danaher Corp.
- Eppendorf SE
- F. Hoffmann La Roche Ltd.
- Hitachi Ltd.
- HORIBA Ltd.
- METTLER TOLEDO
- PerkinElmer US LLC
- Shimadzu Corp.
- Spectris plc
- Teledyne Technologies Inc.
- Thermo Fisher Scientific Inc.
- Waters Corp.

